July 10, 2026
When the Crowd Panics, History Rewards the Patient
Secular bull markets in commodities have always been defined less by their peaks than by the corrections that test conviction along the way. Gold is no different. The precious metal's long-term advance cycles tend to unfold over decades, interrupted by sharp pullbacks that feel catastrophic in the moment but register as barely perceptible blips on multi-year charts. Understanding where the current environment fits within that broader framework is arguably the most important analytical question facing gold investors today.
The thesis is straightforward, if uncomfortable: the gold selloff is just a pause in a secular bull market, not the beginning of a structural reversal. The structural evidence supporting that view is substantial, and the weight of historical precedent reinforces it.
When big ASX news breaks, our subscribers know first
The Anatomy of a Secular Gold Bull Market
Secular Cycles vs. Cyclical Noise
Not all gold price declines carry equal analytical weight. The critical distinction is between cyclical corrections within a larger secular trend and genuine secular reversals that signal a multi-year bear market. Cyclical corrections are driven by short-term sentiment shifts, positioning flushes, and macro noise. Secular reversals require a fundamental dismantling of the demand architecture that built the advance in the first place.
Historical analysis of gold secular cycles reveals that these advances typically span 8 to 13 years from initiation to peak. Importantly, they are never linear. Mid-cycle corrections of 15% to 30% or more are a normal, even necessary, feature of these cycles because they eliminate speculative excess and rebuild a more durable demand base for the acceleration phase that follows.
Mapping the Current Cycle Against Historical Phases
The current secular advance in gold, generally traced from around 2022 to 2024 in its accumulation phase, appears to be transitioning through a mid-cycle correction consistent with prior historical templates. The following framework illustrates where the market likely sits today:
| Secular Bull Market Phase | Estimated Duration | Key Characteristic | Current Cycle Equivalent |
|---|---|---|---|
| Early Accumulation | 1-3 years | Institutional buying, low retail interest | 2022-2024 |
| Mid-Cycle Correction | 6-18 months | Speculative flush, sentiment reset | 2025-2026 (present) |
| Acceleration Phase | 2-4 years | Broad participation, momentum builds | Approaching |
| Blowoff Top | 6-18 months | Public mania, extreme valuations | Projected 2033-2035 |
If this framework holds, the current correction represents approximately the midpoint of the broader secular advance rather than its conclusion. The most significant price gains in prior cycles have historically occurred during and after the acceleration phase, not before it.
Structural Forces That Make This Selloff Different
Sovereign Debt as a Permanent Demand Catalyst
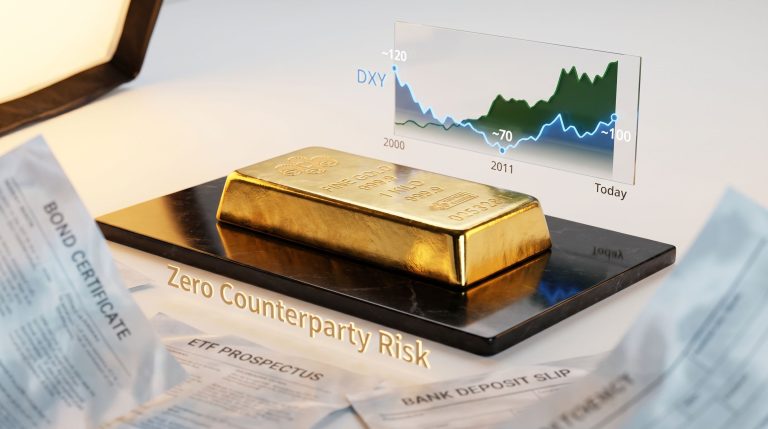
Global sovereign debt has reached levels that make meaningful fiscal consolidation politically and economically impractical across most major economies. The United States federal debt trajectory, mirrored in varying degrees across Europe and Japan, creates a persistent incentive for reserve diversification away from fiat-denominated instruments. Gold is the primary beneficiary of that structural shift because it carries no counterparty risk and cannot be printed.
This dynamic is not sensitive to quarterly interest rate decisions. It operates across electoral cycles and central bank mandate changes, meaning it functions as a baseline demand floor irrespective of short-term macro headwinds.
Central Bank Purchasing: The Market's Hidden Floor
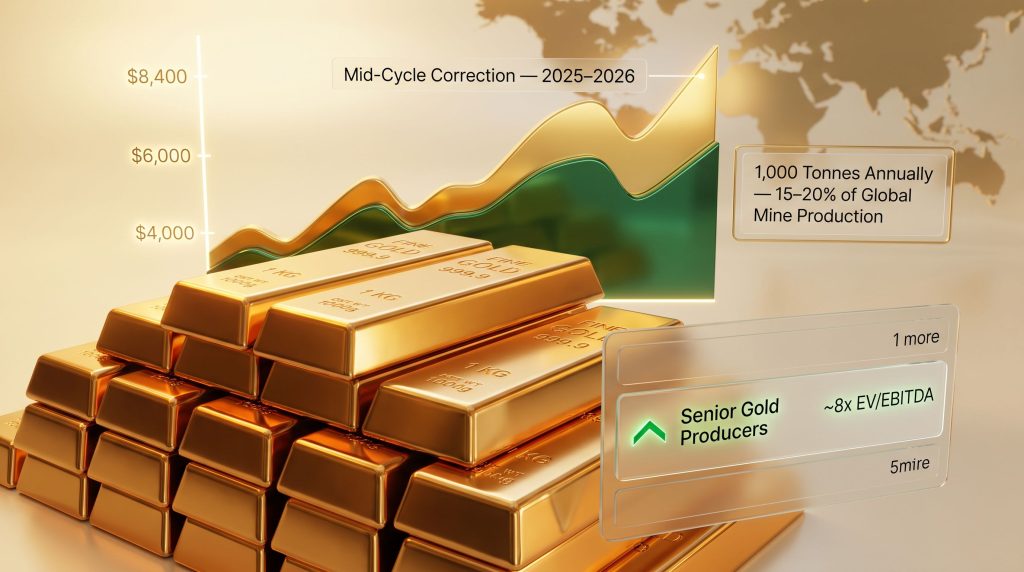
Perhaps the most underappreciated driver of gold's current cycle is the sustained pace of acquisition. Central bank gold demand has been running at approximately 1,000 tonnes annually, a figure that represents 15% to 20% of total annual mine production worldwide.
A buyer of that scale, operating consistently across market cycles, fundamentally changes the price floor dynamic. Unlike speculative investors who reduce exposure during corrections, sovereign institutions tend to accelerate purchases when prices dip, converting volatility into a structural support mechanism.
This pattern was clearly visible when gold briefly tested levels below $4,000 per ounce during the current correction. Physical market buyers, with central banks prominently among them, stepped in aggressively at that level, producing a swift recovery. That price behaviour is not coincidental. It reflects the presence of a buyer with a mandate and a balance sheet large enough to absorb retail and institutional selling pressure.
Geopolitical Fragmentation and Dollar Erosion
The gradual erosion of the U.S. dollar's unipolar reserve currency status represents a slow-moving but powerful structural tailwind for gold. Furthermore, the gold safe-haven dynamics at play are reinforced by geopolitical fragmentation, the weaponisation of dollar-denominated payment systems, and the accelerating pace of bilateral trade settlements in non-dollar currencies — all of which have contributed to increased sovereign demand for neutral reserve assets.
These dynamics do not reverse in months. They develop across years and decades, which means short-term dollar strength driven by Federal Reserve policy expectations does not functionally alter the underlying demand architecture.
How Significant Is This Correction Historically?
Comparing Current Weakness to Prior Mid-Cycle Events
Context matters enormously when evaluating gold corrections. The following comparison situates the current pullback within its historical peer group:
| Correction Event | Approximate Decline | Recovery Period | Bull Market Outcome |
|---|---|---|---|
| 2008 Financial Crisis Pullback | ~30% | ~8 months | Bull market resumed, new highs followed |
| 2020 COVID Correction | ~28% | ~3 months | Rapid recovery to record levels |
| 2025-2026 Current Pullback | Modest by comparison | TBD | Structural drivers remain intact |
The current correction, while sharp enough to generate significant negative sentiment, remains well within the historical range of mid-cycle resets that have occurred without disrupting long-term secular advances.
The $4,000/oz Level as a Demand-Driven Floor
The significance of the $4,000 per ounce level extends beyond technical chart analysis. It represents a price point at which physical market demand, anchored by central bank purchasing, has consistently outweighed selling pressure. This is a qualitatively different type of support than a moving average or a Fibonacci retracement level. It reflects actual institutional buying behaviour at scale.
For investors evaluating whether the current environment constitutes a bear market or a buying opportunity, the behaviour of gold around $4,000 per ounce provides a meaningful signal. Speculative long positions have been largely flushed from the market during the correction, which historically creates a cleaner demand base for the next upward phase. According to MKS PAMP's analysis, this correction has effectively reset the market, with analysts still projecting a $4,500 average price target ahead.
Gold Mining Equities: Fundamentals vs. Market Pricing
A Widening Valuation Disconnect
The correction in gold prices has been accompanied by an even sharper decline in gold mining equities, creating a potentially significant disconnect between financial fundamentals and market valuations. Despite gold trading above $4,000 per ounce, many senior producers are currently priced at approximately 8x EV/EBITDA, a multiple that compresses toward 6x if gold advances toward $5,000 per ounce. Both figures sit materially below the sector's long-term historical valuation averages.
This is the analytical core of what makes the current environment unusual: companies generating record or near-record free cash flow margins are being valued as though earnings are at risk of deterioration rather than expansion.
AISC Margins at Current Price Levels
The financial health of gold producers at current spot prices is best understood through the lens of all-in sustaining costs (AISC). In addition, gold mining equity leverage makes this analysis particularly relevant for investors seeking amplified exposure to the secular trend. Key metrics at current gold prices include:
- Current gold price range: Above $4,000 per ounce
- Estimated industry AISC margins: Approximately $3,000 per ounce
- Implication: Producers are generating very substantial free cash flow even after absorbing recent inflationary cost pressures
Rising energy prices have introduced some margin headwinds, with estimates suggesting oil price persistence could add between $70 and $95 per ounce to operating costs and potentially lift industry-wide costs by as much as 20% over the following year. However, current gold prices absorb that cost inflation with meaningful margin to spare.
How the Sector Is Managing Cost Pressures
Gold producers have demonstrated considerable operational discipline in managing the energy cost environment:
- Fuel hedging programmes entered prior to energy price spikes have provided near-term cost insulation
- Strategic inventory purchasing at lower input price levels has buffered operational cost structures
- Conservative mine planning has prioritised margin protection over raw production volume growth
- Exploration investment has been directed toward higher-grade targets to protect unit economics
Capital Returns as Evidence of Sector Health
The financial discipline of the current gold mining sector is also visible in capital allocation behaviour:
- Share buyback programmes have continued despite equity market volatility
- Dividend distributions have been sustained through the correction period
- Balance sheets remain largely debt-light, providing strategic and operational flexibility
- Acquisition activity has been focused on value enhancement rather than production volume for its own sake
This combination of strong free cash flow generation, disciplined capital returns, and conservative balance sheets represents a sector financial profile that stands in sharp contrast to the market valuations currently being assigned to these businesses.
Technical Architecture of the Secular Bull Market
Three Structural Signals That Confirmed the Secular Shift
The technical case for gold's secular bull market rests on several significant formations and breakout events that have played out over the past several years:
- 13-Year Cup and Handle Pattern Completion — The cup and handle pattern resolved to the upside across a multi-decade base formation, confirming a structural breakout with significant technical weight
- Outperformance of the 60/40 Portfolio Benchmark — Gold's sustained outperformance relative to traditional balanced portfolio returns signalled a portfolio construction regime change among institutional allocators
- Inflation-Adjusted Price Clearing a 45-Year Base — Real gold prices breaking above long-term resistance confirmed that the secular bull thesis was supported by purchasing power dynamics, not simply nominal price inflation
Where Are We in the Technical Channel?
The current correction appears to represent a test of the midline within the secular bull market's price channel structure. Such tests are typical of mid-cycle corrections and often precede some of the most powerful acceleration phases in a secular advance. The key technical question is not whether gold will test support, but whether it will hold. Physical demand behaviour around the $4,000 level suggests the answer to that question is affirmative.
Price Discovery Scenarios for the Acceleration Phase
Analyst projections for the current secular cycle span a wide range, with scenario-dependent estimates including gold averaging around $6,000 per ounce by late 2026, advancing toward $6,300 per ounce through 2027, and historical cycle magnitude models suggesting a potential secular peak in the $8,400 per ounce range. Some more extreme long-term scenarios have cited figures as high as $20,000 per ounce as a theoretical secular peak threshold, though this represents a highly speculative outer boundary rather than a base case. Consequently, analysts assessing whether the bull market is over have largely concluded that structural conditions do not yet support that conclusion.
These projections are inherently uncertain and should be evaluated as scenario frameworks rather than forecasts. Gold price prediction involves significant uncertainty, and actual outcomes may differ materially from any analyst projection.
The next major ASX story will hit our subscribers first
Macro Conditions Creating Short-Term Headwinds
Federal Reserve Policy and the Sentiment Distortion Effect
The current market environment has become heavily dominated by Federal Reserve policy expectations. Uncertainty surrounding the central bank's rate trajectory, combined with questions about institutional leadership direction, has created a sentiment headwind for gold by strengthening the U.S. dollar and elevating real interest rate expectations.
However, the analytical error many investors make is conflating short-term sentiment drivers with long-term structural ones. Federal Reserve decisions affect sentiment. They do not alter sovereign debt trajectories, geopolitical fragmentation dynamics, or the structural incentive for central banks to diversify reserves. These forces operate on fundamentally different timescales.
The current market narrative is overwhelmingly focused on near-term Federal Reserve decisions and incremental economic data points. This short-termism creates a perceptual gap between daily price action and the multi-decade structural forces that are actually driving gold's secular advance.
Dollar Strength: Cyclical Headwind, Not Structural Reversal
Dollar strength driven by interest rate differentials represents a cyclical headwind for gold rather than a structural change in the long-term relationship between fiat currency credibility and gold demand. Historically, periods of dollar-driven gold weakness within secular bull markets have consistently resolved in gold's favour as the rate differential catalyst fades.
What Would Actually End This Bull Market?
The Three Conditions That Historically Signal a Secular Peak
Secular commodity bull markets do not end because of sentiment shifts or short-term policy changes. They end when the structural conditions that drove them are fundamentally resolved. For gold, three historical convergence criteria define a genuine secular top:
- Extreme Absolute Valuations — Some analysts cite prices in the range of $20,000 per ounce as the threshold where gold's risk-reward profile would deteriorate fundamentally, though this is highly speculative
- Widespread Public Participation and Media Mania — Retail investor saturation and mainstream financial media obsession with gold have historically preceded secular peaks by 6 to 18 months
- Fundamental Monetary Regime Shift — A credible, sustained resolution to sovereign debt imbalances and a structural restoration of fiat currency credibility
Why None of These Conditions Are Present Today
None of the three criteria above describe the current market environment. Retail participation in gold remains well below prior cycle peaks. Mainstream financial media coverage of gold is elevated but not euphoric. And sovereign debt trajectories across major economies show no credible path toward structural resolution.
Perhaps most tellingly, the institutional money that typically pours into gold during acceleration phases has not yet arrived in scale. Mining equity valuations at 8x EV/EBITDA, compared to historical averages that have frequently exceeded 12x to 15x during bull market peaks, reflect an industry that has not yet attracted the broad institutional capital flows that characterise a mature or exhausted bull market.
Investment Framework: Navigating the Pause
Emotional Discipline as the Core Competency
Mid-cycle corrections in secular bull markets are designed, structurally speaking, to test investor conviction. The correction itself is a mechanism for transferring assets from impatient, sentiment-driven holders to patient, thesis-driven ones. The investors who have historically captured the most value in secular gold cycles are those who maintained disciplined exposure through periods of maximum pessimism rather than those who attempted to time short-term swings.
The Case for Maintaining Exposure
The structural case for holding gold-related exposure through the current volatility rests on several pillars:
- The long-term secular thesis remains analytically intact
- Valuation entry points for mining equities are at multi-year lows relative to earnings
- Physical demand floors have demonstrated real resilience at key price levels
- Central bank purchasing pace shows no evidence of deceleration
- The acceleration phase of the secular cycle has not yet arrived, meaning the largest potential gains may still lie ahead
Evaluating Investment Vehicles: A Risk-Return Comparison
| Investment Vehicle | Current Valuation Signal | Key Risk Factor | Upside Leverage |
|---|---|---|---|
| Physical Gold / Bullion | Near structural support | Storage and currency costs | 1:1 with gold price |
| Senior Gold Producers | ~8x EV/EBITDA (below historical avg.) | Energy cost inflation | 2-3x gold price leverage |
| Gold ETFs | Reflects spot price | Management fees, counterparty exposure | Tracks bullion closely |
| Junior Explorers | Highly speculative | Capital access, exploration risk | Highest leverage, highest risk |
Frequently Asked Questions
Is the gold selloff the beginning of a new bear market?
The structural evidence does not support a bear market interpretation. Sustained central bank demand at approximately 1,000 tonnes per year, persistent sovereign debt expansion, and ongoing geopolitical fragmentation represent demand drivers that have not been resolved by the current correction. Historical corrections of comparable or greater magnitude have consistently occurred within ongoing secular bull markets without disrupting the long-term trend. Indeed, the gold selloff is just a pause in a secular bull market when evaluated against these structural fundamentals.
How long could the current pause last?
Mid-cycle corrections within gold secular bull markets have historically ranged from several months to approximately 18 months in duration. The length of the current pause depends heavily on Federal Reserve policy trajectory and near-term dollar behaviour, though physical demand appears to provide a well-supported floor at current price levels.
Are gold mining stocks a compelling investment during a correction?
Senior producers generating approximately $3,000 per ounce in AISC margins while trading at 8x EV/EBITDA represent a valuation profile that has historically been associated with compelling multi-year entry points. For investors with a time horizon aligned with the secular cycle, the current disconnect between fundamentals and market pricing is noteworthy.
How much gold are central banks purchasing annually?
Central bank gold purchases have been running at approximately 1,000 tonnes per year, equivalent to 15% to 20% of global annual mine production. This sustained institutional demand creates a structural price floor that absorbs selling pressure during market corrections.
The Long View: Patience as the Defining Investment Variable
Separating Signal from Noise
The current environment generates an unusually high volume of headline noise. Federal Reserve meeting minutes, economic data releases, and currency market movements all create short-term volatility that can feel definitive but rarely alters the multi-year structural picture. The analytical discipline required in this environment is not predicting the next data point. It is maintaining clarity about which forces are structural and which are cyclical.
What History Suggests About Exiting During Mid-Cycle Corrections
Investors who exited gold positions during the 2008 pullback of approximately 30%, or the 2020 correction of approximately 28%, missed the subsequent acceleration phases that produced the most significant gains of those respective cycles. The pattern is consistent across precious metals history: the correction that feels most threatening to long-term thesis integrity is often the one that immediately precedes the most powerful advance.
Preparing for the Acceleration Phase Before It Arrives
The most important practical implication of the secular framework is the timing of preparation. Acceleration phases in secular gold bull markets tend to arrive faster than market consensus anticipates and produce gains that compress significantly in duration. Investors and portfolio managers who are positioned before the acceleration phase begins have historically captured returns that those who waited for confirmation have largely missed.
Secular bull markets in gold are punctuated by corrections that test investor conviction precisely because those corrections are necessary to reset speculative excess and build a more durable foundation for the next advance. The current correction, viewed through that lens, is not a reason to exit. It is arguably a reason to pay closer attention.
This article is intended for informational and educational purposes only and does not constitute financial advice. All price projections, analyst forecasts, and valuation estimates referenced involve significant uncertainty and should not be relied upon as predictions of future outcomes. Investors should conduct their own due diligence and consult with qualified financial professionals before making investment decisions.
Want to Know When the Next Major ASX Gold Discovery Hits the Market?
Discovery Alert's proprietary Discovery IQ model delivers real-time alerts the moment significant mineral discoveries are announced on the ASX, transforming complex geological data into actionable insights for investors at every level — start your 14-day free trial today and explore historic discovery returns to understand just how transformative the acceleration phase of a secular bull market can be.