June 17, 2026
Why the Mining Sector's Most Compelling Opportunities Keep Circling Back to Three Metals
Commodity cycles have a habit of generating noise. Dozens of metals compete for investor attention, each with its own narrative, its own supply story, and its own set of promoters. Yet when the analysis is stripped back to fundamentals, the same three metals repeatedly demonstrate the most durable investment case: gold, silver, and copper. Not because other metals lack relevance, but because these three sit at the intersection of monetary demand, industrial necessity, and structural supply scarcity in ways that no other metals currently match.
Understanding why this three-metal framework holds up, what the structural price outlook looks like across each, and where the risks genuinely lie is essential for any investor or operator navigating the gold, silver, and copper mining outlook over the next decade.
When big ASX news breaks, our subscribers know first
The Case for a Three-Metal Framework in Resource Investment
Gold, Silver, and Copper: Three Roles, One Unified Thesis
Copper occupies an almost irreplaceable position in modern industrial society. From electricity transmission to electric vehicle motors, from renewable energy infrastructure to data centres, copper is embedded in virtually every technology transition underway globally. Gold, by contrast, operates as a monetary asset, a reserve holding, and a geopolitical hedge, with central banks increasingly treating it as a strategic balance sheet instrument.
Silver sits between the two, carrying both an industrial consumption floor driven by solar panels, electronics, and EV technology, and a monetary premium that tracks gold during periods of investor accumulation.
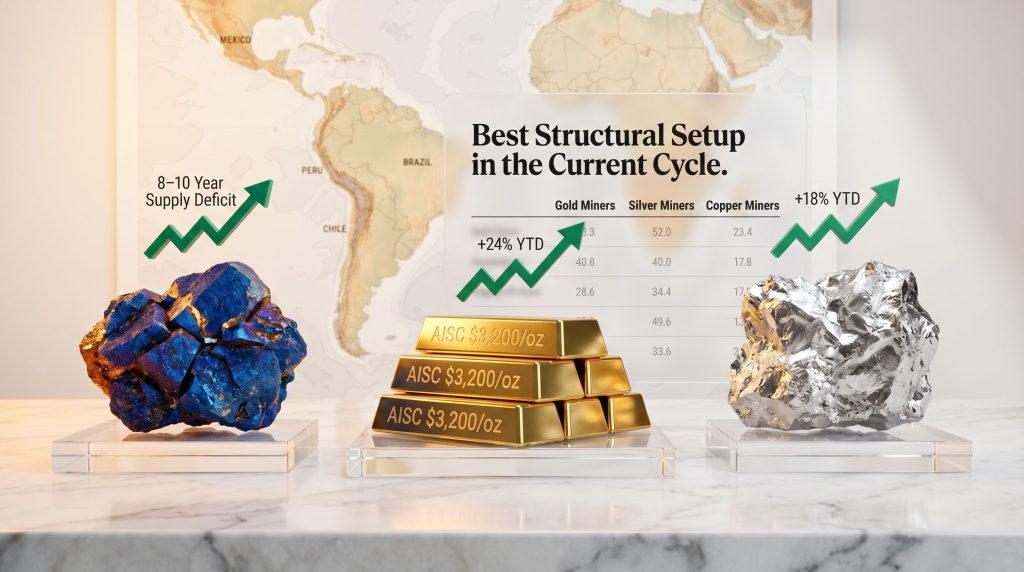
What unites all three is a supply constraint that cannot be resolved quickly. New mine development, across any of these metals, takes between eight and ten years from discovery to commercial production. This is not a policy problem or a capital allocation problem in isolation. It is a geological and logistical reality.
Even if every exploration project currently in development were fast-tracked today, the structural supply deficit across gold, silver, and copper would persist well into the early 2030s. Furthermore, energy transition demand continues to accelerate the consumption side of the equation, compounding pressure on already constrained supply pipelines.
The structural supply deficit across gold, silver, and copper cannot be resolved in the short term, no matter how aggressively capital is deployed today. The timeline from greenfield discovery to first production routinely spans a decade, meaning current price support is built on foundations that will not shift quickly.
This is the core of a 5 to 10 year constructive base case for structurally higher resource prices, a view increasingly reflected in institutional research, though not yet fully priced into mining equities.
Gold Mining Outlook: Operational Leverage Still Waiting to Be Priced In
Central Bank Demand and the Structural Price Floor for Gold
Gold's price support in the current cycle rests on several reinforcing pillars. Central bank gold demand has shifted from cyclical to structural, with emerging market central banks in particular diversifying away from US dollar reserves. Geopolitical fragmentation has accelerated this trend considerably.
ETF inflows, which lagged initial price moves in 2023 and 2024, have begun to catch up, adding a second demand layer that historically extends bull market duration.
S&P Global has projected all-in sustaining cost (AISC) margins above $3,200 per ounce for gold miners through 2026. This is not a speculative figure. It reflects gold prices that have moved substantially faster than production cost inflation, creating a margin environment that is genuinely exceptional by historical standards.
What Operational Leverage Actually Means for Gold Miners
The concept of operational leverage in mining is frequently referenced but rarely explained with precision. Here is how it works in practice:
- When a gold miner has a largely fixed cost structure, every dollar increase in the gold price above AISC flows almost entirely to the bottom line
- A miner producing at $1,400/oz AISC with gold at $2,000/oz generates $600/oz in margin. At $2,800/oz gold, that margin nearly triples to $1,400/oz, on the same asset, with no additional capital
- This exponential margin expansion is what operational leverage means, and it is not yet fully reflected in mining equity valuations
- Private market operators who own producing mines have been quietly accumulating substantial cash flows in this environment, often indifferent to public market sentiment because the underlying economics are self-evident
| Metric | 2024 Baseline | 2026 Outlook |
|---|---|---|
| Structural Demand Driver | Central banks + geopolitical risk | Sustained + growing ETF inflows |
| AISC Margin Pressure | Moderate | Manageable, costs rising slower than prices |
| Operational Leverage Priced In? | Partially | Not fully reflected in equities |
| Cycle Risk Horizon | Medium-term | 5 to 10 year constructive base case |
The disconnect between private market valuations and public equity pricing is one of the most interesting inefficiencies in the current gold mining landscape. Operators who understand their own economics are not troubled by market scepticism. They are simply collecting cash flows.
Silver Mining Outlook: The Most Undervalued Segment of the Precious Metals Complex
Understanding Silver's Structural Position as a Byproduct Metal
One characteristic of silver that is frequently misunderstood by non-specialist investors is its predominant status as a byproduct metal. The majority of global silver supply comes not from dedicated silver mines, but as a secondary output from lead and zinc operations. This has a critical implication: when silver prices rise, primary lead and zinc producers do not dramatically ramp up silver output in response.
The supply response is structurally muted, which means price signals do not trigger the same correction mechanisms seen in other commodities. Silver supply deficits, combined with accelerating industrial demand from photovoltaic solar panels, consumer electronics, and EV components, create a structural consumption floor that is growing, not shrinking.
Why Silver Equities May Be Relatively Underpriced Right Now
BlackRock has noted that silver's recent rally reflects converging industrial and investor demand, while simultaneously flagging that the metal's elevated volatility makes stock selection more critical than in the gold space. That caution is warranted, but it also explains the mispricing opportunity.
Market scepticism about whether silver can sustain prices above $50 per ounce is actively suppressing silver equity valuations. Many investors are unwilling to price in a scenario they consider speculative, even when the supply and demand fundamentals appear to support it. This creates a gap between intrinsic value and market price that patient, analytically rigorous investors can exploit.
Silver vs. Gold Mining: Key Structural Differences
- Silver is predominantly a byproduct of lead and zinc operations, meaning pure-play supply response to price signals is limited
- Industrial consumption from solar, EV, and electronics sectors adds a structural demand floor that copper and gold do not share in the same way
- Investor sentiment toward sustained high silver prices remains cautious, creating potential mispricing relative to fundamentals
- Silver equities have historically delivered their strongest relative outperformance against gold equities in the late stages of precious metals bull markets
- Projects that contain both gold and silver within a single deposit offer a particularly interesting combination of monetary and industrial demand exposure
Copper Mining Outlook: Tightest Supply Pipeline, Highest Macro Sensitivity
The Structural Supply Crisis in Detail
Copper's supply-side challenges are multi-dimensional. New mine development is severely underfunded relative to projected demand. Concentrate availability is tight, with smelter processing margins compressed to the point where some facilities have reduced throughput. Mine disruption risk, particularly across Latin America and parts of Africa, remains elevated and structurally difficult to price.
The copper supply crunch is further compounded by demand driven by the global energy transition, which is accelerating on a multi-decade trajectory. J.P. Morgan has flagged that macro demand deterioration, particularly driven by industrial slowdown in key consuming economies, is the most credible short-term risk that could override what is otherwise a structurally bullish supply picture.
| Supply Constraint Factor | Current Status | Timeline to Resolution |
|---|---|---|
| New mine development | Severely underfunded | 8 to 10 years minimum |
| Concentrate availability | Tight, smelter margins compressed | 2 to 4 years |
| Mine disruption risk | Elevated across Latin America and Africa | Ongoing |
| Demand growth from energy transition | Accelerating | Structural multi-decade driver |
Why Copper Is the Most Macro-Sensitive Metal in This Framework
Unlike gold, which can maintain price support even during economic downturns due to its monetary role, and unlike silver, which benefits from both industrial and investor demand, copper's price is almost entirely dependent on industrial activity. This makes it the most cyclically sensitive of the three metals and the one that requires the clearest macro conviction before committing capital at scale.
Onshoring and critical minerals policy frameworks across the US, Europe, and allied nations are reshaping copper demand projections, with domestic manufacturing capacity expansion requiring significant copper intensity. However, these policy dynamics should be understood as broad structural tailwinds, not as project-specific commitments.
Comparative Investment Framework: Gold vs. Silver vs. Copper Miners
| Category | Gold Miners | Silver Miners | Copper Miners |
|---|---|---|---|
| Structural Setup | Best in class currently | Undervalued, higher risk | Cyclical, supply structurally bullish |
| Primary Demand Driver | Central banks, geopolitical hedging | Industrial consumption + investor demand | Energy transition, global industry |
| Price Volatility | Lower | Higher | Highest, most macro-sensitive |
| Margin Outlook 2026 | Strong | Constructive | Tight but improving |
| Operational Leverage | High, not fully priced | Very high, underappreciated | Moderate |
| Cycle Sensitivity | Low to moderate | Moderate | High |
Projects that contain two or three of these metals within a single deposit deserve particular analytical attention. Combined exposure to gold and copper, or gold, silver, and copper within one asset, provides a natural hedge across different demand cycles while capturing multiple structural tailwinds simultaneously. According to Baker Steel's multi-year upcycle analysis, miners across these three metals may be at the beginning of a prolonged period of outperformance relative to broader equities.
The next major ASX story will hit our subscribers first
Risk Management: The Five Threats Most Likely to End the Current Cycle
Risk One: Pipeline Supply Finally Reaching the Market
The most credible long-term risk to the structural price thesis is the eventual arrival of new supply committed during this cycle. Given the 8 to 10 year development timeline, this risk is not imminent, but it is real. Completing definitive feasibility studies on advanced projects is therefore a critical monitoring point for assessing when pipeline supply might begin to influence prices.
Risk Two: Energy Cost Exposure and the Hedging Window
Diesel cost management is perhaps the most instructive risk management lesson from the current cycle. There was a period, roughly 8 to 9 months prior to energy cost escalation, when silver prices relative to diesel prices created a structurally clear case for forward hedging diesel exposure. Mining operators who locked in three-year diesel prices during that window protected their margins through the subsequent energy cost surge.
Those who did not hedge missed what was, in retrospect, an analytically obvious risk management window. Metal prices rising sharply enough to offset unhedged energy costs may have cushioned the blow, but the failure to act was nonetheless a missed opportunity in disciplined cost management.
Key hedging considerations for mining operators:
- Diesel exposure is the most structurally manageable input cost and the most frequently mismanaged
- Labour cost inflation is considerably harder to hedge and represents the trickier long-term margin protection challenge
- Holding gold or highly liquid yielding instruments in corporate treasury can partially offset real inflation in operating costs over time
- The metal-to-diesel price ratio is a critical monitoring metric that signals when the next hedging window is opening
Mining companies that hold gold in their treasury rather than cash are effectively hedging their own cost structure against real inflation. This approach aligns corporate balance sheet management with the very thesis that supports their primary revenue stream.
Risks Three Through Five: Labour, Geopolitics, and Macro Demand
Labour cost inflation represents the most structurally difficult margin challenge because conventional hedging instruments are largely inapplicable. Geopolitical disruption and resource nationalisation, while real risks in certain jurisdictions, are assessed as lower probability across much of Latin America in the current environment. Macro demand deterioration, particularly for copper, remains the most credible short-cycle risk.
Jurisdiction Risk: Latin America's Structural Improvement
How the Risk Landscape Has Shifted Over the Past Three to Five Years
Jurisdiction risk assessment is not static. Regions that were effectively uninvestable a decade ago have undergone meaningful political and regulatory transformations. Bolivia is a notable example, where the political environment has shifted materially toward openness to foreign investment, reducing nationalisation risk from what was previously assessed in the high single digits to a low single-digit probability.
| Country or Region | Historical Risk Level | Current Risk Assessment | Key Shift Driver |
|---|---|---|---|
| Bolivia | High single digits | Low single digits | Political environment opened to foreign investment |
| Mexico | Moderate | Elevated, monitoring required | Policy uncertainty persists |
| Broader Latin America | High | Improving significantly | US geopolitical influence, onshoring incentives |
| Panama post-First Quantum | Cautionary benchmark | Highly unlikely to be repeated | Regulatory overreach, US attention unlikely to tolerate repeat |
The First Quantum Panama situation serves as an important case study. The political and diplomatic consequences of that nationalisation have made similar actions across Latin America significantly less likely, particularly in countries where US political influence is active. Governments on the left of the political spectrum in the region appear acutely aware that mine nationalisation at scale would invite direct US diplomatic and economic attention.
Latin America also remains one of the most underexplored regions globally in terms of mineral discovery potential. The combination of improving jurisdiction risk, underexplored geology, and growing strategic recognition of domestic resource development represents a multi-year structural opportunity that institutional markets have not yet fully priced. As noted in S&P Global's mine cost outlook, inflation and new supply dynamics are increasingly reshaping where capital flows within the global mining landscape.
What Investors Should Monitor Through 2026 and Beyond
Cycle monitoring checklist for gold, silver, and copper mining:
- New project approvals and construction commencement rates across all three metals
- Concentrate pipeline data for copper, a leading indicator of future supply dynamics
- Central bank gold purchasing trends, the primary structural demand anchor for gold prices
- Silver industrial demand growth from solar, EV, and electronics sectors
- Energy cost trajectories relative to metal price ratios, the key indicator for hedging window timing
- Jurisdiction risk developments in Latin America, Africa, and Southeast Asia
- Labour cost inflation trends relative to AISC margins across producing operations
Frequently Asked Questions: Gold, Silver, and Copper Mining Outlook
Is silver mining more undervalued than gold mining right now?
Based on current market sentiment, silver equities appear to carry more mispricing potential than gold miners, largely because widespread scepticism about sustained silver prices above $50 per ounce is actively suppressing valuations. However, the higher volatility and byproduct economics of silver make stock selection considerably more demanding.
What is the biggest risk to the copper mining outlook in 2026?
Macro demand deterioration, particularly in industrial economies, is the most credible short-term risk. Copper's price is almost entirely dependent on industrial activity, making it far more sensitive to economic slowdown than gold or silver.
How long does it take to bring a new gold, silver, or copper mine into production?
Across all three metals, the timeline from greenfield discovery to commercial production is consistently 8 to 10 years, accounting for exploration, feasibility studies, permitting, and construction. This timeline is the structural foundation of the long-cycle price thesis.
Should mining companies hold gold in their treasury instead of cash?
Holding gold or a combination of gold and highly liquid yielding instruments in corporate treasury aligns balance sheet management with the company's own operating thesis and provides a partial hedge against real inflation in operating costs, particularly labour.
Which mining jurisdictions offer the best combination of resource potential and political stability?
Latin America, and specifically the broader South American region, has seen the most significant improvement in jurisdiction risk over the past three to five years. Bolivia, Argentina, and parts of Peru and Chile offer resource potential that was previously discounted due to political risk assessments that are now materially more favourable.
What does operational leverage mean in the context of gold mining?
Operational leverage refers to the disproportionate margin expansion that occurs when metal prices rise faster than fixed production costs. A mine operating at a fixed AISC sees nearly all incremental gold price gains flow directly to profit, meaning small percentage increases in the gold price translate into large percentage increases in earnings.
Key Takeaways: Synthesising the Gold, Silver, and Copper Mining Outlook
The structural case for a prolonged period of elevated resource prices rests on three interconnected realities: supply pipelines that cannot be accelerated beyond geological and logistical constraints, improving but still underappreciated jurisdiction conditions in key mining regions, and metal prices that have outpaced cost inflation to generate margin environments that are genuinely exceptional.
Gold miners offer the most operationally leveraged exposure with the lowest volatility profile. Silver miners carry higher risk but potentially greater mispricing, particularly for investors willing to accept that silver prices above $50 per ounce may prove more durable than consensus currently assumes. Copper miners provide the most direct exposure to the energy transition but require the clearest macro conviction given their cyclical sensitivity.
The gold, silver, and copper mining outlook over the coming decade is fundamentally underpinned by structural supply constraints that no amount of short-term capital deployment can overcome. Consequently, the investors and operators best positioned are those who combine disciplined cost management, rigorous jurisdiction assessment, and patient capital allocation to capture the full potential of this cycle.
The primary challenge for mining operators and investors in this environment is not identifying upside. The upside is structurally supported and reasonably visible. The real challenge is protecting margins aggressively enough, through disciplined hedging, treasury management, and cost monitoring, to fully capture the opportunity that this cycle is presenting.
Disclaimer: This article is intended for informational and educational purposes only. It does not constitute financial advice, investment recommendations, or an offer to buy or sell any securities. All forward-looking statements, projections, and price forecasts referenced herein involve inherent uncertainty and should not be relied upon as predictions of future performance. Readers should conduct their own due diligence and consult a licensed financial adviser before making any investment decisions.
Want to Know Which ASX Mining Discoveries Could Benefit From These Structural Tailwinds?
Discovery Alert's proprietary Discovery IQ model scans ASX announcements in real time, instantly identifying significant mineral discoveries across gold, silver, copper, and 30+ other commodities — turning complex geological data into clear, actionable investment insights. Explore historic discoveries and the substantial returns they have generated, then begin your 14-day free trial at Discovery Alert to position yourself ahead of the broader market.