
July 27, 2026
The Two Forces That Actually Drive Gold and Silver Prices
Precious metals markets are frequently misunderstood by retail participants who focus on headline narratives rather than the mechanical forces that dictate price direction. At the core of gold and silver valuation lies a deceptively simple relationship: real interest rates and the shape of the yield curve. Understanding the gold and silver correction and June outlook requires grasping how these two variables move in concert. When they work in gold's favour, the metal tends to trend higher in a sustained, impulsive manner.
The 10-year/2-year Treasury yield spread is arguably the most important macro indicator for precious metals investors to monitor. When this spread widens, meaning longer-term yields are rising faster than shorter-term yields, the curve steepens and conditions historically become structurally supportive for gold. The inverse relationship is equally reliable: a flattening or inverted curve suppresses gold's upward momentum by signalling that monetary conditions remain tight.
Furthermore, understanding this dynamic helps frame why gold and silver entered a significant correction phase and, more importantly, why the conditions that would reignite a sustained move higher are well-defined rather than speculative. The two-year yield dynamics in the current macro environment add further complexity to this picture.
How Real Interest Rates and the Yield Curve Work Together
Gold does not pay a yield, which means its opportunity cost relative to interest-bearing assets is directly tied to the level of real interest rates. When real rates turn negative or fall sharply, the case for holding gold improves dramatically because the cost of owning a non-yielding asset diminishes in relative terms.
The yield curve steepening can produce this effect through two distinct pathways, and both ultimately point to the same outcome for precious metals:
- Organic steepening: Long-term yields continue rising while short-term yields plateau or decline, widening the spread naturally as the market prices in longer-term growth or inflation expectations.
- Fed-driven steepening: The Federal Reserve initiates rate cuts, causing the 2-year yield to fall sharply and disproportionately relative to the 10-year, compressing the short end of the curve.
The challenge heading into June 2025 has been that both short- and long-term yields have been rising simultaneously, keeping the curve relatively flat and removing the tailwind that gold needs for impulsive upside moves. The key threshold to watch is whether this dynamic shifts, either through a stabilisation of short-term yields or an eventual policy pivot from the Fed. The relationship between gold and bonds across economic cycles illustrates precisely why this matters.
| Macro Trigger | Yield Curve Impact | Expected Gold Response |
|---|---|---|
| Fed rate cuts initiated | 2-year yield drops sharply | Strongly bullish |
| Long-end rises, short-end stalls | Curve steepens organically | Moderately bullish |
| Both yields rising simultaneously | Curve remains flat or inverted | Neutral to bearish near-term |
| Real rates turn decisively negative | Purchasing power erosion accelerates | Strongly bullish |
When big ASX news breaks, our subscribers know first
Is the Gold and Silver Correction Over? Understanding Price Versus Time
One of the most important conceptual distinctions in technical analysis is the difference between a price correction and a time correction. Most investors focus exclusively on how far a market has fallen, but the duration of a correction matters just as much for determining when the next sustained advance can begin.
A correction has two distinct dimensions: the price decline itself, and the period required for the market to build a stable base. Even after price lows are firmly established, sideways consolidation can persist for weeks or months before a new directional leg begins.
The evidence emerging from technical analysis suggests that gold and silver are approaching the latter stages of their intermediate-term correction. Key observations supporting this view include:
- Gold tested its 200-day moving average and produced a technically significant bullish reversal pattern, specifically a bullish hammer candlestick, characterised by a long lower wick and a close near the session high. This candle formation is widely recognised as a reversal signal when it appears at potential price lows.
- The correction from the intraday peak to the intraday low reached approximately 27% at its deepest point, with a slightly less severe drawdown of around 21–22% at the more recent stabilisation low. These are substantial resets by historical standards, comparable in magnitude to prior significant corrections following major gold breakouts.
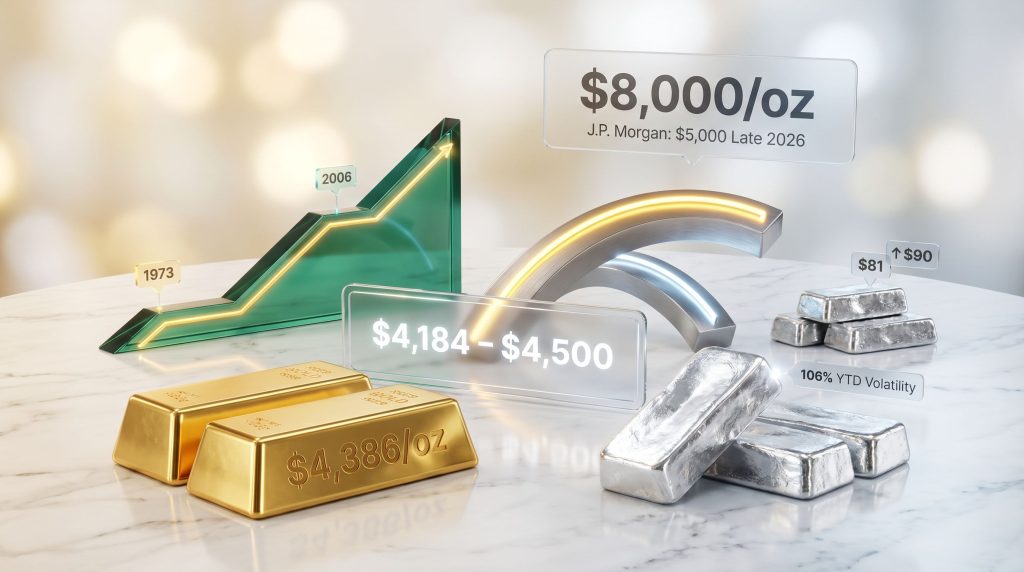
- Key technical support levels to monitor sit in the $4,184 to $4,423 range, with near-term price forecasts around $4,386 per ounce for June 2026. Expert analysts reviewing the gold price forecast for 2025 have noted this support zone as critical to watch.
What Would Confirm the Correction Has Definitively Ended?
Rather than a single signal, confirmation typically involves a convergence of several indicators:
- A sustained hold above key moving averages without retesting the correction lows.
- A reversal in ETF fund flows from persistent outflows toward meaningful inflows.
- The yield curve beginning to steepen as described above.
- Silver breaking above near-term resistance at the $81 level, which would open a path toward approximately $90, representing a potential 20% move from current levels.
How the Current Correction Compares to Historical Post-Breakout Pullbacks
Gold has experienced three major structural breakouts in modern market history. Each was followed by a significant first correction before the metal resumed its primary trend. Understanding where the current correction sits within this historical context provides a powerful framework for assessing both timing and depth.
The two most relevant historical analogues are the 1973 post-Bretton Woods breakout correction and the 2006 post-breakout correction during the pre-GFC commodity supercycle. Both of these corrections bottomed at levels that, when mapped to today's price scale, are remarkably consistent with current support zones.
Following the 1973 gold breakout, the first significant post-breakout correction found its floor at a level equivalent to approximately $3,950 on today's scale. The 2006 correction, occurring in a structurally similar context, found support at roughly $4,250 on the same adjusted scale. Both levels sit within or just below the current key support zone.
The Long-Term Analog Model: Constructing the $8,000 Case
One of the more technically rigorous approaches to projecting gold's longer-term trajectory involves blending historical breakout trajectories into a composite analog model. The current framework uses a combination of the 1972 breakout trajectory (weighted at 75%) and the 2005 breakout trajectory (weighted at 25%), with a calibration lag of 6 to 12 months applied to align the model's starting point with the February 2024 breakout origin.
| Analog Component | Weight Applied | Reference Period |
|---|---|---|
| 1972 breakout trajectory | 75% | Post-Bretton Woods gold liberalisation |
| 2005 breakout trajectory | 25% | Pre-GFC commodity supercycle |
| Lag adjustment applied | 6 to 12 months | Calibrated to February 2024 breakout origin |
The fit between the composite model and gold's actual price trajectory through to the present has been notably close. If the current breakout continues to track the historical composite, the model suggests gold could reach $8,000 per ounce within a two to three year horizon from the breakout origin. This is not a forecast but a scenario projection derived from pattern-matching against the most analogous historical episodes.
It is important to note that J.P. Morgan has independently published a price target of $5,000 per ounce for gold by late 2026, providing institutional validation of a broader structural bull thesis, even if more conservative in its near-term scope. According to CBS News gold price experts, institutional consensus around gold's trajectory is gaining momentum heading into mid-2026.
Disclaimer: Price targets and analog projections are inherently speculative and should not be interpreted as investment advice. Actual outcomes depend on macroeconomic variables that cannot be predicted with certainty.
Silver's Correction Profile: Leverage, Volatility, and the Gold-Silver Ratio
Silver consistently behaves as a leveraged expression of gold's directional trend. In bull phases, it tends to outperform gold significantly. In corrections, it often falls harder and faster. This amplified sensitivity makes silver both more rewarding at the right entry point and more punishing for investors who mistime their positioning.
A particularly useful tool for understanding silver's correction dynamics is the gold-silver ratio, which measures how many ounces of silver are required to purchase one ounce of gold. When this ratio rises, gold is outperforming silver. When it falls, silver is outperforming. A thorough gold-silver ratio analysis reveals how this metric has historically guided medium-term entry decisions.
Historically, sharp spikes in the gold-silver ratio following silver blowoff tops have marked the beginning, not the end, of silver's medium-term recovery cycle. The ratio tends to peak quickly after the initial correction and then reverses decisively in silver's favour as the recovery phase takes hold.
Silver's Historical Correction Parallels
Examining the correction patterns from 2004 to 2006 and from 2011 reveals a consistent structural template:
- Both prior episodes featured rapid silver outperformance culminating in a blowoff top, followed by a sharp correction and a temporary phase of gold dominance.
- In both cases, the gold-silver ratio peaked quickly after the initial correction impulse and then declined as silver resumed its leadership role.
- The current configuration, with silver having experienced an accelerated blowoff move followed by a sharp correction and a period of stabilisation, shares structural similarities with both of these prior sequences.
Two distinct institutional perspectives on silver's near-term outlook reflect the genuine complexity of its position. BlackRock's analysis of gold and silver volatility highlights that silver's year-to-date volatility surged 106%, reflecting its more fragile liquidity profile relative to gold and the risks that come with a thinner market. Sprott, by contrast, has pointed to structural supply deficits and renewed institutional interest as factors providing medium-term price support despite near-term turbulence.
Both views are relevant and not necessarily contradictory: elevated volatility is a near-term reality, while structural supply and demand dynamics provide the longer-term floor.
Key Silver Technical Levels Heading Into June
- Silver's 200-day moving average is positioned near the $66 level on the applicable scale, while spot prices remain materially above it, suggesting the primary trend is still intact.
- A potential test of the 200-day moving average, while not guaranteed, could represent the final corrective reset before a more sustained upside move.
- Near-term resistance is concentrated around the $81 level. A confirmed breakout above this threshold would potentially open a path toward $90, a move of approximately 20% from the current range.
What ETF Fund Flows Are Revealing About Precious Metal Sentiment
Fund flow data provides one of the most reliable contrarian sentiment signals available to precious metals investors. The principle is straightforward: when large volumes of capital have already exited a market through ETF redemptions, the pool of remaining motivated sellers shrinks considerably, reducing downside pressure and setting the conditions for a sentiment reversal.
Significant outflows from gold ETFs over a rolling three-month period have historically coincided with market bottoms rather than the beginning of sustained downtrends. Heavy selling that has already been absorbed removes the primary source of ongoing price pressure.
Current three-month fund flow data from GLD, the largest gold ETF, shows substantial net outflows. Rather than interpreting this as a bearish signal, experienced technical analysts recognise it as evidence that the most motivated sellers have already acted — a historically constructive setup for the next directional move.
| Sentiment Indicator | Current Reading | Historical Interpretation |
|---|---|---|
| 3-month GLD fund flows | Significant net outflows | Contrarian bullish, selling largely exhausted |
| Gold in real terms | Recently oversold | Bullish reversal conditions forming |
| Bullish hammer candle formation | Present on recent daily chart | Technical reversal signal at potential lows |
| Capital rotation from equities | Early signs emerging | Suggests money moving back toward hard assets |
What Gold Miner ETF Allocation Data Reveals About Crash Risk
A frequently raised concern among more bearish market observers is the possibility of a severe, structural collapse in mining equities similar to the 70% drawdowns seen at prior secular peaks. However, the allocation data does not support this scenario.
*Gold miner ETF assets as a proportion of total ETF assets currently sit at approximately 0.35%, well below levels recorded at the 2011 secular peak, the 2016 recovery, and the post-COVID surge in mining equity interest. This allocation profile is inconsistent with the conditions that have historically preceded major sector collapses.*
Fund flow patterns across GDX, GDXJ, SIL, and SILJ during the correction period have been characterised by near-continuous outflows, with only isolated single-week periods of meaningful inflows recorded for both gold and silver miner ETFs. This sustained outflow pattern is consistent with a healthy sector reset rather than a structural breakdown, and it mirrors the setup that preceded prior recoveries.
Mining Equities: Sentiment Reset or Structural Breakdown?
Mining equities, particularly junior miners, have already corrected 30 to 35% from recent highs. For investors who misread the current environment as the beginning of a multi-year bear market, this correction looks alarming. For those who understand the sector's historical reset dynamics, it represents a selective buying opportunity.
Junior mining companies offering 3x to 5x upside potential at current metals prices, without requiring gold at $9,000 or silver at $200, provide asymmetric return profiles with built-in downside protection if metals prices consolidate.
The investment framework that emerges from this analysis centres on identifying quality at a discount rather than speculative leverage to extreme scenarios. The key criteria that separate quality junior mining opportunities from pure speculation include:
- Project quality: A defined, credible resource base with a realistic pathway to production or significant resource expansion.
- Growth optionality: Producers with demonstrated expansion capacity, and developers with near-term catalysts that can drive re-rating.
- Margin of safety: Upside scenarios modelled at current or modestly higher metals prices, not at extreme bull case assumptions.
- Leverage amplification: If silver reaches the $100 to $150 range and gold reaches $6,000 to $7,000, the upside on quality juniors that already offer 3x to 4x returns at current prices compounds dramatically into potential 5x to 7x outcomes.
GDXJ Technical Setup Heading Into June
For the junior miner ETF GDXJ, the near-term technical picture suggests a modest rally followed by further consolidation before the next sustained directional move:
- Near-term resistance sits in the $127 to $130 range.
- Breadth indicators suggest watching for a potential decline toward the 30 to 20% threshold, which has historically signalled corrective lows in intermediate-term pullbacks.
- The base case expectation is a rally toward resistance, followed by sideways consolidation as the broader precious metals complex builds its base ahead of the next impulsive leg higher.
The next major ASX story will hit our subscribers first
Scenario Modelling: Three Paths for Gold and Silver Through June and Q3 2025
With the technical and fundamental picture assembled, the range of plausible near-term outcomes can be mapped across three distinct scenarios. Each rests on identifiable macro triggers and has materially different implications for positioning.
| Scenario | Probability Assessment | Key Trigger | Gold Target | Silver Target |
|---|---|---|---|---|
| Base Case: Consolidation then Recovery | Highest | Yield curve stabilises, ETF outflows reverse | $4,386 to $4,500 range | Test of $81 resistance |
| Bull Case: Early Breakout | Moderate | Fed signals rate cuts, real rates turn sharply negative | Toward $5,000 | Break above $81 toward $90 |
| Bear Case: Extended Correction | Lower | Both yields continue rising, dollar strengthens | Test $4,184 support | Potential test of 200-day MA near $66 scale |
The timing evidence from historical analog comparisons points toward late June as a potential inflection zone for both gold and silver. This does not guarantee an immediate explosive move, but the convergence of multiple historical correction templates around this timeframe is noteworthy. In prior analogous corrections, the transition from the corrective phase to a stronger recovery typically occurred within a comparable window.
Frequently Asked Questions: Gold and Silver Correction and June Outlook
Is the Gold Price Correction in 2025 a Buying Opportunity or a Warning Sign?
Based on the weight of technical and sentiment evidence, the current gold and silver correction appears to be in its late-stage resolution phase. A correction of 21 to 27% from peak to trough, combined with oversold real-terms readings, a bullish reversal candle, and exhausted ETF outflows, is more consistent with a buying opportunity than a warning of further structural deterioration. However, investors should be prepared for continued time-based consolidation even if the price lows are already established.
What Level Does Gold Need to Hold to Avoid a More Serious Decline?
The key support zone sits between $4,184 and $4,250. A sustained break below this range, particularly if accompanied by a reversal in ETF flow patterns and deteriorating yield curve dynamics, would signal that the correction has more work to do. Above this zone, the balance of evidence favours stabilisation and eventual recovery.
Why Is Silver More Volatile Than Gold During Corrections?
Silver's higher volatility during corrections reflects its dual nature as both a monetary and an industrial metal. Its market is significantly smaller and less liquid than gold's, which means that sentiment shifts produce proportionally larger price moves. BlackRock's observation of a 106% year-to-date volatility surge in silver illustrates this dynamic clearly. The same characteristic that makes silver more volatile in corrections also makes it a more powerful performer when sentiment turns positive.
How Do Central Bank Purchases Affect the Gold Price Outlook?
Central bank demand has provided a persistent structural bid beneath the gold market that did not exist in prior cycles to the same degree. This structural buyer base reduces the severity of corrections by absorbing selling pressure that would otherwise push prices lower, consequently supporting broader recovery timelines.
What Is the Gold-Silver Ratio Telling Investors Right Now?
The current elevated gold-silver ratio, reflecting gold's recent outperformance during the correction, is structurally consistent with prior correction phases that ultimately resolved in silver's favour. Historically, the ratio peaks quickly after the initial correction impulse and then reverses as silver reasserts its leadership role in precious metals bull markets.
When Could Gold and Silver Begin Their Next Major Upside Move?
The convergence of historical analog timing and current technical conditions points toward late June to early July as a potential zone where the transition from correction to recovery could accelerate. This aligns with the time-based component of the correction analysis, though investors should note that markets rarely move precisely on schedule.
Key Takeaways for the Gold and Silver Correction and June Outlook
Navigating the gold and silver correction and June outlook requires holding both the near-term technical picture and the longer-term structural narrative simultaneously. The evidence across multiple analytical dimensions converges on a broadly constructive conclusion, tempered by the recognition that time-based consolidation may persist even as price lows are likely already in place.
The most important summary points are:
- The gold and silver correction is most likely in its late-stage price resolution phase, with the 200-day moving average test in gold producing a technically significant bullish reversal signal.
- A peak-to-trough correction of 21 to 27% places the current drawdown firmly in the range of prior major post-breakout corrections from 1973 and 2006, both of which resolved within a comparable timeframe before the next impulsive advance.
- Silver's 106% year-to-date volatility increase (per BlackRock) is a near-term reality, but structural supply deficits (per Sprott) provide the medium-term foundation for a meaningful recovery once the correction fully resolves.
- Three-month GLD fund flow data showing significant net outflows is a historically contrarian bullish signal, indicating that the dominant sellers have already acted and reducing the likelihood of a sharp further decline.
- The long-term analog model, combining the 1972 and 2005 breakout trajectories with appropriate lag adjustments, presents a scenario where gold reaches $8,000 per ounce within a two to three year horizon if the current breakout follows historical precedent.
- J.P. Morgan's independent forecast targets $5,000 per ounce by late 2026, offering institutional corroboration of the broader structural bull thesis.
- Junior mining equities offering 3x to 5x upside at current metals prices, without relying on extreme scenario valuations, represent the most asymmetric opportunity within the sector for investors with appropriate risk tolerance and time horizons.
This article is intended for informational and educational purposes only and does not constitute financial or investment advice. Precious metals markets involve significant risk, and past performance of historical analogs does not guarantee future results. Always conduct independent due diligence before making any investment decision.
Want to Catch the Next Major Mineral Discovery Before the Broader Market Does?
Discovery Alert's proprietary Discovery IQ model delivers real-time ASX alerts the moment significant mineral discoveries are announced, translating complex data across more than 30 commodities into clear, actionable insights for both traders and long-term investors — explore the historic returns major discoveries have generated and begin your 14-day free trial today to position yourself ahead of the market.