
June 20, 2026
Why the Next Move in Gold and Silver Will Catch Most Investors Off Guard
There is a well-documented pattern in secular bull markets that repeats with uncomfortable regularity: the most explosive recoveries arrive disguised as breakdowns. Before a major upward reversal, prices frequently do something that appears catastrophic on the surface, undercutting prior lows, triggering stop-losses, and attracting a surge of short-sellers who believe they have finally identified the beginning of a prolonged bear phase. What follows is not continued weakness but a sharp, often violent reversal that leaves the majority of participants on the wrong side of the trade.
This is the central thesis now forming across the gold and silver markets. The gold and silver false new low before summer rebound narrative is not speculative fiction. It is a pattern with deep roots in technical history, and the current configuration of sentiment, positioning, and price structure suggests the conditions may be aligning once again.
When big ASX news breaks, our subscribers know first
The Bear Trap Mechanism: How False Lows Are Engineered by Market Structure
Defining the False New Low in Precious Metals
A false new low, sometimes called a bear trap, occurs when price action briefly penetrates a well-established support level before reversing sharply in the opposite direction. The penetration is not random. It systematically triggers the stop-loss orders of existing long holders while simultaneously attracting fresh short positions from traders who interpret the break as confirmation of a new downtrend.
The result is a temporary but dramatic increase in bearish positioning, precisely at the moment when the market is running out of sellers. When buying pressure finally reasserts itself, the forced unwinding of those newly established short positions adds fuel to the recovery, creating moves that are often disproportionately large relative to the preceding correction.
The Psychology Behind Capitulation
Extended corrections do predictable things to investor psychology. Recency bias causes participants to extrapolate recent weakness indefinitely into the future. Loss aversion intensifies as drawdowns deepen, pushing marginal holders toward selling at exactly the wrong moment. The result is a self-reinforcing momentum of pessimism that accelerates as prices approach key support zones, making a genuine breakdown and a false breakdown nearly indistinguishable in real time.
Historical evidence from multiple commodity and equity cycles consistently demonstrates that the most convincing-looking breakdowns in secular bull markets tend to mark sentiment extremes rather than genuine trend reversals. The majority of participants are positioned for continued weakness at precisely the moment the market inflects upward.
This is not an abstract observation. It defines the probable setup currently developing across gold, silver, and the junior mining complex. Furthermore, understanding why the gold-silver ratio matters in this context adds an important dimension to interpreting these signals accurately.
What the Fundamentals Are Actually Communicating Right Now
Real Rates, Yield Curve Dynamics, and the Case for Patience
The fundamental backdrop for gold is not yet constructive, and acknowledging that honestly is essential to understanding the full picture. Real interest rates remain elevated, increasing the opportunity cost of holding non-yielding assets like gold and silver. The yield curve is flattening, a configuration where shorter-duration yields outpace longer-duration yields, a condition historically associated with underperformance in precious metals.
For the fundamental picture to shift bullishly, one of two things needs to happen:
- The 2-year Treasury yield peaks and begins rolling lower, reducing the Fed's implied policy pressure on gold
- The 10-year Treasury yield accelerates upward faster than the 2-year, steepening the curve and reflecting rising inflation expectations that favour hard assets
Until one of those dynamics materialises, fundamentals remain a headwind. However, this does not mean price cannot bottom and begin recovering before the macro narrative catches up.
Historical Rate Cycles and Gold's Counterintuitive Response
One of the most misunderstood dynamics in precious metals investing is the relationship between Federal Reserve rate hike cycles and gold prices. The conventional assumption is that rate hikes are uniformly bearish for gold. The historical record, however, tells a more nuanced story.
| Rate Hiking Cycle Commencement | Gold's Reaction |
|---|---|
| 1999 | Marked a significant price bottom |
| 2004 | Coincided with a multi-year low before a major bull run |
| Late 2015 / Early 2016 | One hike followed by a pause; gold bottomed and recovered |
| 2022 | Gold peaked near cycle start, then declined approximately 20% |
The critical variable is not whether the Fed hikes, but where gold is positioned relative to its recent highs when the hike occurs. In 1999, 2004, and 2015, gold was already significantly depressed when hiking commenced, and those moments marked durable bottoms. In 2022, gold was near highs when the cycle began, which is precisely why it subsequently declined.
Fundamentals Define the Ceiling; Technicals and Sentiment Define the Floor
A critical analytical principle applies here: fundamentals determine how far a recovery can ultimately travel, while technical structure and sentiment extremes determine when the initial floor forms. The initial bounce phase can, and historically does, precede the fundamental turn. The gold market outlook reinforces this view, with thematic drivers remaining broadly intact even through periods of sharp correction.
Technical Architecture: Reading the Correction Against Historical Analogs
Three Major Corrections, One Structural Pattern
Technical analog analysis involves overlaying multiple historical corrections on the same price and time scale to identify structural similarities. The current gold correction has been compared against the 1973 and 2006 corrections, both of which represented the first major pullback following a significant structural breakout in the gold price.
What the comparison reveals is a remarkably consistent depth and duration profile across all three corrections. The 1973 correction found its bottom near what would equate to approximately $3,950 on today's scale. The 2006 correction bottomed near the equivalent of approximately $4,150. The current correction is tracking these historical precedents with notable fidelity, suggesting the market may be approaching a final-leg low formation over the coming weeks.
Analog analysis does not guarantee outcomes. When multiple structurally independent corrections share similar characteristics, however, it establishes a probabilistic framework for identifying where reversal zones are most likely to concentrate.
Two Probable Bottom Formations
Given current conditions, two distinct technical scenarios are most plausible for how the bottom forms:
Scenario A: Classic Double Bottom
- Price declines to recent support levels and temporarily stabilises
- A secondary test of the low follows, accompanied by diminishing selling volume
- Confirmation requires a sustained close above the resistance midpoint between the two lows
- This pattern tends to produce a measured, orderly recovery
Scenario B: False New Low (Bear Trap Reversal)
- Price briefly undercuts the prior significant low, triggering stop-losses and drawing in fresh short positions
- A rapid, decisive reversal follows as the bear trap closes
- The recovery phase is typically more explosive than a double bottom due to the additional fuel provided by forced short covering
- This pattern is considered the more dangerous of the two for participants positioned short into the low
Key Support Levels Across Gold and Silver
| Metal | Primary Support Zone | Secondary / Extended Support |
|---|---|---|
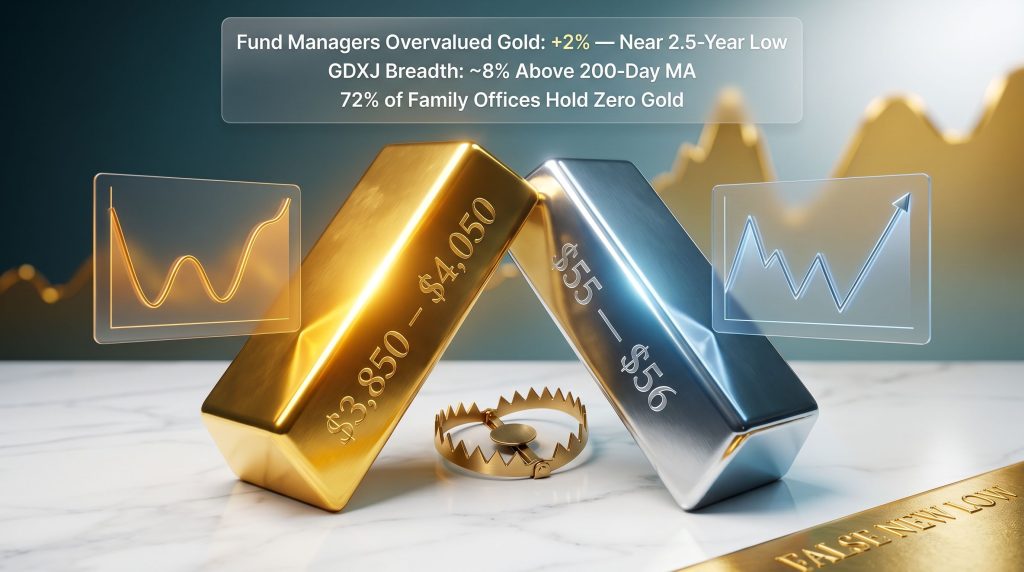
| Gold | ~$4,050 (recent swing low / 38.2% Fibonacci retracement) | $3,850 to $3,900 |
| Silver | ~$55 to $56 (derived from ratio analysis) | Subject to gold's path |
The $4,050 level in gold carries technical significance on multiple dimensions: it represents both the recent swing low and aligns closely with the 38.2% Fibonacci retracement of the rally from the 2022 and 2023 lows. A sustained breach of that level without immediate recovery would shift attention toward the $3,850 to $3,900 zone as the next meaningful support cluster.
Gold-Silver Ratio as a Tactical Signal
The gold-silver ratio measures how many ounces of silver are required to purchase one ounce of gold. When this ratio rises, gold is outperforming silver, typically a signature of risk-off positioning or broad metals weakness. Historically, when the ratio peaks and begins reversing lower, silver transitions to outperforming gold significantly during the recovery phase.
A rising ratio during the current correction suggests silver will experience proportionally larger drawdowns before the bottom is established, with silver potentially reaching the $55 to $56 zone. However, this same dynamic implies silver offers disproportionate upside during the subsequent recovery, making it a key tactical consideration for investors positioning for the rebound.
Sentiment as the Missing Variable: What Positioning Data Reveals
Why Sentiment Analysis Completes the Picture
Price charts document what has already happened. Sentiment data reveals something charts cannot: how much selling pressure remains in the market. When bearish positioning reaches extremes, the marginal seller runs out. At that point, even modest buying pressure can produce explosive moves because there is no offsetting supply from panicked holders.
This is the structural mechanism behind sharp reversals in secular bull markets. The move is not driven by an immediate influx of new buyers. It is initially driven by the disappearance of sellers and the forced covering of short positions.
Bank of America Global Fund Manager Survey: A Critical Sentiment Signal
The Bank of America Global Fund Manager Survey provides one of the most comprehensive readings of institutional positioning available. The metric of interest here is the net percentage of fund managers who consider gold overvalued.
Currently, that reading has collapsed to approximately +2%, near a 2.5-year low. To contextualise the significance: this survey showed extreme bullish readings just one to two months before gold broke out of its 13-year cup-and-handle pattern. The current reading represents the mirror image of that extreme, occurring in the opposite direction.
Historically, comparably bearish fund manager readings in secular bull markets have corresponded with significant buying opportunities, not with the onset of sustained downtrends. The last time comparable bearish extremes were visible in this survey was during the late 2008 and early 2009 period, which preceded significant advances in the gold price.
GLD Fund Flow Data: The Capitulation Indicator
Smoothing daily ETF fund flow data over a 100-day moving average provides a cleaner signal of sustained directional money movement. Current readings for GLD fund flows have declined sharply to levels matching both the 2022 correction low and the late 2020 correction low. Both of those prior instances preceded meaningful price recoveries.
The interpretation is straightforward: sustained ETF outflows of this magnitude reflect capitulation-level positioning by institutional participants, not orderly profit-taking. When fund flows stabilise and begin reversing from these levels, it has historically provided an early confirmation signal that the correction is exhausting itself.
GLD Six-Month Put/Call Skew: Institutional Hedging at a Decade Extreme
The put/call skew on GLD measures the relative cost of purchasing downside protection versus upside participation. Elevated skew readings indicate institutional participants are paying a significant premium to hedge against further price declines.
Current readings on the GLD six-month put/call skew are at approximately a 9 to 10-year high. This is a powerful contrarian signal. In secular bull markets, extreme skew readings have historically marked exhaustion of bearish positioning rather than the beginning of sustained declines. When the skew begins declining from elevated levels, it signals that institutional hedging demand is fading, which typically coincides with the transition from correction to recovery.
The Structural Underallocation Problem: A Multi-Year Demand Catalyst
Beyond short-term positioning, the structural allocation data presents one of the most compelling long-term arguments for gold's ongoing bull market. In addition, central bank influence on gold remains a powerful structural underpinning that amplifies the case for sustained demand over time.
| Allocation Metric | Current Reading | Historical Reference |
|---|---|---|
| Gold ETF share of total ETF assets | Below 2% | ~8% at 2011 peak |
| Gold ETF share during 2008 financial crisis | ~7% | Peak crisis allocation |
| JP Morgan Global Family Office Survey (333 offices, 30 countries) | 72% hold zero gold | Average net worth $1.6 billion per office |
| Average gold allocation among the 28% who do hold it | ~0.9% | Far below typical strategic allocation targets |
The structural case embedded in this data is significant. The world's wealthiest family offices, representing enormous pools of capital, are almost entirely absent from gold markets. Even a modest reallocation toward gold from this cohort could represent a sustained demand catalyst over multiple years.
Seasonal Tendencies and the Summer Low Pattern
Does the June to August Window Matter?
Seasonal analysis across multiple decades identifies a recurring tendency for gold, silver, and mining equities to form intermediate lows during the June through August period. The pattern is associated with reduced institutional participation during summer months, lower overall trading volumes, and the absence of major demand catalysts that typically emerge in other parts of the calendar year.
Several important caveats apply:
- Seasonal tendencies are probabilistic patterns, not deterministic outcomes
- Their predictive value increases significantly when aligned with technical and sentiment signals rather than applied in isolation
- The pattern has failed at various points in history, particularly during periods of acute macro stress
What makes the current setup more compelling than a standalone seasonal argument is the convergence of multiple independent signals. Technical analog support zones, extreme bearish sentiment readings across multiple indicators, and the seasonal tendency all point toward the same approximate timeframe. Consequently, this type of confluence across independent analytical frameworks is relatively rare and has historically corresponded with higher-probability reversal setups.
The next major ASX story will hit our subscribers first
Junior Miners: What GDXJ Breadth Is Signalling
A Critical Breadth Indicator Approaching Extreme Levels
The percentage of GDXJ constituent stocks trading above their 200-day moving average serves as a breadth indicator for the junior mining sector. When this reading falls to 10% or below, it identifies deeply oversold conditions that have historically preceded significant sector recoveries.
Recent readings reached approximately 8%, placing the indicator in the zone that has previously corresponded with major buying opportunities in junior miners. An important nuance: breadth extremes do not always mark the exact price bottom. The actual low can form days to weeks after the initial extreme breadth reading, as the market works through residual selling pressure before the reversal takes hold.
GDXJ Bottom Scenarios
Consistent with the broader false new low thesis, two scenarios are most probable for GDXJ:
- A double bottom forms near current levels, with the second test accompanied by declining volume and improving breadth readings
- GDXJ briefly undercuts recent lows, potentially toward the $90 zone, triggering a final capitulation flush before reversing sharply as breadth returns toward the 0% to 10% zone on any secondary test
Both scenarios are structurally consistent with the gold and silver false new low before summer rebound thesis playing out simultaneously across gold, silver, and the junior mining complex, reinforcing the probability that any final low forms across the entire precious metals ecosystem rather than in isolated instruments.
A Framework for Identifying the Actual Bottom
Rather than relying on any single indicator, experienced precious metals analysts monitor a convergence of signals across technical, sentiment, and fundamental dimensions. The following sequential framework represents a disciplined approach to identifying when the correction has genuinely exhausted itself:
- Monitor gold's price action relative to the $3,850 to $4,050 support cluster for signs of exhaustion selling and declining downside momentum
- Track the gold-silver ratio for evidence of a peak and early reversal, which historically precedes the beginning of silver's outperformance phase
- Watch GLD fund flow data for stabilisation and early reversal in the 100-day moving average, confirming capitulation is giving way to re-accumulation
- Confirm GDXJ breadth (percentage of stocks above the 200-day moving average) returning toward the 0% to 10% zone on any secondary test of recent lows
- Monitor the put/call skew on GLD for evidence that it is declining from its elevated decade-high levels, indicating institutional hedging demand is fading
- Align the technical and sentiment signals with the seasonal June to August window for maximum analytical confluence across independent frameworks
Frequently Asked Questions: Gold and Silver False New Low Before Summer Rebound
What Exactly Is a False New Low in Precious Metals?
A false new low describes the brief penetration of a prior significant support level before a sharp reversal higher. In precious metals markets, this pattern is particularly powerful because the penetration systematically triggers stop-loss orders and attracts short-sellers, creating the fuel for an explosive recovery as those positions are forced to close at a loss.
How Reliable Are Historical Correction Analogs for Timing a Gold Bottom?
Correction analogs provide probabilistic frameworks, not certainties. The value strengthens when multiple independent corrections share similar structural characteristics, as appears to be the case with the 1973, 2006, and current corrections. The signal is most actionable when confirmed by supporting sentiment and positioning data pointing in the same direction. For a broader perspective, silver versus gold performance across historical patterns offers further context on how these divergences and convergences have played out over time.
Could Gold and Silver Fall Further Before Any Rebound?
Yes. The false new low thesis explicitly anticipates the possibility of additional near-term selling before the reversal. A final capitulation move that briefly undercuts recent lows is part of the pattern itself, not a contradiction of it. Furthermore, analysts at Ainsley Bullion have outlined reasons why gold and silver will rebound strongly, noting that the structural demand case remains intact even through periods of sharp correction. Investors considering positioning for the rebound need to be prepared for short-term drawdowns that may psychologically feel like confirmation of a sustained bear market.
What Role Does the Gold-Silver Ratio Play in This Setup?
The rising gold-silver ratio during the current correction indicates gold is holding up better than silver, consistent with risk-off conditions. When the ratio peaks and begins declining, it has historically served as an early warning signal that the metals complex is transitioning from correction to recovery, with silver typically outperforming gold significantly during the subsequent advance.
What Does Structural Underallocation Mean for the Long-Term Gold Outlook?
With implied gold ETF allocation below 2% of total ETF assets compared to historical peaks above 8%, and the majority of the world's largest family offices holding zero gold exposure, the structural demand case for the metal remains largely untapped. This data does not drive short-term price action but establishes the foundation for why a resumption of the secular bull market could be significantly more powerful than the initial phase of the current cycle.
The Investor Psychology of Buying at Maximum Pessimism
Why the Highest Returns Come from the Most Uncomfortable Moments
The historical record across commodity and equity cycles is consistent on one point: the entry points that generate the largest multi-year returns are almost never comfortable in real time. They occur during periods of maximum pessimism, when the weight of bearish evidence feels overwhelming and the case for buying feels intellectually indefensible to most market participants.
Corrections of 20% to 30% within secular bull markets have historically represented accumulation opportunities rather than signals of structural trend reversal. The risk/reward calculus involves accepting short-term volatility and psychological discomfort in exchange for exposure to a recovery that, when fundamental conditions eventually align, can carry prices significantly beyond prior highs. Market data on precious metals recoveries after crashes consistently supports this view across multiple historical cycles.
The most important distinction in secular bull market investing is between a cyclical correction and a structural trend reversal. Getting that distinction wrong costs investors both money and the irreplaceable asset of time spent on the wrong side of a major market cycle.
Understanding the anatomy of a gold and silver false new low before summer rebound, monitoring the sentiment indicators that signal exhaustion of selling pressure, and maintaining the discipline to act during periods of maximum pessimism are the core competencies that separate investors who capture the bulk of a secular bull market's returns from those who participate only when confidence is already high and most of the gains have already been made.
Disclaimer: This article is intended for educational and informational purposes only and does not constitute financial advice. All technical analysis frameworks, historical analogs, sentiment indicators, and scenario projections discussed represent analytical tools subject to significant uncertainty. Precious metals markets are inherently volatile and historical patterns do not guarantee future performance. Investors should conduct independent research and consult with qualified financial professionals before making any investment decisions. All price levels and indicator readings referenced reflect the analytical period discussed and may change materially.
Ready to Act on the Next Major Precious Metals Discovery Before the Market Catches On?
Discovery Alert's proprietary Discovery IQ model scans ASX announcements in real time, instantly identifying significant mineral discoveries across gold, silver, and the broader commodities complex — turning complex data into clear, actionable insights for investors at every experience level. Explore historic discoveries and their exceptional returns to understand the opportunity, then begin your 14-day free trial at Discovery Alert to position yourself ahead of the broader market.