July 16, 2026
When Financial Engineering Outpaces Physical Reality
The history of commodity markets is, at its core, a story of tension. On one side sits the tangible, finite world of physical extraction, industrial consumption, and geological scarcity. On the other sits an ever-expanding universe of financial instruments, synthetic exposure, and leveraged paper claims. For most of modern economic history, these two worlds maintained a rough correspondence. Today, that correspondence has broken down in ways that carry profound implications for investors, policymakers, and anyone trying to understand why gold and silver market distortion has made price signals increasingly unreliable.
Understanding gold and silver market distortion requires more than observing price movements. It demands a structural diagnosis of how modern financial architecture systematically overrides the signals that physical scarcity would otherwise send.
When big ASX news breaks, our subscribers know first
What Gold and Silver Market Distortion Actually Means
Gold and silver market distortion refers to the systematic divergence between prices established in paper-based derivative and ETF markets and the actual supply-demand dynamics of physical metal. This occurs when leveraged instruments, concentrated short positions, and synthetic trading volumes overwhelm the signals sent by real-world scarcity, industrial consumption, and central bank accumulation.
The most direct illustration of this problem comes from examining the trading mechanics of silver ETFs. The largest silver ETF by volume, SLV, trades on average between 25 and 50 million ounces of alleged silver exposure per day. During high-volatility periods, that figure can spike to 50 million ounces in a single session. Annualised, this implies paper silver turnover somewhere between 1.5 billion and 10 billion ounces per year across the ETF alone.
The critical context: global silver mine production sits at approximately 800 million ounces per year. The paper market is not merely larger than physical supply. In peak trading periods, it dwarfs it by an order of magnitude. Each SLV share is theoretically backed by 0.9 ounces of physical silver held in custody. In practice, the velocity and volume of paper trading bear no meaningful relationship to the physical inventory it purports to represent.
This is not a marginal inefficiency. It is a structural feature of how precious metals are priced in modern markets.
Key Distortion Metrics at a Glance
The scale of the problem becomes clearer when core market metrics are placed side by side.
| Distortion Indicator | Current Market Reality | Historical Benchmark |
|---|---|---|
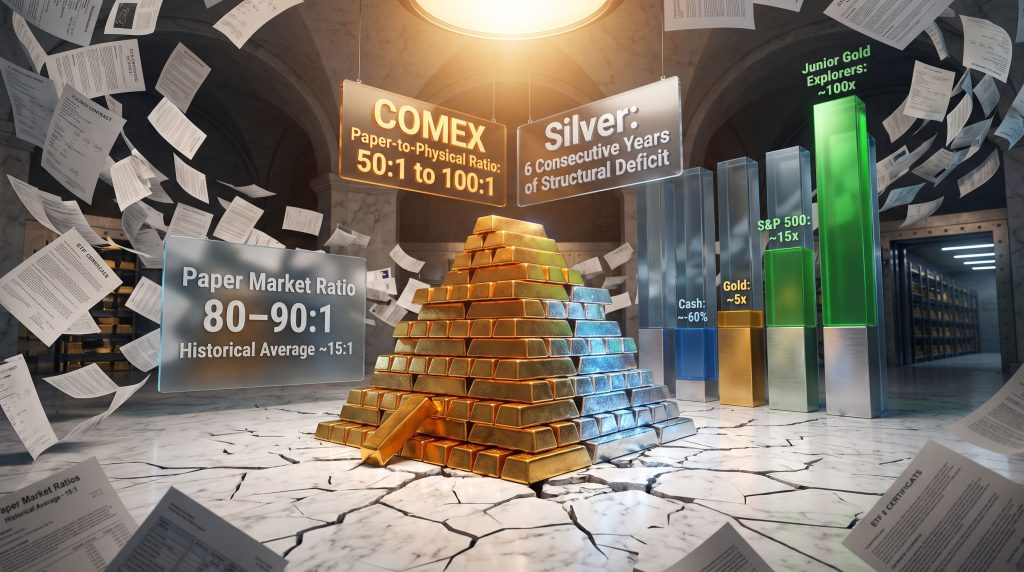
| COMEX Paper-to-Physical Ratio | 50:1 to 100:1 | Historically far lower |
| Gold-Silver Ratio (Paper Markets) | 80-90:1 | Historical average ~15:1 |
| Silver ETF Daily Volume (SLV) | 25-50M oz/day; up to 50M oz in volatility spikes | No comparable precedent |
| Implied Annual SLV Paper Turnover | 1.5-10 billion oz/year | Annual mine supply ~800M oz |
| Silver Structural Deficit Duration | 6 consecutive years | Rare in modern commodity history |
| London Silver Lease Rates (Peak) | 24-30% | Extreme by any historical standard |
| Gold Price (Recent Cycle) | ~$5,600 ATH then -8% correction | Sharpest single-session drop since 1980 |
| Silver Price Drop (Recent) | -31% to under $80 | Sharpest one-day loss since 1980 |
| Fed Balance Sheet Growth (Dec 2025-Present) | +~$250 billion | Still $2T above post-GFC peak |
| China Treasury Holdings | $1.3T peak to ~$650B current | Significant structural reallocation |
The gold-silver ratio analysis sitting at 80 to 90:1 in paper markets while the historical geological and monetary average hovers near 15:1 is one of the most stark indicators that paper pricing has decoupled from physical fundamentals. Silver is either dramatically undervalued relative to gold, or the ratio itself reflects systematic suppression of silver's price discovery mechanism.
The Four Mechanisms Driving Price Suppression
Mechanism 1: Leveraged ETF Rebalancing Loops
Standard ETFs track an asset. Leveraged ETFs do something structurally different: they rebalance daily to maintain a fixed leverage multiple. This mechanical requirement forces them to buy when prices rise and sell when prices fall, amplifying momentum in both directions. During volatile sessions, this rebalancing becomes a self-reinforcing feedback loop that accelerates price movements far beyond what underlying supply-demand fundamentals would justify. The result is price action driven by instrument mechanics rather than physical market conditions.
Mechanism 2: Concentrated Short Positions and Futures Spoofing
Large financial institutions have historically maintained disproportionate short exposure on COMEX futures markets. The mechanics of spoofing, which involves placing large sell orders to create artificial downward pressure before cancelling them, have been the subject of regulatory enforcement actions. However, enforcement gaps persist. When a handful of institutions can consistently suppress spot prices through coordinated paper selling, the resulting price does not reflect genuine supply and demand. It reflects institutional positioning.
Mechanism 3: Geographical Inventory Fragmentation
Physical silver and gold markets are not globally integrated in the way paper markets assume. The LBMA and COMEX markets hold different inventory profiles, creating localised squeeze conditions rather than global price equilibrium. When London lease rates spiked to 24 to 30%, that figure was not visible in the headline paper price, which continued to be set by COMEX futures activity occurring thousands of miles away from where the physical shortage was most acute.
Mechanism 4: Margin Requirement Escalation
When speculative pressure builds in futures markets, exchanges have the ability to raise margin requirements mid-cycle. This forces smaller and retail participants to close positions regardless of their view on fundamentals, concentrating market influence in fewer, larger institutional hands. The removal of distributed retail participation as a price discovery layer leaves the market dominated by the same entities whose short positions are suppressing price in the first place.
When COMEX futures enter extreme backwardation, meaning near-term contracts trade at a premium to future delivery, it historically signals that physical demand is overwhelming paper supply. Current backwardation conditions through 2028 in silver are more pronounced than those observed during the 1980 Hunt Brothers silver squeeze, which remains the most dramatic physical squeeze in modern precious metals history.
A Hundred Years of the Same Problem
The architecture of financial distortion in commodity markets is not new. The 1907 Panic, which is a crisis now approaching its 120th anniversary, was triggered not by mortgage securities or bank runs in the conventional sense, but by speculative cornering of the copper market. When copper speculation collapsed, it dragged down trust companies, closed exchanges, and triggered margin calls across the financial system.
The resolution required JP Morgan to personally convene the major banking interests of the era and coordinate what amounted to a $25 million Treasury backstop. This was, in effect, the first modern quantitative easing operation. Public funds were channelled through private financial networks to stabilise markets that private speculation had destabilised. The Federal Reserve Act of 1913, sold to the public as a solution to exactly this kind of crisis, institutionalised the relationship between central bank liquidity and private banking stability without eliminating the speculative dynamics that caused the crisis in the first place.
The parallels to 1929 are equally instructive. The leadup to the crash was characterised by:
- Rampant speculation in real estate and bank stocks
- Investment trust structures that concentrated risk while distributing it to retail buyers
- Insider selling beneath the retail buying wave
- A fundamental divorce between financial instrument valuations and the real economic activity they purported to represent
The mechanisms are different today. The instruments are more sophisticated. However, the underlying dynamic, which involves financial products generating trading volume that overwhelms the physical reality beneath them, is structurally identical.
Can the Federal Reserve Control Commodity Inflation?
One of the more consequential misconceptions in contemporary monetary policy discourse is the idea that central bank interest rate adjustments can meaningfully control commodity-driven inflation. The reality is considerably more constrained.
Central banks can influence the cost of money. They can adjust reserve requirements and signal policy intentions. What they cannot do is control mine output, logistics chains, industrial demand growth, or the geological reality that silver supply deficits have persisted for six consecutive years. Rate adjustments have no mechanism by which to increase silver extraction, reduce electrification-driven industrial demand, or compensate for underinvestment in new mining supply.
The empirical record from the most recent rate cycle underscores this point. Inflation remained above the Fed's stated 2% target throughout the entire sequence of rate reductions from 5.25% down to 3.75%. The Fed cut rates while inflation was above target, and the outcome was that it happened regardless.
The Federal Reserve's balance sheet grew by approximately $250 billion between December 2025 and mid-2026, a figure that roughly corresponds to the volume of ten-year Treasury bonds issued during the same period. The balance sheet remains approximately $2 trillion above its post-Global Financial Crisis peak despite years of stated tightening rhetoric. No incoming Fed leadership configuration changes the structural reality that Treasury debt servicing requirements constrain meaningful balance sheet reduction.
The next major ASX story will hit our subscribers first
Gold as a Long-Run Store of Value: The Historical Data
One way to contextualise the investment case for physical precious metals is through a long-run purchasing power comparison. Using 1992 as a baseline year, which coincides with China's strategic decision to develop rare earth dominance, the relative performance of asset classes tells a revealing story.
| Asset Class | Approximate Return (Purchasing Power Adjusted, 1992-Present) |
|---|---|
| Cash (held) | ~-60% (purchasing power loss) |
| U.S. Treasury Bonds | ~2x original investment |
| Gold | ~5x original investment |
| S&P 500 Index | ~15x original investment |
| Top-Tier Gold Mining Companies | ~20x original investment |
| Junior Gold Explorers (survivors) | ~100x original investment |
The cascade from physical metal to mining equities to junior explorers reflects increasing leverage to the underlying commodity at each tier. Junior developers that successfully moved from exploration to production generated the highest returns, though with correspondingly higher attrition rates. The survivors produced extraordinary purchasing power-adjusted gains relative to every other asset class except the S&P 500 index.
The geopolitical dimension adds further structural weight to the gold allocation case. Furthermore, gold and silver central banks have reduced U.S. Treasury holdings, with China cutting from a peak of $1.3 trillion to approximately $650 billion, whilst simultaneously increasing sovereign gold reserves. This implies a continued buying runway exists before sovereign portfolios return to their historical allocation levels, even as the volume of outstanding U.S. Treasuries continues to grow.
The investment logic that connects Treasury yields to gold suppression breaks down over multi-year timeframes when central bank balance sheets are simultaneously expanding, sovereign gold buying is accelerating, and physical supply deficits are deepening. The rate-suppression narrative for gold has limited explanatory power in a world where those three forces are all moving in the same direction.
Why Silver Is Uniquely Vulnerable to Market Distortion
Silver's dual role as both a monetary asset and an industrial commodity makes it simultaneously more strategically important and more susceptible to manipulation than gold. Its irreplaceable properties in electrical conductivity, photovoltaic applications, defence electronics, and data infrastructure amplify this vulnerability considerably.
Several factors compound silver's susceptibility to gold and silver market distortion specifically:
- Market size: Silver's total market capitalisation is a fraction of gold's, meaning smaller absolute volumes of paper selling can move prices proportionally further
- Industrial demand acceleration: Electrification, defence spending, data centre buildout, and grid infrastructure expansion are all silver-intensive, creating demand growth that mining supply cannot match
- Six-year structural deficit: This deficit figure does not incorporate projected demand increases from electrification. It represents current demand against current supply. The deficit trajectory on a forward basis is substantially worse than the headline number implies
- Lease rate extremes: Spot lease rates reaching 24 to 30% signal acute physical tightness that paper price mechanisms are not accurately transmitting to market participants
The Commodity Super-Cycle and the Return of Physical Primacy
There is a historical pattern worth examining alongside the current market structure. The foundational wealth creation of the late 19th and early 20th centuries, associated with Carnegie in steel, Rockefeller in oil, and Ford in manufacturing, was built on physical commodity foundations. Over subsequent decades, financial capitalism progressively abstracted away from those physical foundations, and the relationship between paper claims and underlying physical reality became increasingly attenuated.
The current cycle suggests a rotation back toward resource primacy. China's construction of rare earth supply chain dominance, beginning from a strategic decision made around 1992, represents the most significant commodity-based geopolitical repositioning since Middle Eastern oil control became a strategic variable in the 1970s. According to analysts tracking precious metals plunges, military supply chain dependencies on geographically concentrated materials are reshaping commodity investment theses across rare earths, uranium, copper, and precious metals.
The mainstreaming of physical commodity investment, visible in everything from institutional allocation shifts to retail gold bar availability at major consumer retailers, reflects growing recognition that the financial system's paper abstractions cannot indefinitely substitute for the physical assets that underpin economic activity. In addition, factors influencing gold and silver prices in Australia are increasingly shaped by these same global structural forces.
Frequently Asked Questions: Gold and Silver Market Distortion
What is the difference between paper gold/silver and physical gold/silver?
Paper gold and silver refer to financial instruments including futures contracts, ETFs, and derivatives that represent claims on metal but rarely result in physical delivery. Physical gold and silver are tangible assets held in vaults or directly by investors. The critical distortion occurs when paper trading volumes vastly exceed available physical supply, allowing price signals to diverge from real-world scarcity.
Why does the COMEX paper-to-physical ratio matter?
When paper claims on silver or gold trade at 50:1 to 100:1 relative to actual physical inventory, prices are being set by leveraged financial activity rather than supply and demand for the real asset. This creates artificial price suppression during normal conditions and violent price corrections when physical delivery is actually demanded.
Is the current gold-silver ratio historically normal?
No. The current paper market ratio of 80 to 90:1 is dramatically elevated compared to the historical average of approximately 15:1. This divergence is widely cited as evidence of structural price suppression in silver relative to gold.
What is COMEX backwardation and why does it matter for silver?
Backwardation occurs when near-term futures prices trade above longer-dated contracts, the opposite of the normal contango structure. Extreme backwardation through 2028 in silver signals that physical demand is so acute that buyers are willing to pay a premium for immediate delivery, a condition analysts compare to and in some measures describe as exceeding the conditions that characterised the 1980 Hunt Brothers squeeze.
How does a leveraged ETF distort silver prices differently from a standard ETF?
Standard ETFs track an index or asset. Leveraged ETFs rebalance daily to maintain a fixed leverage multiple, which mechanically forces them to buy when prices rise and sell when prices fall. This amplifies momentum in both directions, creating feedback loops that can accelerate both rallies and selloffs beyond what underlying supply-demand fundamentals would justify.
Navigating Distorted Markets: What Investors Should Understand
For investors attempting to navigate markets characterised by structural gold and silver market distortion, several principles deserve consideration:
- Distinguish price from value. In suppressed markets, the paper price and the underlying fundamental value can diverge for extended periods. Position sizing and time horizon assumptions need to account for this gap.
- Understand the spectrum of exposure. Physical metal, streaming royalties, senior producers, mid-tier developers, and junior explorers each carry different risk and leverage profiles relative to the underlying commodity. The 100x purchasing power return cited for junior miner survivors comes with significant selection risk.
- Monitor structural signals rather than price alone. Backwardation depth, lease rate levels, central bank purchase volumes, and deficit duration are more reliable indicators of physical market conditions than headline paper prices.
- Evaluate counterparty and custody risk. In a fragmented physical market where regional tightness can diverge sharply from paper pricing, the specifics of storage, custody arrangements, and delivery obligations matter considerably.
- Weight the supply constraint reality. Gold is approaching structural deficit conditions. Silver is already six years into one. These constraints cannot be resolved by monetary policy, financial engineering, or derivative creation. Only increased physical supply, reduced demand, or price adjustment can clear the market.
The Long-Term Convergence Between Paper Price and Physical Reality
Market distortion in gold and silver is not a temporary anomaly waiting to be corrected by the next FOMC meeting or the next Fed chair's policy statement. It is a structural feature of modern financial architecture, with roots traceable through the 1907 Panic, the 1929 speculation cycle, the post-2008 quantitative easing era, and the current period of persistent physical deficits and expanding paper markets.
The convergence thesis holds that physical scarcity will eventually override paper suppression. History provides support for this view: no commodity deficit has persisted indefinitely without ultimately forcing price adjustment. The mechanisms of suppression are powerful, but they operate within physical constraints that financial engineering cannot dissolve.
Key signals worth monitoring as this dynamic evolves include backwardation depth in silver futures, London lease rate trajectories, central bank gold accumulation rates relative to historical reserve percentages, and the duration and widening of structural supply deficits across both metals.
Disclaimer: This article is intended for informational and educational purposes only. It does not constitute financial advice, investment recommendations, or an offer to buy or sell any security or commodity. All figures, statistics, and projections referenced involve uncertainty and should not be relied upon as guarantees of future performance. Investors should conduct their own due diligence and consult qualified financial advisers before making investment decisions. Past performance of any asset class is not indicative of future results.
Want to Capitalise on the Next Major Mineral Discovery Before the Broader Market?
While paper markets continue to distort precious metals pricing, the real opportunity lies in identifying significant ASX mineral discoveries the moment they are announced — Discovery Alert's proprietary Discovery IQ model does exactly that, delivering real-time alerts that turn complex geological data into actionable insights for both short-term traders and long-term investors. Explore how historic discoveries have generated extraordinary returns on Discovery Alert's dedicated discoveries page, and begin your 14-day free trial today to position yourself ahead of the market.