July 17, 2026
When Parabolic Gains Reverse: Understanding the Physics of Precious Metals Corrections
Every major commodity cycle carries within it the seeds of its own reversal. The more vertical the ascent, the more mechanical the eventual correction tends to be. This is not pessimism or market timing speculation — it is simply the observable behaviour of leveraged, sentiment-driven markets across decades of recorded price history. Gold and silver are no exception to this dynamic, and mid-2026 finds both metals navigating precisely this kind of inflection point.
The gold and silver price decline forecast currently circulating across institutional research desks and independent technical analysis communities reflects a convergence of macro pressures, overextended positioning, and technical deterioration. Understanding how these forces interact — and what the historical record suggests about their likely trajectory — is essential for any investor holding meaningful exposure to precious metals.
When big ASX news breaks, our subscribers know first
The Macro Architecture Pressing Against Precious Metals
Several structural forces are working in concert to suppress gold and silver valuations in the current environment. None of them operate in isolation, and their compounding effect is what makes the current setup particularly significant.
Real interest rates remain the single most powerful macro variable affecting non-yielding assets like gold and silver. When central banks maintain elevated policy rates, the opportunity cost of holding a metal that generates no income rises sharply. Capital that might otherwise seek shelter in gold tends to migrate toward yield-bearing instruments, reducing speculative and institutional demand simultaneously. Understanding gold and real rates is therefore fundamental to any macro-level analysis of precious metals.
The U.S. dollar's relative strength compounds this dynamic. Because gold and silver are priced globally in dollars, a stronger greenback mechanically compresses prices in dollar terms, even if underlying demand remains constant. Dollar strength and elevated rates tend to reinforce each other, creating a dual headwind that historically has produced meaningful corrections in precious metals cycles.
What makes the current environment distinctive is the divergence between gold and silver. Gold has demonstrated a notable reluctance to break decisively below the $4,000/oz level, repeatedly testing it but recovering. Silver, by contrast, has been unable to sustain prices above $60/oz for any meaningful duration, with seven consecutive daily closes below that threshold in recent sessions. This divergence is not incidental — it reflects something important about the nature of each metal's demand structure.
When silver consistently underperforms gold during a shared downtrend, it frequently signals that industrial demand expectations are deteriorating alongside safe-haven sentiment. This dual demand erosion amplifies silver's downside risk beyond what technical chart levels alone would suggest.
What Institutional Forecasts Reveal About the Range of Outcomes
The divergence in institutional forecasts for gold through 2026 and into 2027 is unusually wide, reflecting genuine uncertainty about the macro trajectory. The table below presents a comparative framework of major bank positions:
| Institution | Gold Forecast (Q3 2026) | Gold Forecast (Q4 2026) | End-2026 / 2027 Outlook |
|---|---|---|---|
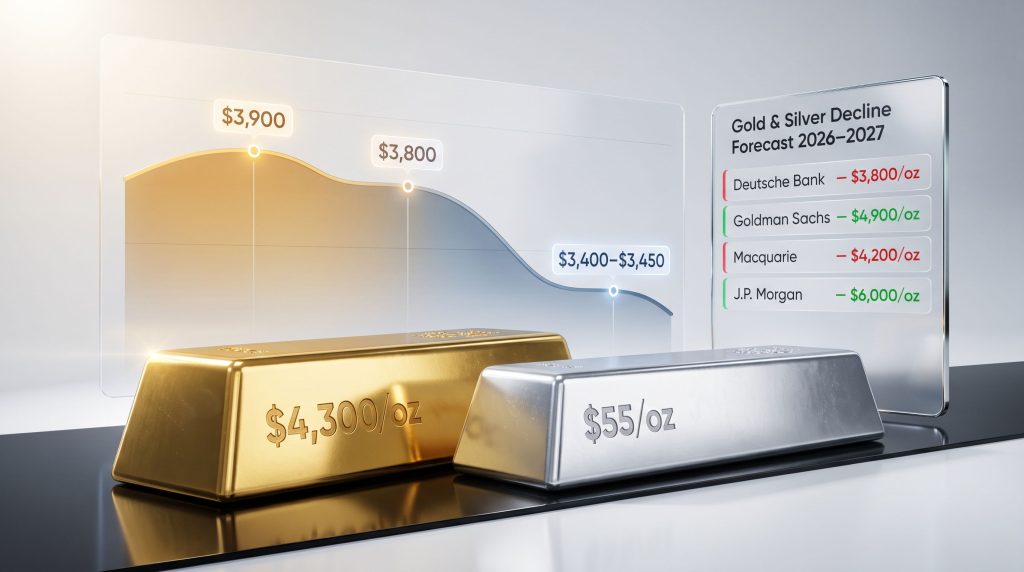
| Deutsche Bank (Bearish) | ~$4,300/oz | ~$4,800/oz | Risk of $3,800/oz if Fed hikes 3-4x |
| Goldman Sachs (Revised) | Not specified | $4,900/oz | Downgraded from prior $5,400 target |
| Macquarie (Moderate) | ~$4,000/oz avg 2026 | Not specified | $4,200/oz in 2027; declining to 2030 |
| J.P. Morgan (Bullish) | Not specified | $6,000/oz by year-end | $6,300/oz in 2027 |
| UBS (Bullish) | $6,200/oz near-term | ~$5,900/oz year-end | Slight pullback after near-term peak |
The spread between Deutsche Bank's floor scenario of $3,800/oz and J.P. Morgan's $6,000/oz target represents an extraordinary range for a single calendar year. This is not noise — it reflects fundamentally different assumptions about Federal Reserve policy, dollar trajectory, and the durability of structural demand from central banks.
Goldman Sachs's downward revision from $5,400/oz to $4,900/oz is arguably more instructive than either extreme, because it signals a shift in consensus thinking at one of the most closely watched institutional forecasters. Revisions of this nature tend to carry psychological weight in professional markets, often prompting secondary repositioning among funds that use Goldman's research as a benchmark.
Macquarie's forecast of gradual annual price declines extending through 2030 represents the most structurally bearish scenario among major institutions. This is not a short-term correction call — it is a view that the current pricing environment reflects a multi-year peak rather than a temporary pullback within an ongoing bull market.
The Technical Architecture: Where Gold and Silver Find Support
Gold's Critical Price Levels
Technical analysts have identified $3,900/oz as the threshold that separates a controlled consolidation from an accelerated decline in gold. A sustained break below this level would remove a key psychological anchor and likely trigger momentum-driven selling from systematic and trend-following strategies.
The next meaningful technical support zone sits at $3,400 to $3,450/oz. If $3,900/oz fails to contain selling pressure, there is relatively limited structural buying between these two levels to slow the descent. In practical terms, this creates the conditions for a sharp, rapid decline rather than a gradual drift lower.
The scale of this potential move requires context. Gold roughly doubled over approximately nine months during 2025. A correction of $500/oz from current levels would represent a proportionate, if painful, mean-reversion relative to that advance. Historically, parabolic advances in commodities across any asset class have tended to produce corrections of comparable velocity and magnitude on the downside.
A sharp correction in gold does not necessarily signal the end of a long-term bull market. Analysts draw a careful distinction between a cyclical pullback within a secular uptrend and a structural reversal. The appropriate investor response depends heavily on which interpretation aligns with an individual's time horizon and risk tolerance.
Silver's Steeper Exposure
Silver's technical situation carries greater downside risk than gold for several compounding reasons. The metal approximately tripled during 2025 before the current corrective phase began, creating a proportionally larger base from which a correction could unfold. Meanwhile, the absence of meaningful technical support below $50/oz creates a potential vacuum that accelerates any breakdown once that threshold gives way.
The table below maps out silver's key scenario levels:
| Scenario | Price Level | Implication |
|---|---|---|
| Near-term resistance failure | Below $60/oz | Bearish momentum continuation |
| Moderate decline target | ~$55/oz | Technical support zone entry |
| Accumulation zone | $45-$55/oz | Potential long-term buyer interest |
| Deep correction target | ~$40/oz | No significant support below $50 |
| Macquarie base forecast | $65/oz by end-2027 | Gradual decline from Q4 2026 levels |
The $50/oz level functions as both a technical and psychological barrier. Below it, there is a meaningful absence of structural buying interest based on historical chart patterns, which means a breach could produce a rapid move toward $40/oz without the normal sequence of pauses and stabilisation that characterise more orderly declines.
Silver's Dual Identity: Why Industrial Demand Makes It More Vulnerable
Unlike gold, which derives the overwhelming majority of its value from monetary and safe-haven demand, silver occupies a hybrid position in global markets. Silver's dual demand nature means that roughly 50% of annual silver demand comes from industrial applications, including solar panel manufacturing, electronics, and medical devices. Consequently, silver's price is sensitive not only to financial market sentiment but also to the health of the global manufacturing cycle.
When industrial demand expectations weaken alongside deteriorating safe-haven sentiment, silver faces a dual compression that gold simply does not experience to the same degree. This structural characteristic explains why the gold and silver price decline forecast tends to carry steeper percentage targets than equivalent gold forecasts during macro downturns.
The gold-silver ratio analysis, which measures how many ounces of silver are required to purchase one ounce of gold, serves as an important relative value signal. When the ratio expands sharply during a shared downtrend, it typically confirms that silver is being sold on both its monetary and industrial demand legs simultaneously. Investors who monitor this ratio as part of their rebalancing framework can use it to identify potential relative value opportunities at cycle lows.
The Three Catalysts Driving the Current Decline
Catalyst 1: Federal Reserve Policy and Real Rate Pressure
The inverse relationship between real interest rates and gold prices is one of the most robust relationships in financial markets. When real rates rise, the relative attractiveness of gold as a store of value diminishes because the opportunity cost of holding a non-yielding asset increases. Deutsche Bank's most bearish scenario, which envisions gold at $3,800/oz, is predicated specifically on the Federal Reserve delivering three to four additional rate hikes from current levels. This would materially strengthen the dollar and compress precious metals valuations across the board.
Catalyst 2: Demand Destruction and Overvaluation Signals
Independent technical analysts have noted that silver, in particular, appears overvalued relative to its industrial demand fundamentals at current price levels. When speculative positioning drives prices significantly above what industrial demand alone would support, a reversion becomes not just possible but mathematically probable as the speculative component unwinds. Furthermore, demand destruction of this kind differs importantly from speculative selling because it removes structural buying interest that would otherwise support prices during corrections.
Catalyst 3: Leverage Flush and Speculative Unwind
The 2025 rally in both metals attracted significant leveraged speculative positioning. As prices stall and begin to reverse, margin calls on these positions create a self-reinforcing selling cycle. Leveraged positions that were profitable at higher prices become loss-generating at lower ones, triggering forced sales that push prices lower still, which triggers further margin calls. This mechanical process can accelerate declines well beyond what fundamental analysis alone would predict, creating both significant risk and, eventually, opportunity for patient long-term buyers. Investors interested in shorting precious metals should pay particular attention to this dynamic.
The next major ASX story will hit our subscribers first
Historical Precedents for Corrections of This Magnitude
The precious metals market has a well-documented history of producing sharp, deep corrections following parabolic advances. Gold corrected approximately 30% between 1980 and 1982 following a dramatic surge to then-record prices. Silver's correction from its 1980 peak was even more severe, erasing the vast majority of gains achieved during the Hunt Brothers episode.
More recently, gold fell from approximately $1,900/oz in 2011 to below $1,200/oz by 2013, a correction of roughly 35% that unfolded over approximately two years. The common thread across these historical episodes is that the magnitude of the correction tends to be proportionate to the velocity and scale of the preceding advance. Given that gold doubled and silver tripled during a nine-month window in 2025, the historical record provides genuine support for the scale of the corrections currently being forecast by the more bearish institutional voices.
Bull vs. Bear: What Each Scenario Requires
The Bearish Case Requires:
- Gold sustaining closes below $3,900/oz, triggering systematic selling strategies
- The Federal Reserve delivering multiple additional rate hikes, maintaining dollar strength
- Industrial demand for silver continuing to deteriorate in line with broader economic softening
- Speculative long positions continuing to unwind without fresh institutional buying to replace them
The Bullish Case Requires:
- Central bank gold demand remaining structurally elevated, providing a durable demand floor
- A geopolitical shock or escalation reigniting safe-haven demand and reversing sentiment rapidly
- The Federal Reserve pivoting toward rate cuts ahead of market expectations, weakening the dollar
- J.P. Morgan's structural demand thesis proving correct, with $6,000/oz becoming the central case
Frequently Asked Questions: Gold and Silver Price Decline Forecast
Will gold fall below $4,000/oz in 2026?
Gold has already tested the $4,000/oz level on multiple occasions in mid-2026, with recent sessions producing closes below this threshold. According to analysts' latest commentary, sustained trading below $4,000/oz would represent a meaningful technical breakdown and could trigger momentum-driven selling toward the $3,400 to $3,450/oz support zone.
What is the lowest gold could realistically fall in 2026?
Deutsche Bank's most bearish scenario places gold at $3,800/oz under aggressive Fed tightening. If that level fails to hold, technical analysis identifies $3,400 to $3,450/oz as the next meaningful support floor. Below that, there is limited structural buying identified by current technical frameworks.
Why is silver falling faster than gold?
Silver's hybrid role as both a monetary and industrial metal exposes it to a dual demand compression that gold does not face. Its proportionally larger 2025 rally also created a larger correction base. The absence of meaningful technical support below $50/oz amplifies the downside risk relative to gold.
How long could a gold and silver price decline last?
The analyst consensus ranges from several months to potentially multiple years of lower or range-bound prices. Macquarie's projection of gradual annual price declines through 2030 represents the most extended bearish timeline among major institutional forecasts.
Should investors buy gold and silver during a price decline?
The $45 to $55/oz range for silver and the $3,400 to $3,450/oz range for gold are identified by technical analysts as potential long-term accumulation zones. However, the absence of support below $50/oz in silver means that buyers in this range could face further drawdowns before any stabilisation emerges. Aligning entry strategy with investment time horizon is critical.
Portfolio Strategy During a Precious Metals Correction
Investors whose strategy depends entirely on continuously rising precious metals prices should carefully reassess their risk exposure. A prolonged consolidation or decline phase is a historically normal feature of commodity cycles and does not inherently invalidate a long-term thesis — but it does require disciplined position management.
Practical considerations for investors navigating the current environment include:
- Review position sizing to ensure precious metals concentration does not exceed risk tolerance thresholds during a multi-month or multi-year corrective phase
- Separate tactical from strategic exposure — short-term traders and long-term holders require fundamentally different approaches to the same price decline
- Monitor the gold-to-silver ratio as a rebalancing signal, using ratio extremes to shift relative allocations between the two metals rather than exiting entirely
- Track Federal Reserve policy signals as the primary macro driver, given the documented inverse relationship between real rates and precious metals pricing
- Watch central bank demand data on a quarterly basis, as sustained institutional purchasing from sovereign buyers provides a structural floor that speculative selling cannot easily overwhelm
Key Metrics Summary
| Metric | Current Context (Mid-2026) | Bearish Target | Bullish Target |
|---|---|---|---|
| Gold spot price | ~$4,400-$4,500/oz | $3,800-$3,450/oz | $6,000-$6,300/oz |
| Silver spot price | ~$68-$74/oz | $40-$50/oz | Not specified |
| Primary downside driver | Fed rate hikes + speculative unwind | Dollar strength + demand destruction | Central bank buying + safe-haven demand |
| Correction duration estimate | Ongoing | Months to years | Dependent on macro pivot |
The current gold and silver price decline forecast does not present a single inevitable outcome. It presents a range of plausible scenarios shaped by macro forces, technical structure, and investor behaviour. The most useful thing any investor can do is understand which scenario is unfolding in real time, monitor the key price levels and macro signals that distinguish one path from another, and ensure their portfolio is positioned to survive the worst case while remaining capable of participating in the recovery.
This article is intended for informational and educational purposes only. It does not constitute financial advice. Precious metals markets involve significant risk, and past price behaviour does not guarantee future results. Readers should consult a qualified financial adviser before making investment decisions.
Want to Stay Ahead of the Next Major ASX Mineral Discovery?
While precious metals markets navigate complex correction phases, significant mineral discoveries on the ASX continue to create substantial opportunities for well-positioned investors — Discovery Alert's proprietary Discovery IQ model delivers real-time alerts the moment a significant discovery is announced, turning complex data across 30+ commodities into clear, actionable insights, so explore historic discovery returns to understand the potential at stake, then start your 14-day free trial at Discovery Alert to ensure you're never the last to know.