July 25, 2026
Record Bullishness in the 2026 Gold and Silver Price Forecast Survey: What the Data Really Means
Sentiment in financial markets rarely moves in a straight line. Investor psychology oscillates between fear and greed, and precious metals markets are particularly sensitive to these swings. What makes the current moment in gold and silver markets genuinely unusual is not just that prices have risen sharply over a multi-year cycle, but that the gold and silver price forecast survey data shows private investor confidence has climbed to levels never previously recorded, even after both metals suffered significant corrections from their all-time highs. Understanding what this record bullishness reveals, and what it might be obscuring, requires looking beyond the headline numbers.
When big ASX news breaks, our subscribers know first
The Survey Behind the Numbers: Methodology and Historical Weight
The gold and silver price forecast survey data analysed here draws on BullionVault's twice-annual survey of precious metals investors, a dataset that has been collected consistently since late 2014. The mid-2026 edition gathered over 950 full responses, making it one of the more statistically meaningful retail investor sentiment trackers available in the precious metals space.
What gives this survey particular analytical weight is its longevity. With nearly 12 years of comparable data spanning 24 survey rounds, it captures how private investor expectations have evolved across multiple interest rate cycles, geopolitical crises, inflationary surges, and commodity market booms and busts. That continuity makes the latest readings genuinely significant rather than anecdotal.
Importantly, private investor surveys like this one differ structurally from institutional analyst polls. Panels assembled by organisations such as the LBMA or Reuters draw on professional traders, bank analysts, and commodity desk strategists who build quantitative models and factor in supply chain data, derivatives positioning, and macroeconomic projections. Retail investors, by contrast, tend to weight personal financial experience, media narratives, and portfolio composition more heavily. Both types of forecasts carry informational value, but they measure different things.
| Survey Source | Publication Date | Gold Forecast (2026) | Silver Forecast (2026) |
|---|---|---|---|
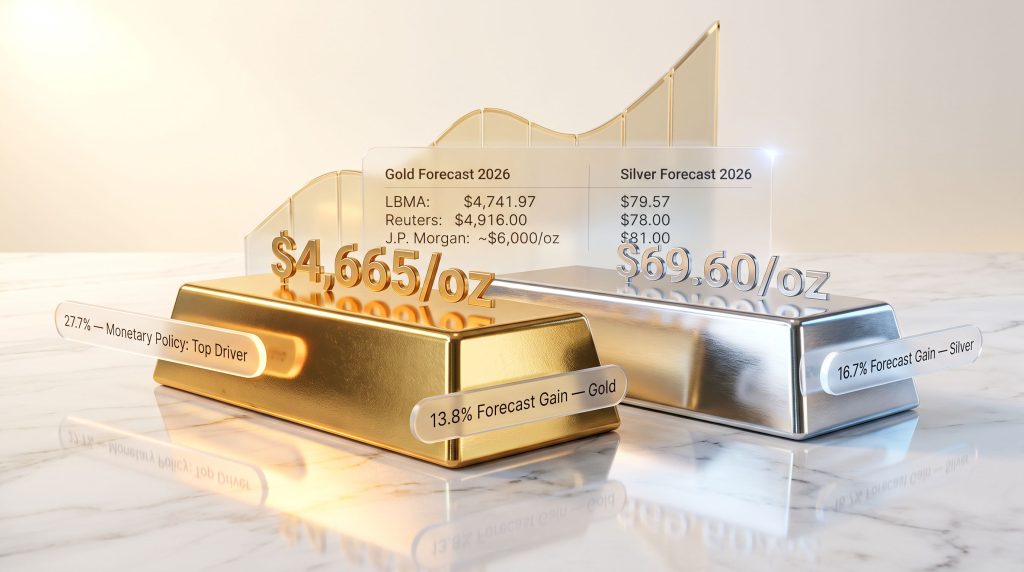
| LBMA Analyst Survey | January 2026 | $4,741.97/oz | $79.57/oz |
| Reuters Analyst Poll | February 2026 | $4,746.50/oz | $79.50/oz |
| Reuters Analyst Poll | April 2026 | $4,916.00/oz | $78.00/oz |
| J.P. Morgan Global Research | Ongoing 2026 | ~$6,000/oz (Q4 avg) | $81.00/oz |
| Private Investor Survey | July 2026 | ~$4,665/oz | ~$69.60/oz |
Record Bullishness: What the Mid-2026 Private Investor Survey Found
The headline result from the mid-2026 survey is unambiguous: private investor optimism on both gold and silver has reached its highest level in the survey's near-12-year history. Both the gold and silver mid-year forecasts represent record readings, and the combination of both metals achieving simultaneous sentiment peaks is itself historically unprecedented within this dataset.
On average, survey respondents project gold reaching approximately $4,665 per troy ounce by New Year 2027, implying a 13.8% gain from the roughly $4,100 per ounce price that prevailed during the survey period in mid-2026. For silver, the average forecast targets $69.60 per ounce, implying a 16.7% gain from survey-period prices, also the strongest mid-year silver prediction ever recorded in this series.
These figures must be contextualised carefully. Both gold and silver remain significantly below their respective all-time highs reached approximately six to seven months prior to the survey, with gold down more than 25% and silver down more than 50% from those peaks. The record bullishness is occurring against a backdrop of substantial prior price pain.
It is also worth noting that the mid-2026 gold forecast of $4,665 remains well below the New Year 2026 survey's full-year prediction of $5,136, the most bullish ever annual forecast in the series. Private investors have scaled back their absolute price targets while simultaneously reporting their highest-ever confidence level, a nuance worth examining closely.
Institutional vs. Retail Forecasts: Reading the Gap
Where Professional Analysts Stand
The institutional consensus for gold in 2026 has been progressively revised upward throughout the year. The LBMA's January 2026 analyst survey placed gold at $4,741.97 per ounce, almost exactly matched by the Reuters February poll at $4,746.50. By April, Reuters analysts had upgraded their view to $4,916 per ounce, reflecting improving price momentum at the time.
J.P. Morgan's gold research occupies a distinctly more bullish corner of the institutional landscape, forecasting gold averaging approximately $6,000 per ounce in Q4 2026 and silver at $81 per ounce. This places J.P. Morgan significantly above consensus, though it represents the kind of asymmetric upside case that institutional desks occasionally publish when structural arguments are strong enough to justify departing from the median view.
The Forecast Dispersion Problem
Perhaps more revealing than the consensus midpoints are the forecast ranges themselves. The LBMA's 2026 gold forecast spans from a bearish floor of $3,450 per ounce to a bullish ceiling of $7,150 per ounce, a spread of over $3,700. Silver's LBMA range runs from approximately $42 to $165 per ounce.
A forecast range this wide is not a failure of analytical rigour. It is an honest representation of genuine structural uncertainty. When the difference between the most pessimistic and most optimistic professional estimates spans more than 100%, it signals that the market is genuinely unpriceable using conventional models alone.
| Metric | Institutional Consensus | Private Investor Survey (Mid-2026) |
|---|---|---|
| Gold End-2026 Target | $4,742 to $4,916/oz | ~$4,665/oz |
| Silver End-2026 Target | $78 to $79.57/oz | ~$69.60/oz |
| Most Bullish Institutional View | ~$6,000/oz (J.P. Morgan) | N/A |
| Survey Methodology | Analyst/trader panel | Retail bullion investors |
The consistent gap between retail and institutional silver forecasts is particularly notable. Private investors are pricing silver approximately 10% to 12% below where professional analysts expect it to trade, suggesting retail investors either discount industrial demand growth more aggressively, or weight monetary and safe-haven drivers more heavily than the green energy and manufacturing tailwinds that institutional desks factor into their models. Furthermore, this divergence offers a useful lens through which to examine broader precious metals market analysis trends shaping the 2026 outlook.
What Is Actually Driving Precious Metals Prices? The Catalyst Rankings
Monetary Policy Reclaims the Top Spot
Survey respondents were asked to identify the single most important driver of precious metals prices for the second half of 2026. Monetary policy took the top ranking with 27.7% of responses, reclaiming the position it had briefly lost to geopolitics during the Trump re-election cycle. Across all 24 rounds of this survey since 2014, monetary policy has now topped the rankings in 13 out of 24 polls, with geopolitics second at 10 and inflation having led only once.
The mechanics here are well understood among sophisticated precious metals investors. Gold carries no yield, so its opportunity cost relative to interest-bearing assets rises and falls with real interest rates. When central banks signal easing or when real rates turn negative, gold's relative attractiveness improves materially. The survey finding suggests investors believe rate trajectory will be the primary determinant of where gold and silver trade by year-end. Consequently, central bank gold demand remains one of the most closely watched variables in professional precious metals analysis.
Geopolitics, Debt, and Physical Demand
The remaining driver rankings break down as follows:
- Geopolitics: 21.9% of respondents
- Government debt levels: 14.7% of respondents
- Physical supply and demand fundamentals: 14.0% of respondents
- Inflation: just 6.3% of respondents
The de-emphasis of inflation as a primary driver is intellectually significant. Inflation has topped the driver rankings only once in 24 survey rounds, during the New Year 2022 poll when US consumer price inflation was accelerating at its fastest pace since the early 1980s and Eurozone CPI was approaching double digits. The current near-absence of inflation as a top concern suggests investors have fundamentally repositioned gold in their mental frameworks, treating it less as an inflation hedge and more as a monetary policy and geopolitical risk instrument.
This shift represents a meaningful evolution in how retail investors conceptualise gold's role. The classical inflation hedge narrative, which dominated retail gold investing discourse for decades, appears to have given way to a more sophisticated understanding of gold as a real interest rate and reserve currency diversification asset.
The growing weight on sovereign debt levels (14.7%) is also worth noting. Structurally rising government debt-to-GDP ratios across major economies, particularly the United States, create a long-term argument for gold as a reserve asset whose supply cannot be inflated away. This is a distinctly different argument from the inflation hedge thesis, and its emergence as a standalone driver category reflects the maturation of retail investor analysis in this space.
Why Did Prices Fall? Private Investors Explain the Correction
Both gold and silver reached all-time highs approximately six to seven months before this survey was conducted, with gold down more than 25% and silver down more than 50% from those peaks by the time respondents were polled. The survey asked current precious metals holders what they believed caused this correction.
| Attributed Cause | Approximate Response Share |
|---|---|
| Profit-taking and capital reallocation | Largest single response |
| Shift in interest rate expectations | Second-ranked cause |
| Weaker consumer and central bank demand | Third-ranked cause |
| Boom-then-bust cycle dynamics | ~1-in-10 respondents |
| Combined: high prices as root cause | ~1-in-2 respondents (aggregate) |
The aggregated finding is striking: nearly half of all surveyed precious metals holders attributed the price correction primarily to the consequences of the preceding record highs themselves. This reflects a clear understanding of a well-documented economic mechanism: sufficiently elevated prices simultaneously incentivise profit-taking by existing holders and destroy demand among price-sensitive buyers including consumers, jewellery fabricators, and central banks.
Central bank behaviour during this period is particularly instructive. After a historic multi-year accumulation phase in which central banks globally added gold to reserves at rates not seen since the Bretton Woods era, the survey data suggests institutions reduced or partially reversed purchases as prices reached record levels. This demand destruction at the institutional level compounded the retail profit-taking dynamic, amplifying the correction.
The next major ASX story will hit our subscribers first
Understanding the Bears: Who Expects Prices to Fall?
Approximately one in five respondents holds a bearish outlook on both gold and silver heading into 2027. The wealth allocation data attached to these bearish views reveals something analytically important.
- Bears hold approximately 16.5% of investable wealth in precious metals
- Flat-price forecasters hold approximately 18.0%
- Bulls hold approximately 27.0% of investable wealth in precious metals
Investors who expect prices to fall still hold roughly one-sixth of their total investable wealth in an asset class they believe is overvalued. The most coherent explanation for this apparent contradiction is the hedging hypothesis: these investors hold precious metals not for directional price appreciation but as portfolio insurance. For a portfolio weighted toward equities, bonds, or real estate, a 16.5% precious metals allocation can serve as a structural hedge against tail risks without requiring the holder to be bullish on near-term price direction.
This distinction between speculative and insurance-driven precious metals ownership has meaningful implications for price analysis. Bearish holders with high allocations are unlikely to sell aggressively on small price dips, providing a demand floor that pure sentiment analysis would miss. Understanding gold as a safe-haven asset, rather than a purely speculative one, helps explain this behaviour more clearly.
Gold vs. Silver: The Relative Value Debate
The Gold-Silver Ratio as a Structural Signal
The gold-silver ratio, which measures how many ounces of silver are required to purchase one ounce of gold, has historically oscillated between roughly 40:1 and 90:1 during modern market cycles. Extreme readings in either direction have often preceded mean-reversion moves. Furthermore, gold-silver ratio analysis suggests that with silver's private investor forecast implying a 16.7% gain versus gold's 13.8%, the survey data indicates retail investors see slightly more upside potential in silver, consistent with a view that the ratio will compress as monetary conditions ease.
Silver's Industrial Complexity
Silver's dual identity as both a monetary metal and an industrial commodity creates a fundamentally different risk-return profile compared to gold. Industrial applications now account for more than half of annual silver demand globally, with solar panel manufacturing, electronics, and electric vehicle components among the dominant consumption categories.
| Characteristic | Gold | Silver |
|---|---|---|
| Primary demand driver | Monetary/investment | Industrial + monetary |
| Price volatility | Lower | Higher |
| Mid-2026 investor forecast gain | 13.8% | 16.7% |
| Institutional 2026 forecast (Reuters avg) | $4,746 to $4,916/oz | $78 to $79.57/oz |
| Forecast range width (LBMA) | $3,450 to $7,150 | $42 to $165 |
The wider forecast range for silver reflects this complexity. Industrial demand introduces sensitivity to economic growth cycles that gold does not face to the same degree, and any stagflationary scenario where inflation rises while growth stalls would affect silver's industrial demand floor differently from gold's safe-haven premium.
Scenario Analysis: What Would Drive Gold to $5,000 and Beyond?
Scenario 1: Accelerated Monetary Easing
A faster-than-priced rate cut cycle, particularly from the US Federal Reserve, would reduce real yields and weaken the US dollar, historically the two most powerful tailwinds for gold. Under this scenario, gold in a $5,000 to $5,500 per ounce range becomes plausible within the forecast horizon.
Scenario 2: Renewed Geopolitical Escalation
New conflict flashpoints or material escalation of existing geopolitical tensions would likely trigger safe-haven demand across gold and, to a lesser extent, silver. Price targets of $4,800 to $5,200 per ounce under this scenario are within the range of institutional estimates.
Scenario 3: Sovereign Debt Stress
If concerns about fiscal sustainability in major economies intensify, potentially triggering a reassessment of fiat currency credibility, central banks may resume or accelerate reserve diversification into gold. This structural re-rating scenario could push gold well above prior all-time highs over a longer time horizon.
Scenario 4: Stagflation
A simultaneous deterioration in growth and re-acceleration of inflation would historically favour gold strongly, as seen during the 1970s stagflation cycle. Silver's heavier industrial exposure would likely create more volatility in this scenario, with downside risk from weaker manufacturing demand partially offsetting safe-haven support.
How Should Investors Interpret Record-Bullish Sentiment?
Record sentiment readings carry an inherent contrarian risk. When virtually everyone who participates in a market survey is bullish, it raises the question of who is left to buy. Peak bullishness has historically coincided with price peaks in multiple asset classes, and the prior gold all-time high was followed by a correction exceeding 25%.
At the same time, the structural arguments underpinning gold's long-term bull case have not weakened. Sovereign debt expansion, central bank reserve diversification away from the US dollar, and persistent monetary policy uncertainty all provide a fundamental floor that previous gold bull cycles often lacked. In addition, those evaluating their gold investment options should carefully consider how these macro factors align with their individual portfolio strategy and risk tolerance.
The most pragmatic analytical framework treats the current gold and silver price forecast survey data not as a precise price prediction but as a directional signal about investor positioning and the dominant narrative shaping market behaviour. Record bullishness tells us something meaningful about current sentiment; it does not guarantee outcomes.
Risk Disclosure: Survey-based price forecasts reflect the collective sentiment of a specific investor cohort at a specific point in time. Past survey accuracy is no guarantee of future price outcomes. Nothing in this article constitutes investment advice. Readers should consult a qualified financial adviser and consider their individual risk tolerance and portfolio objectives before making any decision regarding precious metals allocation.
Frequently Asked Questions: 2026 Gold and Silver Price Forecasts
What is the current consensus gold price forecast for end-2026?
Institutional surveys from LBMA and Reuters cluster gold in the $4,742 to $4,916 per ounce range for 2026. J.P. Morgan holds a more aggressive view at approximately $6,000 per ounce for Q4 2026. The private investor survey points to a year-end target near $4,665 per ounce.
What is the silver price forecast for 2026?
LBMA and Reuters institutional forecasts place silver in the $78 to $79.57 per ounce range. Private investor surveys project approximately $69.60 per ounce by year-end, while J.P. Morgan forecasts an $81 per ounce average.
Why are private investor silver forecasts lower than institutional estimates?
Retail investors appear to weight monetary and safe-haven drivers more heavily, while institutional analysts incorporate stronger industrial demand growth expectations from solar and EV manufacturing sectors.
Why did gold and silver fall from their all-time highs?
Survey data attributes the correction primarily to profit-taking and capital reallocation, a shift in interest rate expectations, and demand destruction at record price levels among consumers and central banks. Nearly half of current precious metals holders attribute the decline to the consequences of the preceding price peak itself.
What is the biggest risk to the bullish gold outlook?
A faster-than-expected resolution of geopolitical tensions, a hawkish central bank pivot, or a strong risk appetite environment drawing capital away from safe-haven assets could all pressure gold lower.
Is now a good time to invest in gold or silver?
This article does not constitute investment advice. Readers should consult a qualified financial adviser and assess their own circumstances before making any precious metals investment decision.
Key Takeaways from the 2026 Gold and Silver Price Forecast Survey
-
Private investor bullishness on gold and silver has reached its highest recorded level in nearly 12 years of comparable survey data
-
The average retail forecast targets gold at approximately $4,665/oz and silver at approximately $69.60/oz by New Year 2027, implying gains of 13.8% and 16.7% respectively
-
Institutional consensus clusters gold in the $4,742 to $4,916 range, with J.P. Morgan's $6,000 Q4 target representing the bullish institutional outlier
-
Monetary policy (27.7% of respondents) has reclaimed the top driver ranking ahead of geopolitics (21.9%), government debt (14.7%), and physical supply and demand (14.0%)
-
Inflation ranks last among major drivers at just 6.3%, reflecting a fundamental shift in how investors frame gold's portfolio role
-
Nearly half of current precious metals holders attribute the prior correction primarily to demand destruction and profit-taking triggered by the record highs themselves
-
Approximately one in five investors remains bearish, but bears hold roughly 16.5% of investable wealth in precious metals, suggesting hedging rather than directional motivation
-
LBMA forecast ranges spanning $3,450 to $7,150 for gold and $42 to $165 for silver reflect genuine structural uncertainty that no consensus figure can adequately capture
For ongoing coverage of precious metals investor sentiment, price analysis, and market fundamentals, readers can explore research and commentary published at BullionVault's Gold News, which tracks survey data, physical market trends, and price developments across gold, silver, platinum, and palladium.
Want to Capitalise on the Next Major Precious Metals Discovery Before the Broader Market?
Discovery Alert's proprietary Discovery IQ model delivers real-time alerts on significant ASX mineral discoveries — instantly translating complex geological data into actionable investment insights for both short-term traders and long-term investors. Explore historic discoveries and their exceptional market returns, then begin your 14-day free trial to position yourself ahead of the market.