July 24, 2026
The Hidden Flaw in Most Investment Portfolios
Every investment framework rests on assumptions. Some assumptions hold for decades. Others quietly erode beneath the surface until a single market event makes the failure visible to everyone simultaneously. The most consequential assumption in modern portfolio construction is one most investors have never explicitly examined: that stocks and bonds will move in opposite directions when it matters most.
For roughly four decades following the early 1980s, that assumption held. When equities sold off, Treasuries rallied. The inverse relationship was so reliable that entire generations of financial advisers built careers around it. Then 2022 arrived, and both asset classes declined simultaneously in double digits for the first time in modern portfolio history. The S&P 500 fell approximately 19% for the full calendar year. The Bloomberg US Aggregate Bond Index fell more than 13%. A classic 60/40 portfolio had nowhere to hide.
Understanding why that happened, and what it means for how you construct a portfolio today, is where the case for holding gold in a portfolio begins.
When big ASX news breaks, our subscribers know first
Why the 60/40 Framework Struggles in Inflationary Regimes
The engine of the traditional balanced portfolio is correlation. When equities fall and bonds rise, the two positions offset each other, reducing total portfolio drawdown. That negative correlation between stocks and bonds is not a law of markets. It is a regime-dependent relationship that holds under specific macroeconomic conditions and breaks down under others.
Research from the World Gold Council, published in its Why Gold 2026: A Cross-Asset Perspective report (February 2026), identifies the precise threshold at which this relationship historically inverts. When core inflation runs below 2.5%, the data confirms that stocks and bonds tend to move in opposite directions, preserving the diversification logic. When core inflation climbs above 2.5%, the correlation historically turns positive, meaning both assets can and do fall together during stress events.
As of mid-2026, US core PCE inflation remains sticky near 3%, sitting above that critical threshold. A portfolio relying solely on the traditional stock-bond pairing may be more vulnerable than its allocation percentages suggest on paper. Furthermore, the gold and bonds dynamics that many investors assume will always work in their favour are far more regime-dependent than commonly understood.
The Single Assumption That Leaves Portfolios Exposed
What makes this particularly important is that most investors have never stress-tested their portfolio against an inflationary drawdown scenario. The 2008 and 2020 crises were deflationary in nature, meaning bonds and gold both functioned as effective hedges simultaneously. Those two events reinforced confidence in the 60/40 framework even as the underlying conditions that made it work were quietly shifting.
The 2022 shock was different in kind, not just in degree. It demonstrated in real time what quantitative research had long suggested: in inflationary environments driven by aggressive monetary tightening, bonds fail as hedges precisely when investors need protection most.
Key Insight: When core inflation climbs above 2.5%, historical data shows the traditional inverse relationship between equities and bonds has repeatedly broken down, meaning both legs of a conventional balanced portfolio can decline simultaneously during stress events. The 2022 episode was not an anomaly. It was the predictable outcome of a specific macroeconomic regime.
What Gold in a Portfolio Actually Does to Risk-Adjusted Returns
The case for holding gold in a portfolio is frequently misunderstood. It is not primarily a bet on higher gold prices, nor is it a prediction about inflation. It is a mathematical argument about correlation and portfolio efficiency.
The Sharpe ratio is the standard framework for evaluating this. It measures the return an asset or portfolio delivers above the risk-free rate, divided by its volatility. A higher Sharpe ratio means more return per unit of risk accepted. The critical insight is that adding a non-correlated asset to a portfolio does not need to boost returns to improve the Sharpe ratio. It can achieve that improvement purely by reducing portfolio-level volatility.
World Gold Council research using 20 years of USD return data found that adding gold improved a diversified portfolio's Sharpe ratio at every allocation level tested, up to approximately 18%. Even a modest 2.5% gold allocation produced a measurable 12% improvement in Sharpe ratio, according to WGC analysis. A 5% allocation marks the threshold where maximum drawdown reduction also becomes statistically meaningful.
How Near-Zero Correlation Produces This Effect
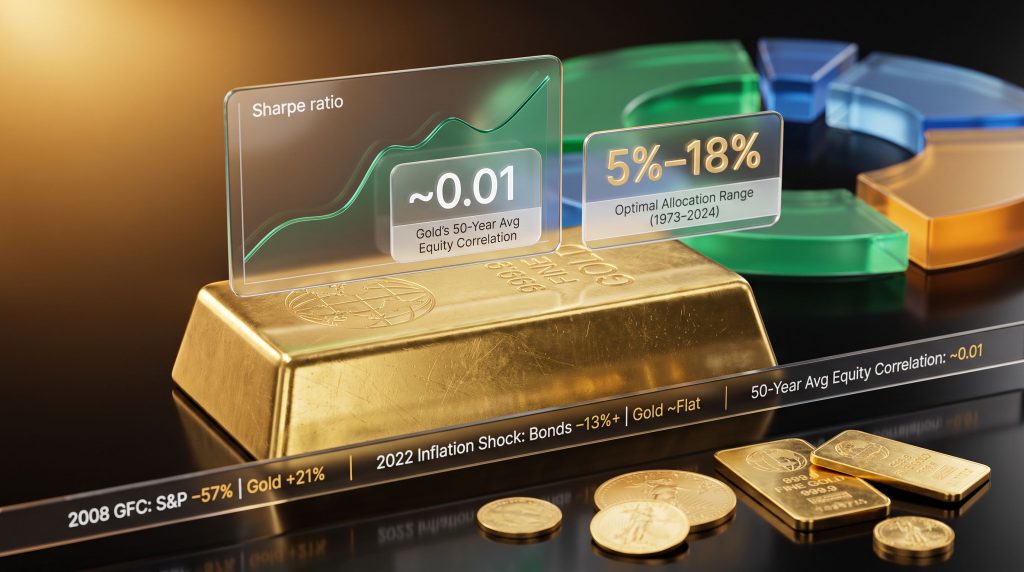
The mechanism is gold's correlation profile. According to D.E. Shaw Group research published in August 2025, gold's correlation with US equities has averaged approximately 0.01 over the past five decades, a figure statistically indistinguishable from zero. More importantly, that near-zero average understates gold's value during the moments that matter most.
World Gold Council data through December 2025 shows that gold's correlation with equities turns negative precisely when equity sell-offs are most severe, including during the 2008 financial crisis, the March 2020 pandemic shock, and the 2025 tariff-driven pullback. Near-zero average correlation is a useful property. Negative correlation during peak stress events is a structurally different and more valuable one.
| Diversifier | Long-Run Equity Correlation | Behaviour During Inflationary Downturns | Income Generation |
|---|---|---|---|
| Gold | ~0.01 (50-year average) | Historically flat to positive | None |
| US Treasuries | Negative (low-inflation regimes) | Turns positive when Fed raises rates | Yes (coupon) |
| Real Estate | Moderate positive | Variable | Yes (rent) |
| Cash | Near zero | Stable but erodes in real terms | Minimal |
How Gold Has Performed During Every Major Crisis Since 2000
The most rigorous test of any portfolio hedge is its behaviour during the events that stress portfolios most severely. World Gold Council researchers examined eleven major market shocks from 2000 through 2025, including the dot-com bust, September 11, the global financial crisis, the European sovereign debt crises, Brexit, the 2020 pandemic sell-off, the 2022 inflation shock, and the 2025 tariff-driven pullback. Across all eleven events, gold either gained or materially cushioned losses when global equities were deeply negative.
Three specific episodes illustrate the regime-dependency that makes gold's crisis performance so instructive. For a broader perspective, gold as a safe haven has been extensively documented across multiple market cycles, reinforcing these historical patterns.
Crisis Type 1: The Deflationary Collapse (2008)
The S&P 500 declined approximately 57% from its October 2007 peak to the March 2009 trough, according to Federal Reserve historical data. Over that same window, gold rose 21% in USD terms, according to World Gold Council data. US Treasuries also performed well. Because the crisis was deflationary in origin, driven by a credit implosion rather than price pressures, both traditional safe havens functioned simultaneously.
Crisis Type 2: The Demand Destruction Shock (March 2020)
Equities fell approximately 34% over six weeks in the initial pandemic sell-off. Gold declined just 3.6% during the same period, according to Bitwise Asset Management analysis. Bonds also held their value. Once again, the deflationary character of the initial shock preserved the 60/40 logic temporarily, and gold provided additional cushioning.
Crisis Type 3: The Inflationary Regime Shock (2022)
This is the scenario that fundamentally altered the portfolio construction conversation. The S&P 500 fell roughly 19% for the full calendar year. The Bloomberg US Aggregate Bond Index declined more than 13%. Both fell simultaneously because the shock was inflationary, not deflationary, and Federal Reserve rate hikes punished bond prices while slowing economic growth at the same time. Gold finished the year approximately flat in dollar terms.
| Crisis Event | Equity Performance | Bond Performance | Gold Performance |
|---|---|---|---|
| Dot-Com Bust (2000–2002) | Severe decline | Positive | Positive |
| Global Financial Crisis (2008–2009) | -57% peak to trough | Positive | +21% |
| Pandemic Sell-Off (March 2020) | -34% over 6 weeks | Stable | -3.6% |
| 2022 Inflation Shock | -19% full year | -13%+ full year | ~Flat |
| 2025 Tariff-Driven Pullback | Negative | Variable | Cushioned losses |
Sources: World Gold Council crisis analysis covering 2000–2025; Federal Reserve historical data
Critical Distinction: In deflationary downturns, bonds and gold both absorb losses effectively. In inflationary downturns driven by aggressive rate tightening, bonds fail as a hedge precisely when investors need protection most. Gold's 2022 performance demonstrated this structural difference in real time.
What Quantitative Research Says About Optimal Gold Allocation
Multiple independent research efforts have now converged on a consistent finding: most investors hold far less gold than the data supports, and the gap between recommended and actual allocation is substantial.
Flexible Plan Investments, a quantitative investment research firm, published a 51-year backtest in October 2025 covering portfolio constructions from 1973 through 2024. Their analysis found that the mathematically optimal gold allocation, the level that produced the highest Sharpe ratio across the full period, was approximately 18%. The Sharpe ratio improvement was measurable at every allocation level up to roughly 35%.
The World Gold Council's Monte Carlo simulation of 10,000 portfolios using monthly return data from January 2000 through May 2025 arrived at a compatible finding through a different methodology: higher Sharpe ratio portfolios consistently held gold in the 5% to 15% range.
LSEG research from 2025 found that a 60/20/20 portfolio (60% equities, 20% gold, 20% bonds) began outperforming the traditional 60/40 around the onset of the COVID pandemic, with the advantage becoming most pronounced in 2022 when stocks and bonds moved in the same direction simultaneously.
| Research Source | Methodology | Recommended Range | Key Finding |
|---|---|---|---|
| World Gold Council | 20-year USD return data | 5%–15% | 5% is minimum threshold for measurable Sharpe improvement |
| Flexible Plan Investments | 51-year backtest (1973–2024) | ~18% optimal | Highest Sharpe ratio across full period at 18% allocation |
| World Gold Council Monte Carlo | 10,000 simulated portfolios (Jan 2000–May 2025) | 5%–15% | Higher-Sharpe portfolios consistently held gold in this range |
| LSEG / FTSE Russell | 60/20/20 portfolio modelling | ~20% | Outperformed 60/40 from COVID onset; advantage peaked in 2022 |
| Morningstar Framework | Strategic allocation guidance | Up to 15% | Recommends keeping gold exposure limited to 15% or less |
| General Institutional Consensus | Various | 2%–10% | 5%–6% commonly cited for balanced portfolios |
The Allocation Gap That the Data Reveals
Despite this research consensus, actual holdings remain far below recommended levels. JPMorgan estimates that investors currently hold approximately 2.8% of assets under management in gold. Bank of America research found that professional and high-net-worth investors hold under 1% of assets in gold, even as gold has risen more than 70% since 2022 and represents approximately 4% of the total global financial asset pool.
According to Morningstar's analysis of gold in investor portfolios, this persistent underweight reflects behavioural biases and familiarity with traditional asset classes rather than a rational assessment of portfolio efficiency.
Data Point: The gap between what institutional research recommends and what most investors actually hold is not marginal. It represents a structural underweight that has persisted even through a multi-year gold bull market, suggesting that rising prices alone are not driving meaningful reallocation.
Gold's Long-Run Purchasing Power Record
Portfolio protection has two distinct dimensions. The first is drawdown management, limiting losses during acute market events. The second is purchasing power preservation across long monetary cycles, protecting the real value of savings even when no dramatic crisis occurs.
Gold's record on the second dimension stretches back more than 50 years and is grounded in a supply constraint that monetary policy cannot replicate. According to World Gold Council data through 2025, gold mine supply grows at less than 1% per year on average, a rate far below the pace at which central banks and governments have expanded money supplies during periods of fiscal stimulus. Fiat currencies can be created by policy decision. Gold cannot.
This supply inelasticity becomes most visible during sustained inflationary periods. Indeed, the inflation hedge characteristics of gold are most powerfully expressed when monetary policy fails to contain rising prices over extended cycles:
- Gold's average annual return when inflation exceeded 3%: approximately 15%
- Gold's average annual return when inflation ran below 3%: approximately 6%
- Gold price when Nixon closed the gold window in 1971: $35 per ounce
- Gold price at the January 1980 peak during peak stagflation: $850 per ounce, a gain exceeding 2,300%
- Annual gold mine supply growth: less than 1% on average, consistently below the rate of monetary expansion during fiscal stimulus periods
Why Short-Term Hedging and Long-Term Preservation Are Different Concepts
An important distinction separates gold's short-term inflation sensitivity from its long-run purchasing power function. In 2022, gold was approximately flat despite high nominal inflation, because the Federal Reserve's aggressive rate increases pushed real yields from deeply negative territory to above 2%, creating a meaningful opportunity cost for holding a non-yielding asset.
The inflation hedging function operates most powerfully when monetary policy cannot contain price pressures and real yields remain structurally negative. In a single rate-tightening cycle, the short-term dynamics can suppress gold's nominal performance even as the long-run purchasing power case remains intact.
The next major ASX story will hit our subscribers first
The Real Risks of Holding Gold in a Portfolio
A complete evaluation of gold in a portfolio requires examining the risks alongside the benefits. Three specific risks deserve direct attention.
Risk 1: Opportunity Cost When Real Yields Are Positive
Gold generates no income. It pays no dividend, no coupon, and no rent. When real yields on risk-free assets are positive, holding gold carries a measurable opportunity cost. This is the primary mechanism by which the 2022 rate cycle suppressed gold's near-term performance despite elevated nominal inflation.
Risk 2: Standalone Volatility That Rivals Equities
- Gold's historical annualised volatility range: 12%–18%, comparable to large-cap equities in many periods
- The 2011 to 2015 drawdown from the September 2011 peak of $1,921: approximately 44%
- Gold's maximum historical peak-to-trough drawdown across the full research period: approximately 61.8%
Risk 3: Entry-Point Sensitivity
Investors who buy gold at cyclical peaks can face extended multi-year recovery periods before regaining their initial value. This risk is particularly relevant for investors with short time horizons who treat gold as a short-term trade rather than a structural portfolio position.
Warning: Gold's standalone risk profile is meaningful. It is not a low-volatility asset in isolation. Its portfolio value derives from three structural properties: near-zero average equity correlation, negative correlation during sharp sell-offs, and long-run purchasing power preservation. These properties function independently of any particular price level and do not require a bullish directional view on gold to be valid.
Physical Gold vs. Paper Gold: Why the Distinction Matters for Portfolio Protection
Most of the quantitative research discussed here uses gold's spot price as a proxy for gold exposure. Over time, physical gold vs ETFs and other paper instruments all reference the same underlying price. The meaningful difference between these ownership forms is not performance. It is counterparty risk.
| Ownership Form | Spot Price Exposure | Counterparty Risk | Liquidity | Storage Requirement |
|---|---|---|---|---|
| Physical bullion (home storage) | Direct | None | Moderate | Yes |
| Allocated vault storage (audited) | Direct | Minimal | High | No |
| Gold ETF (spot-backed) | Direct | Fund/custodian | High | No |
| Gold futures | Leveraged/synthetic | Exchange/broker | High | No |
| Allocated certificates | Direct | Custodian | Moderate | No |
During the March 2020 pandemic shock, demand for physical coins and bars overwhelmed retail supply for several weeks, even as the spot price temporarily declined. This divergence between paper and physical markets highlighted a distinction that becomes most consequential precisely in extreme stress scenarios, which are the exact environments where portfolio hedges are most needed. Physically held gold in fully allocated, audited storage carries no issuer risk, no fund redemption risk, and no broker dependency.
How to Assess Whether Your Portfolio Is Structurally Exposed
Evaluating portfolio vulnerability does not require a financial model. It requires four specific diagnostic questions.
-
What is your stock-bond correlation exposure? If your portfolio is predominantly equities and US Treasuries, you are relying on a correlation that has historically inverted during inflationary regimes. World Gold Council and LSEG research both confirm that when core inflation runs above 2.5%, that correlation has turned positive in historical data.
-
What is your maximum single-event drawdown tolerance? Analysis from multiple research providers indicates that a 15% gold allocation alongside equities and bonds has historically reduced maximum drawdown by 10 to 15 percentage points compared to gold-free equivalents.
-
What is your time horizon and withdrawal proximity? Gold's stabilising function becomes more critical as a portfolio approaches the distribution phase. A 62-year-old nearing retirement has meaningfully less capacity to absorb a multi-year equity drawdown than an investor in the early accumulation phase.
-
What percentage of your portfolio is currently allocated to gold? Under 5% sits below the research-identified threshold for measurable Sharpe improvement. At 0%, the portfolio is fully exposed to simultaneous stock-bond drawdowns in inflationary regimes, the scenario that 2022 demonstrated in real time.
A Simple Allocation Framework by Investor Risk Profile
| Investor Profile | Suggested Gold Range | Primary Rationale |
|---|---|---|
| Conservative (near retirement) | 10%–15% | Drawdown protection prioritised over growth |
| Balanced (mid-accumulation) | 5%–10% | Sharpe ratio improvement and diversification |
| Growth-oriented (long horizon) | 2%–5% | Tail-risk insurance with minimal drag on equity upside |
| Institutional (elevated macro stress) | 10%–20% | Research-backed range for high-stress macro environments |
Note: These ranges reflect general research findings from multiple institutional sources and are not financial advice. Individual circumstances, tax treatment, and investment objectives should be assessed with a qualified financial adviser.
Frequently Asked Questions: Gold in a Portfolio
What is the primary risk of adding gold to an investment portfolio?
Gold carries annualised volatility of 12%–18% historically, comparable to large-cap equities, and generates no income, creating an opportunity cost when real yields are positive. In isolation, gold is not a low-risk asset. Within a diversified portfolio, however, its near-zero equity correlation has historically reduced overall portfolio volatility and improved risk-adjusted returns.
How does gold improve a portfolio's Sharpe ratio?
Because gold's correlation with equities averages near zero over long periods and turns negative during sharp market sell-offs, adding gold reduces portfolio-level volatility without proportionally reducing return. This improves the ratio of return per unit of risk, which is what the Sharpe ratio measures.
What gold allocation does institutional research support?
Research findings range from 5% (the World Gold Council's threshold for measurable Sharpe improvement) to approximately 18% (the mathematically optimal allocation identified in a 51-year backtest by Flexible Plan Investments). Most institutional guidance for portfolios navigating elevated macro uncertainty falls between 10% and 15%. Conservative strategic frameworks such as Morningstar's cap the recommendation at 15%.
Why did gold underperform during the high-inflation period of 2022?
Gold's inflation sensitivity is primarily driven by real yields, not nominal inflation rates. In 2022, aggressive Federal Reserve rate increases pushed real yields from deeply negative territory to above 2%, creating a significant opportunity cost for holding a non-yielding asset. Gold's purchasing power preservation function operates most effectively when monetary policy cannot prevent real yields from remaining structurally negative.
Is physical gold safer than a gold ETF for portfolio protection purposes?
Both formats track the same underlying spot price over time. The distinction is counterparty risk. Physically held gold in fully allocated, audited storage carries no issuer risk, no fund redemption risk, and no broker dependency. Gold ETFs and other paper instruments introduce varying levels of intermediary exposure, a difference that becomes most relevant in the extreme stress scenarios where portfolio hedges are most needed.
Does gold protect against all types of market downturns?
No. Gold's crisis performance is regime-dependent. In deflationary downturns such as 2008 and March 2020, both gold and bonds have historically functioned as effective hedges simultaneously. In inflationary downturns such as 2022, bonds have failed as hedges while gold has remained approximately flat, filling the gap bonds could not cover. Gold's protective properties are strongest when inflationary conditions prevent bonds from performing their traditional defensive role.
The Structural Case: What 50 Years of Data Concludes About Gold in a Portfolio
The argument for holding gold in a portfolio is not built on a forecast. It does not require a view on the direction of gold prices, the trajectory of inflation, or the path of monetary policy. It is built on three durable structural properties that have remained consistent across five decades of data.
First, gold's near-zero long-run correlation with equities means it does not move in lockstep with the rest of a diversified portfolio. Second, that correlation turns negative during the most severe equity sell-offs, providing the asymmetric protection that matters most for drawdown management. Third, across long monetary cycles, gold has preserved purchasing power in a way that no fiat currency has replicated since the Bretton Woods system collapsed in 1971.
The strategic role of gold within a diversified allocation is consequently well-supported by independent institutional research spanning multiple decades and methodologies. Furthermore, VanEck's research on gold's role in portfolio allocation reinforces this conclusion, noting that the diversification benefits are most pronounced during the market environments that cause the greatest damage to conventional balanced portfolios.
Combined with the persistent and substantial gap between what institutional research recommends and what most investors actually hold, this framework points to a straightforward conclusion. The question is not whether gold belongs in a portfolio. The question is whether the portfolio you hold today is structured to absorb the scenarios that have already occurred.
Disclaimer: This article is for informational and educational purposes only and does not constitute financial or investment advice. All investment decisions should be made in consultation with a qualified financial adviser. Past performance is not indicative of future results. All statistics and research findings cited are sourced from publicly available institutional research including World Gold Council, Flexible Plan Investments, D.E. Shaw Group, JPMorgan Asset Management, Bank of America, LSEG, and Bitwise Asset Management.
Want to Identify the Next Major Mineral Discovery Before the Broader Market Does?
While portfolio construction and asset allocation form the foundation of long-term wealth, some of the most significant wealth-creation events in history have come from being positioned early in a transformative mineral discovery — Discovery Alert's proprietary Discovery IQ model scans ASX announcements in real time, delivering instant alerts on high-potential discoveries across more than 30 commodities, so subscribers can act before the broader market catches on. Explore historic discovery returns to understand the scale of opportunity these events can generate, and begin a 14-day free trial to secure a genuine market-leading edge.