July 2, 2026
The Structural Forces Reshaping Precious Metals Markets in 2026
Throughout history, precious metals have served as barometers of monetary stress, geopolitical anxiety, and investor confidence. Every major bull cycle in gold and silver has been preceded by a period of confusion, where short-term price dislocations masked the deeper structural forces accumulating beneath the surface. The current environment is no different, and arguably more complex than any preceding cycle.
What makes 2026 particularly unusual is the combination of extreme volatility and a simultaneously intact long-term thesis. Year-to-date, gold has surged approximately 46% on a rolling basis while silver has delivered gains exceeding 106%, yet both metals experienced violent mid-year corrections following unexpected hawkish signals from the Federal Reserve. This is not a contradiction. It is the defining characteristic of a market navigating between short-term monetary policy shocks and long-term monetary debasement.
Understanding gold and silver price projections requires separating the noise of near-term chart patterns from the signal of decade-long structural forces. Both perspectives are examined in detail below.
When big ASX news breaks, our subscribers know first
Gold and Silver Price Projections: The Institutional View
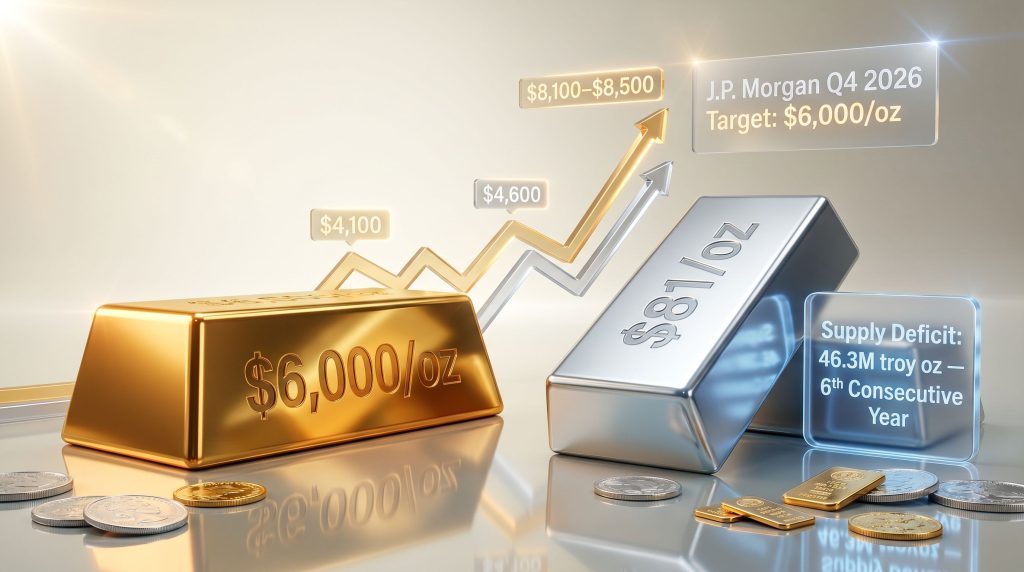
J.P. Morgan's Quarterly Gold Price Roadmap
Among institutional forecasters, J.P. Morgan has published some of the most specific and aggressive gold price projections for 2026. Their quarterly breakdown provides a clear picture of expected trajectory:
| Quarter | J.P. Morgan Gold Price Target |
|---|---|
| Q1 2026 | $4,873/oz |
| Q2 2026 | $4,800/oz |
| Q3 2026 | $5,300/oz |
| Q4 2026 | $6,000/oz |
| End of 2027 | $6,300/oz |
The pattern implies a sharp recovery and acceleration through the second half of 2026. A Q4 target of $6,000/oz would represent a gain of roughly 50% from current mid-year levels near $4,000/oz, making it one of the most bullish institutional forecasts on record.
AI Model Consensus vs. Institutional Projections
AI-aggregated forecasting models, including outputs from ChatGPT-4, Gemini, and Perplexity, collectively projected a $4,249 to $4,790/oz range for gold in April 2026, with an aggregated consensus average of approximately $4,724/oz. While these models capture near-term momentum effectively, they tend to anchor on recent price action rather than the deeper structural macro drivers that inform institutional forecasting desks.
The divergence between AI consensus and J.P. Morgan's outlook is instructive. It reflects a fundamental tension in metals analysis between trend-following quantitative models and macro-driven conviction calls. The precious metals market analysis landscape, furthermore, continues to evolve rapidly as new data points emerge throughout the year.
Extreme Outlier Forecasts
At the far end of the conviction spectrum, certain high-profile macro commentators have floated gold price targets as aggressive as $35,000/oz, citing the possibility of systemic financial disruption and accelerating sovereign debt monetisation. These views remain firmly outside mainstream consensus but reflect the tail-risk scenario that structural gold bulls are positioning against, even if partially.
These outlier forecasts should be treated as scenario planning tools rather than base-case projections. They illustrate the theoretical upside under extreme monetary disorder rather than the expected outcome under current conditions.
Technical Analysis of Gold: Critical Levels Every Investor Should Know
The Fibonacci Framework and Gold's Near-Term Risk
Technical analysis of gold's current price structure reveals a market at a genuinely critical juncture. Gold is presently testing its Fibonacci 61.8% retracement level, located near $4,100/oz. Known in trading circles as the "golden ratio," this level is where assets frequently find temporary support or resistance based on mathematical relationships observed consistently across financial markets and natural systems alike.
The critical insight from current chart analysis is that gold has already tagged this level and is showing signs of losing traction around it. The structure is not one of confident support, but rather a market clinging to a level while shorter-term trend momentum continues to point lower.
If the $4,100/oz level gives way decisively, Fibonacci theory projects the next meaningful support at the 100% measured move of the prior decline, targeting approximately $3,600/oz. This move, if it occurs, is expected to be rapid and short-lived rather than a grinding multi-week decline. The gold price forecast narrative, however, remains intact from a structural perspective even if this near-term correction materialises.
Key technical levels to monitor:
| Scenario | Key Price Level | Implication |
|---|---|---|
| 61.8% Fibonacci support holds | ~$4,100/oz | Base-building phase may begin |
| 61.8% level breaks to downside | ~$3,600/oz | Sharp but brief capitulation likely |
| Bullish breakout confirmation | ~$4,600/oz | Trend reversal from lower highs to higher highs |
| Super-cycle long-term target | ~$8,100–$8,500/oz | Full bull market extension scenario |
What a Washout to $3,600 Actually Means for Long-Term Investors
A critical distinction that separates experienced precious metals investors from reactive traders is the ability to contextualise a sharp drawdown within a longer structural framework. A decline to $3,600/oz would not invalidate the long-term bull case for gold. In fact, it would mathematically increase the percentage upside to the $8,000 super-cycle target by approximately 30% compared to entering at current levels.
Furthermore, the nature of such a move matters enormously. Technical analysis of the current setup suggests that a washout to $3,600 would likely be triggered by a margin call event, perhaps tied to a sudden equity market dislocation, creating a spike low characterised by high volume, a long lower wick on the candlestick chart, and an almost immediate sharp rebound. This type of price action has occurred multiple times within the current precious metals bull cycle.
Investors who recognise this pattern in advance and maintain liquidity to deploy at that level may be accessing one of the most asymmetric entry points of this cycle. The challenge is psychological: the macro news environment at the moment of a washout low will feel maximally bearish.
Confirming a Gold Bull Trend Resumption
For investors monitoring recovery signals rather than washout lows, the critical technical trigger is what analysts describe as an impulse move through two prior resistance levels. In practice, this means gold would need to climb to approximately $4,600/oz with strong momentum, breaking through at least two identifiable overhead resistance levels established during the prior decline.
When an asset breaks through two resistance ceilings with conviction, the first subsequent pause and pullback typically represents an accumulation opportunity before the next major leg higher. Once gold establishes that pattern, the weekly chart super-cycle analysis points toward a blowoff phase target of $8,100 to $8,500/oz.
This projection is derived from measuring the amplitude of the prior major market cycle originating from the 2014 to 2015 lows, then projecting an equivalent move from the current base. The gold and bond dynamics of the current cycle, moreover, suggest that any sustained rise in real yields would be a temporary headwind rather than a structural threat to the bull case.
For perspective on why $8,000/oz is not an outlandish projection over a five-year horizon: gold has progressed from approximately $1,000/oz to $2,000/oz to over $5,000/oz over the past decade, each leg supported by expanding sovereign debt and accelerating global money supply growth. The structural conditions driving those moves have not reversed; they have intensified.
Silver Price Projections 2026: Institutional Forecasts and Structural Deficits
Where Analysts Expect Silver to Trade
Silver's gold and silver price projections landscape for 2026 reflects both significant institutional optimism and extraordinary volatility risk. The spread across forecasting sources is wide, capturing both a structural supply story and an extremely reactive short-term market:
| Source | Silver Price Projection |
|---|---|
| J.P. Morgan | $81/troy oz (2026 average) |
| Reuters Analyst Poll (February 2026) | $79.50/troy oz |
| AI Model Consensus (April 2026) | $75.75/oz average ($47–$57 range) |
| APMEX Analyst Estimate | $60–$100/oz range; $70–$90 most likely |
| Long-term (2030) | $100–$140/oz |
One of the more striking data points in the silver forecast landscape is the pace of upward revision. The Reuters analyst poll silver forecast moved from $50/oz in October 2025 to $79.50/oz by February 2026, a near-60% upward revision in under five months. This dramatic shift reflects how quickly the structural supply narrative gained credibility within mainstream institutional analysis.
The Six-Year Supply Deficit That Institutional Analysts Are Finally Pricing In
The Silver Institute has confirmed a supply deficit of 46.3 million troy ounces in 2026, marking the sixth consecutive year of structural undersupply in the global silver market. This is a foundational data point that underpins virtually every bullish institutional silver thesis. Consequently, the silver supply deficits story has become increasingly difficult for mainstream analysts to overlook.
What makes this deficit particularly significant for long-term investors is its self-reinforcing nature. New silver mining supply takes seven to ten years to bring online from discovery through development and production. This means even if metal prices incentivise significant new exploration and capital allocation today, the market cannot correct the supply imbalance for nearly a decade.
Industrial demand is accelerating simultaneously across multiple growth sectors:
- Solar photovoltaic panels require silver in their conductive pastes, with demand expanding as global renewable energy capacity grows rapidly
- Electric vehicle batteries and charging infrastructure are consuming silver at scale, with no near-term substitution technology available
- Advanced electronics and semiconductor applications continue to absorb silver due to its unmatched electrical conductivity
- Medical and antimicrobial applications represent a smaller but steadily growing demand category
This combination of a multi-year supply deficit and accelerating industrial consumption creates what analysts describe as a structurally bullish demand backdrop that is largely independent of speculative or monetary investment demand.
Silver's Technical Setup: Violent Volatility as Opportunity
Silver's technical structure mirrors gold's in many respects but with amplified volatility. The metal has already broken below key breakout support levels that held during the late-2025 rally, and Fibonacci analysis of the current decline projects a potential washout low near $40/oz.
This $40 level would represent a breach of the psychologically significant $50 threshold, likely triggering forced liquidation across leveraged positions and derivatives markets. In a scenario involving a global equity selloff and cross-asset margin calls, silver's high beta characteristics relative to gold mean it would absorb a disproportionate share of forced selling.
However, the critical insight from technical analysis is that this type of move is expected to be extremely brief, potentially lasting only minutes to hours before a sharp rebound. The chart pattern suggests a large downward move followed by an almost immediate recovery toward the $60/oz range, creating a spike low that, in retrospect, would be visible on charts as a classic capitulation event.
Silver's 106% year-to-date volatility is a double-edged characteristic. The same momentum dynamics that produce violent selloffs also drive explosive recoveries. Investors with physical purchasing capacity at the $40 level, should it materialise, may be accessing a generationally significant entry point.
Equity Markets, Capital Rotation, and the Precious Metals Connection
What the NASDAQ's Technical Setup Tells Precious Metals Investors
The QQQ NASDAQ ETF is exhibiting what technical analysts describe as a bifurcated setup, with approximately equal probability of a 20% upside move toward $879 or a 7 to 10% correction toward the $650 to $675 range if recent support levels are breached.
What makes this equity market analysis relevant to precious metals positioning is the nature of the internal market dynamics. Capital is rotating erratically between:
- Mega-cap technology stocks
- Small-cap and micro-cap growth plays
- Dividend and utility stocks as defensive allocations
- Momentum-driven speculative positions
This pattern of rapid intraday and interday rotation between asset classes is historically associated with late-stage bull market distribution phases, where large institutional holders systematically reduce exposure while retail demand absorbs selling pressure. The market exhibits resilience at each dip precisely because each dip attracts fresh buying, yet distribution selling continues in the background.
Understanding the Cross-Asset Margin Call Mechanism
For precious metals investors, the equity market matters primarily through the mechanism of cross-asset margin calls. When equity markets experience a sudden, disorderly decline, leveraged investors across multiple asset classes are simultaneously forced to liquidate positions to meet margin requirements. Gold and silver, as highly liquid assets held in many institutional portfolios, often get sold indiscriminately during these events, creating the spike low patterns discussed in the technical analysis sections above.
Crucially, these margin-call-driven selloffs are structurally different from fundamental selling. They represent forced liquidation rather than a change in conviction, which is why recoveries tend to be sharp and rapid once the liquidation wave exhausts itself.
In a sustained long-term equity bull market, attempting to profit from short-term corrections through inverse products is historically a low-probability strategy. The same principle applies directly to precious metals: short-term weakness within a structural uptrend is more productively treated as an accumulation opportunity than a signal to reduce exposure.
The Long-Term Case: Gold and Silver Price Projections Through 2030
Monetary Expansion as the Enduring Structural Driver
Beyond quarterly forecasts and Fibonacci levels, the most durable long-term driver for gold and silver prices is straightforward: global money supply is expanding, sovereign debt levels are increasing, and the purchasing power of fiat currencies is being systematically diluted. These are not cyclical phenomena. They are structural features of the current global monetary architecture.
J.P. Morgan's institutional trajectory extends to $6,300/oz by end of 2027, while super-cycle technical analysis projects a blowoff phase target of $8,100 to $8,500/oz for gold. The historical progression from $1,000/oz to $2,000/oz to $5,000/oz over the past decade, each move supported by equivalent monetary expansion, provides a mathematically consistent framework for projecting $8,000/oz within the next five years.
Silver's Decade-Long Industrial Transformation
Silver occupies a unique position among investment assets because of its dual identity as both a monetary metal and an essential industrial commodity. The gold-silver ratio analysis further reinforces the case that silver remains historically undervalued relative to gold at current prices. Analyst projections place silver at $100/oz by 2030, with more aggressive forecasts targeting $140/oz as above-ground stockpiles are progressively consumed by industrial demand.
According to long-range silver price analysis, the six-year structural supply deficit, combined with a seven-to-ten-year lead time for new mining supply, means the market is unlikely to achieve balance within this decade. This supply-demand asymmetry provides a fundamental price floor that exists independently of investor sentiment or monetary policy direction.
The next major ASX story will hit our subscribers first
FAQ: Gold and Silver Price Projections 2026
What is the gold price forecast for the end of 2026?
J.P. Morgan projects gold will reach $6,000/oz by Q4 2026, rising further to $6,300/oz by end of 2027. AI model consensus is more conservative, averaging around $4,724/oz for the near term.
What is the silver price forecast for 2026?
Institutional forecasts place silver at $79.50 to $81/oz for 2026. Analyst trading ranges suggest the most active price zone will be between $70 and $90/oz, with extreme scenarios ranging from $40 during a washout event to over $100.
Why is silver in a supply deficit?
The Silver Institute reports a 46.3 million troy ounce deficit in 2026, the sixth consecutive year of undersupply, driven by surging industrial demand from solar panels, EV batteries, and advanced electronics outpacing mining production.
What technical level should gold investors watch most closely?
The $4,100/oz Fibonacci 61.8% retracement level is the critical near-term threshold. A sustained break below this level targets $3,600/oz. A recovery above $4,600/oz with strong momentum would signal a bullish trend reversal.
Could gold realistically reach $8,000/oz?
Based on super-cycle technical analysis and the historical pace of monetary expansion, $8,100 to $8,500/oz is a plausible long-term target within a five-year horizon. This represents a mathematically consistent extension of existing debt and money supply trends rather than a fringe forecast.
What could cause a sharp short-term drop in silver prices?
A global equity market selloff triggering cross-asset margin calls is the most likely catalyst for a rapid silver decline toward $40/oz. Technical analysis suggests such moves would be extremely short-lived, measured in hours rather than days.
Key Takeaways for Precious Metals Investors Entering H2 2026
- Gold's near-term technical risk centres on the $4,100/oz Fibonacci support level. A break below targets $3,600/oz in a rapid washout, not a structural reversal
- The $3,600 washout scenario, if it occurs, actually improves the percentage upside to the super-cycle target by approximately 30% compared to current entry levels
- Silver's structural deficit of 46.3 million troy ounces annually provides fundamental price support well above current levels over any 12 to 24 month horizon
- Institutional consensus from J.P. Morgan and Reuters analyst polls remains firmly bullish on both metals for the second half of 2026 and beyond
- Technical confirmation of a new bull leg requires gold to clear $4,600/oz on strong momentum and silver to reclaim and hold above $50/oz
- Cross-asset margin calls driven by equity market dislocations represent the primary catalyst for spike lows in precious metals, and historically the most significant accumulation opportunities
- Long-term monetary expansion, accelerating industrial silver demand, and persistent supply deficits remain the three most durable structural tailwinds for gold and silver price projections over the remainder of this decade
Disclaimer: This article is intended for informational and educational purposes only and does not constitute financial advice. All price forecasts, technical analysis projections, and institutional targets referenced are speculative in nature and subject to change. Past performance of any asset class is not indicative of future results. Readers should conduct their own due diligence and consult a licensed financial adviser before making any investment decisions.
Want to Capitalise on the Next Major Mineral Discovery Before the Broader Market?
While gold and silver price projections dominate macro headlines, the most asymmetric returns in precious metals often originate at the exploration and discovery stage — and Discovery Alert's proprietary Discovery IQ model delivers real-time ASX alerts the moment significant mineral discoveries are announced, transforming complex data into actionable opportunities for investors at every experience level. Explore historic discovery returns on Discovery Alert's dedicated discoveries page and begin a 14-day free trial to position ahead of the market.