
June 18, 2026
The Ratio That Tells You Where Silver Stands in Every Market Cycle
Precious metals markets have a long history of generating signal from noise. Most investors spend their time tracking price levels, but the traders and analysts who consistently position ahead of major moves tend to focus instead on relationships between assets. The gold-silver ratio analysis is one of the oldest and most analytically rich of those relationships, and in mid-2026, with the ratio sitting at approximately 64:1, it is generating a reading that deserves careful interpretation rather than reflexive action.
Understanding what the gold silver ratio at 64 signals for silver requires separating three distinct layers of analysis: what the ratio actually measures, where 64 falls in the historical distribution of readings, and what structural forces are operating beneath the surface of current price movements.
When big ASX news breaks, our subscribers know first
What the Gold-Silver Ratio Actually Measures
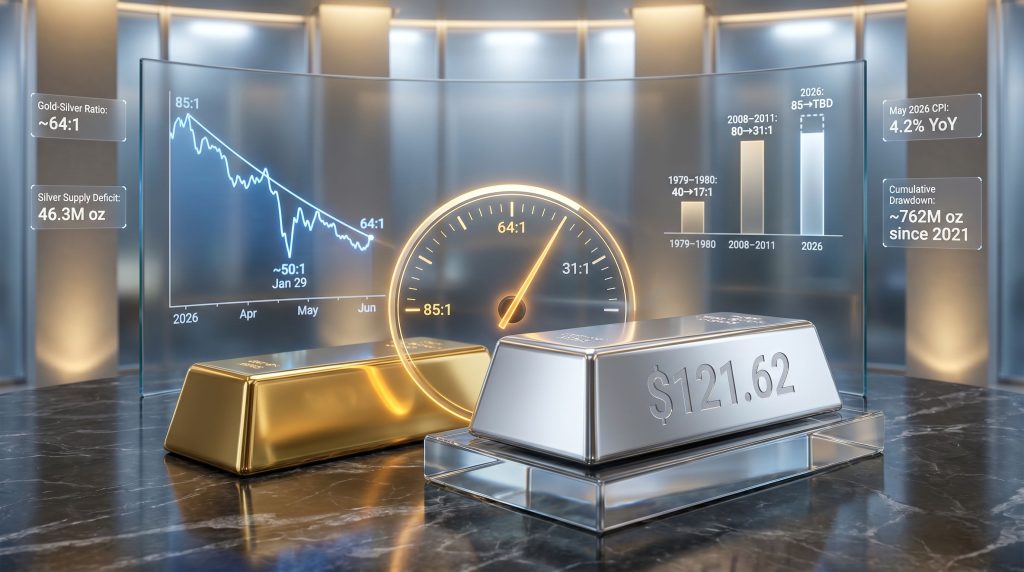
The ratio is calculated by dividing the gold spot price by the silver spot price. At mid-June 2026 prices, with gold trading near $4,227 per ounce and silver near $66.16 per ounce, the result is approximately 64. That figure represents how many ounces of silver would be required to purchase a single ounce of gold at prevailing market prices.
What the ratio does not measure is equally important to understand. It says nothing about whether either metal is cheap or expensive in absolute terms. A ratio of 64:1 with gold at $4,227 represents an entirely different investment environment than 64:1 with gold at $1,200. The ratio is a relative value instrument, not an absolute price signal.
The 50-year historical average for the ratio sits in the range of approximately 65 to 70:1 (MacroTrends). At 64, the current reading places silver near its long-run average relative to gold, not at a historically extreme undervaluation. Furthermore, why the ratio matters for positioning decisions becomes especially clear when this broader context is applied.
The widely referenced 80/50 framework provides a practical orientation grid for interpreting ratio readings:
| Ratio Level | Historical Signal | Typical Analytical Posture |
|---|---|---|
| Above 80:1 | Silver deeply undervalued vs. gold | Silver accumulation favoured |
| 65–80:1 | Silver moderately undervalued | Neutral-to-silver constructive |
| 50–65:1 | Approaching historical average | Monitor; await directional confirmation |
| Below 50:1 | Silver richly valued vs. gold | Gold or profit-taking considerations |
At 64:1, the ratio sits at the lower boundary of the neutral-to-constructive zone. The strongest accumulation signal from this framework occurred earlier in 2026, when the ratio exceeded 85:1. Investors who acted at that threshold have already captured meaningful compression. Those evaluating the ratio at current levels are entering at a structurally more neutral relative valuation.
How the Ratio Moved from 85 to 64 in Five Weeks
The compression trajectory in 2026 has been one of the sharpest in recent precious metals history. The sequence ran approximately as follows: the ratio compressed to roughly 50:1 on January 29, 2026, when silver reached its all-time high of $121.62 per ounce (Silver Institute). That was followed by a dramatic reversal, with silver falling approximately 30% in a single session on January 30, 2026, its worst single-day decline since 1980 (CNBC, January 30, 2026). The ratio subsequently blew out to approximately 85:1.
From that elevated starting point, two macro forces drove the compression back toward current levels.
Force 1: Real yield dynamics. A US-Iran memorandum of understanding signed on June 17, 2026, triggered a sharp decline in oil prices. Lower oil feeds directly into reduced inflation expectations, which in turn compresses real yields. Silver, which produces no yield, becomes less costly to hold relative to yield-bearing alternatives when real yields fall. This mechanical chain is the primary transmission mechanism connecting geopolitical developments to precious metals valuations.
Force 2: Extreme positioning unwind. At 85:1, bearish silver positioning had been priced to near-maximum pessimism. Markets rarely sustain readings at historical extremes for extended periods. Mean-reversion mechanics are a structural force that operates independently of any single catalyst, and ratio markets have a consistent tendency to overshoot in both directions during the reversion process.
The June 17, 2026 FOMC outcome then partially reversed this compression. With nine of 18 FOMC members projecting a rate hike by year-end (Fox Business, June 17, 2026) and easing language removed from the statement, gold fell more than 2% and silver declined approximately 3%. The ratio moved from 61.1 to approximately 64 over two sessions. Notably, that response was a fraction of the January shock, suggesting the structural floor for silver has shifted materially upward since the original volatility event.
Three Historical Compression Cycles and What 2026 Does Differently
Historical cycle analysis provides reference points without offering timing guarantees. Three prior compression episodes are most instructive:
| Cycle | Starting Ratio | Trough Ratio | Duration | Primary Driver |
|---|---|---|---|---|
| 1979–1980 | ~40:1 | 17:1 | ~12 months | Monetary stress and speculative concentration |
| 2008–2011 | ~80:1 | ~31:1 | ~30 months | Post-crisis QE and safe-haven demand |
| 2026 (in progress) | 85:1 | TBD | TBD | Monetary + structural industrial demand |
The 1980 episode was driven primarily by stagflation, dollar weakness, and a concentrated speculative position that amplified the final compression phase to extremes that proved unsustainable. The 2011 cycle was predominantly monetary in character, as post-financial-crisis quantitative easing drove both metals higher, with silver's leverage to monetary conditions producing sharper relative gains. That compression took approximately 30 months from trough to peak.
The 2026 cycle differs from both predecessors in a structurally significant way. The ratio hit 85:1 during an active bull market correction, not at a peak. That means the compression starting point sits roughly 22 points higher than where the 2011 cycle began. If historical patterns provide any guidance, this implies a correspondingly wider potential ceiling for silver's relative outperformance before the cycle exhausts itself. For a deeper understanding of these dynamics, historical ratio cycles are well documented across multiple market environments.
One structural distinction that is not widely appreciated in mainstream coverage: because the 2026 cycle began its compression from a higher absolute ratio than any prior post-1980 cycle, even a compression to the 2011 trough of 31:1 would represent a longer and deeper relative outperformance phase for silver than the 2011 cycle itself. Historical patterns do not time themselves, but the mathematical starting point matters for understanding the potential magnitude of the move.
Silver's Industrial Foundation: The Demand Engine That Did Not Exist in Prior Cycles
Perhaps the most analytically significant aspect of the 2026 silver market is the presence of a structural industrial demand base that was largely absent from both the 1980 and 2011 compression cycles. This second engine changes the calculus for ratio analysis in ways that are still not fully reflected in mainstream investor psychology.
Silver supply deficits have now extended for six consecutive years as of 2026. The Silver Institute's World Silver Survey 2026 projects a shortfall of 46.3 million ounces for the current year, with cumulative above-ground stockpile drawdowns reaching approximately 762 million ounces since 2021. A persistent multi-year deficit creates a physical price floor that operates regardless of monetary sentiment. That floor does not require speculative participation to remain intact.
The industrial demand drivers behind this structural tightness include several categories that are price-inelastic in nature. In addition, silver's industrial demand spans multiple growth sectors simultaneously, reinforcing the supply constraint from several directions at once:
-
Solar manufacturing: Panel manufacturers have been reducing silver content per unit through thrifting techniques, but aggregate silver demand from solar remains elevated because deployment volumes have grown exponentially. The efficiency gains from thrifting are being partially absorbed by scale, not eliminated.
-
AI infrastructure: Data centre build-out at the scale required by current AI deployment cycles demands substantial electrical infrastructure. Silver's conductivity properties make it technically irreplaceable in high-performance applications at this level of power density. Procurement in this segment continues regardless of silver's spot price.
-
Automotive electronics and power grid modernisation: The transition to electrified transport and upgraded power transmission infrastructure represents a demand category that is driven by policy commitments and capital expenditure cycles, not speculative sentiment.
Retail silver investment is also forecast to recover by 18 to 20% in 2026 (Silver Institute), adding a third demand layer on top of the structural industrial base. When a supply deficit coincides with recovering investment demand and price-inelastic industrial consumption, the resulting price floor is qualitatively more durable than one built purely on monetary speculation.
The Three Variables That Will Determine the Ratio's Next Move
Forward ratio movement from the current 64:1 level depends on three identifiable macro variables. Each operates through a distinct channel, and their interactions determine whether compression continues, stalls, or partially reverses.
Variable 1: Geopolitical Stability and Oil Price Trajectory
The US-Iran memorandum of understanding signed on June 17, 2026, opened a 60-day negotiating window covering Strait of Hormuz reopening and the withdrawal of the US naval blockade of Iranian ports. Nuclear issues remain unresolved, Israel is not a formal party to the agreement, and Lebanon ceasefire enforcement remains fragile. These represent genuine tail risks to the constructive scenario. If the agreement holds, oil normalises, inflation expectations fall, real yields compress, and silver benefits through reduced opportunity cost. If implementation fractures, the oil price rebound would reverse that chain.
Variable 2: Inflation Trajectory and Fed Rate Probability
May 2026 CPI registered 4.2% year-over-year, the highest reading since April 2023 (Bureau of Labor Statistics, June 10, 2026). More than half of that monthly gain was attributable to energy costs, making oil price normalisation the single most important variable for near-term CPI readings. Market-implied probability of a 2026 rate hike stood at approximately 66% by year-end as of June 17 (CME FedWatch). A material decline in June and July CPI readings, driven by lower energy costs, could shift the dot plot calculus and reduce that probability, creating a constructive environment for ratio compression to resume.
Variable 3: Physical Supply Deficit Depth
If the projected 46.3 million ounce deficit deepens further and retail investment continues its recovery trajectory, the price floor transitions from sentiment-driven to supply-constrained. These are fundamentally different in character. A sentiment-driven floor can evaporate when investor psychology shifts. A supply-constrained floor is far more structurally resilient.
The three scenarios this variable framework generates can be summarised as follows:
| Scenario | Geopolitical Outcome | Inflation Path | Supply Deficit | Ratio Direction |
|---|---|---|---|---|
| Bull Case | MOU holds, oil normalises | CPI falls materially | Deficit deepens | Compression toward 50:1 or below |
| Base Case | MOU partially holds | CPI moderates gradually | Deficit sustained | Ratio oscillates in 58–68:1 range |
| Bear Case | MOU fractures, oil rebounds | CPI remains elevated | Deficit narrows | Ratio expands toward 75–80:1 |
The next major ASX story will hit our subscribers first
Applying the Ratio to Portfolio Thinking: A Step-by-Step Framework
The gold-silver ratio is a positioning tool, not a trading signal. It operates most usefully over multi-month to multi-year time horizons. The following framework translates ratio analysis into structured portfolio thinking. Furthermore, understanding the gold and silver markets within a broader macro context enhances each of the steps below:
-
Establish the current ratio reading relative to the long-run average of approximately 65 to 70:1 and prior bull market troughs of 17:1 (1980) and 31:1 (2011). This provides directional context.
-
Identify whether the ratio is compressing or expanding. A compressing ratio typically signals silver outperforming gold. An expanding ratio signals the opposite. The trend matters as much as the absolute level.
-
Assess the real yield environment. Rising real yields increase the opportunity cost of holding silver and tend to expand the ratio. Compressing real yields have the opposite effect.
-
Evaluate structural demand. If physical supply deficits are deepening and price-inelastic industrial demand is growing, compression can sustain without speculative participation. This qualitatively strengthens the structural case.
-
Apply patience as a non-negotiable requirement. The 2011 compression cycle required approximately 30 months from start to trough. Ratio-based positioning is a thesis that unfolds over a market cycle, not a tactical trade that resolves in weeks.
For those looking to track live ratio data alongside historical context, real-time ratio charting tools can help anchor these steps to current market conditions.
Key Data Reference: Gold-Silver Ratio and Silver Market Statistics (Mid-2026)
| Metric | Data Point | Source |
|---|---|---|
| Gold-silver ratio (mid-June 2026) | ~64:1 | LBMA spot prices |
| Ratio peak (early 2026) | 85:1 | LBMA spot prices |
| Ratio trough (January 29, 2026) | ~50:1 | LBMA spot prices |
| Silver all-time high (January 29, 2026) | $121.62/oz | Silver Institute |
| Silver spot price (mid-June 2026) | ~$66.16/oz | LBMA spot prices |
| Gold spot price (mid-June 2026) | ~$4,227/oz | LBMA spot prices |
| Projected 2026 supply deficit | 46.3 million oz | Silver Institute, World Silver Survey 2026 |
| Cumulative stockpile drawdown since 2021 | ~762 million oz | Silver Institute |
| May 2026 CPI (year-over-year) | 4.2% | Bureau of Labor Statistics, June 10, 2026 |
| Market-implied 2026 rate hike probability | ~66% | CME FedWatch, June 17, 2026 |
| Silver's worst single-day decline (Jan 30) | ~30% | CNBC, January 30, 2026 |
| FOMC members projecting 2026 rate hike | 9 of 18 | Fox Business, June 17, 2026 |
At a reading of 64, the gold silver ratio at 64 signals for silver a market sitting near its long-run historical average after compressing from extreme territory. That is neither a definitive buy signal nor a warning to exit. What it represents is a structurally distinct moment in precious metals history, where two simultaneous demand engines, a six-year supply deficit, and a geopolitical realignment around oil markets are all operating concurrently.
The 1980 and 2011 cycles had one engine each. The current cycle has two. Whether that translates into a compression toward 50:1, 31:1, or beyond depends on the variable interactions outlined above. What the historical record does suggest, consistently, is that this is not the level at which ratio compression cycles have typically ended.
Disclaimer: This article is for informational and educational purposes only and does not constitute financial or investment advice. All data, statistics, and market projections are sourced from publicly available information and are subject to change. Past performance is not indicative of future results. Precious metals investment involves risk. Readers should consult a qualified financial adviser before making any investment decisions.
Want to Know When the Next Major ASX Mineral Discovery Hits the Market?
Discovery Alert's proprietary Discovery IQ model scans ASX announcements in real time, instantly translating complex mineral data into actionable insights for both short-term traders and long-term investors — the same analytical edge that identified opportunities like De Grey Mining and WA1 Resources early in their discovery cycles. Start your 14-day free trial today and explore Discovery Alert's discoveries page to understand how historic mineral discoveries have generated substantial market returns.