
July 26, 2026
The Relative Pricing Lens That Has Outlasted Empires
Few financial metrics have demonstrated the kind of statistical durability that the gold-silver ratio has managed across more than five millennia of recorded economic history. From the treasure vaults of ancient Egypt to the algorithmic trading desks of modern commodity markets, the relationship between these two metals has consistently attracted the attention of traders, governments, and analysts alike. What makes this particularly striking is not that the relationship has remained static, but that despite the complete dismantling of the monetary architecture that once gave it formal meaning, the ratio continues to exhibit measurable, statistically significant behaviour that investors can use as a practical analytical tool.
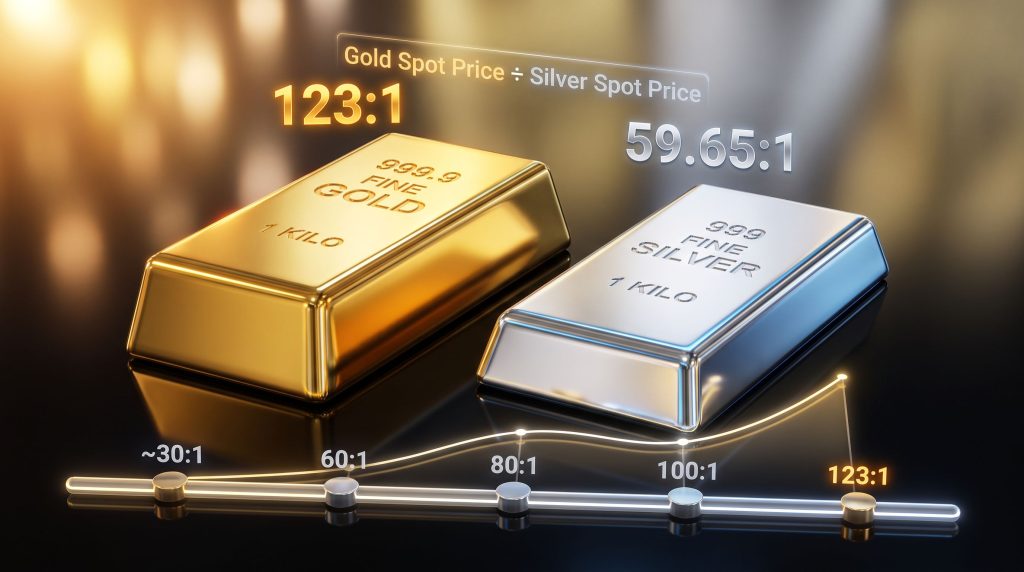
The question of gold-silver ratio relevance in today's markets is more than academic. With the ratio sitting at approximately 70:1 as of mid-2026, well above its statistically derived long-run equilibrium of 59.65:1, the implications for portfolio positioning across precious metals are very real for anyone who understands how to read the signal correctly.
When big ASX news breaks, our subscribers know first
Understanding the Gold-Silver Ratio: A Framework for Relative Value
What the Ratio Actually Measures
At its core, the gold-silver ratio expresses how many ounces of silver are required to purchase a single ounce of gold at prevailing spot prices. The formula is straightforward: divide the gold spot price by the silver spot price, and the resulting number tells you the relative pricing relationship between the two metals at that precise moment. Furthermore, gold-silver ratio analysis provides additional context for interpreting these readings within broader market cycles.
What the ratio does not tell you is equally important. It reveals nothing about whether either metal is cheap or expensive in absolute terms. A ratio of 80:1 does not confirm that silver is fundamentally undervalued on its own merits; it only indicates that silver is priced cheaply relative to gold by historical standards.
| Gold Price (USD/oz) | Silver Price (USD/oz) | Gold-Silver Ratio |
|---|---|---|
| $3,000 | $30 | 100:1 |
| $3,000 | $50 | 60:1 |
| $3,000 | $70 | ~43:1 |
This table illustrates something often overlooked: the ratio can shift dramatically even when gold's absolute price remains completely unchanged. Supply and demand forces operating independently within each metal's market are sufficient to move the ratio across a wide range without any directional price change in gold itself.
The gold-silver ratio functions as a relative pricing lens. It tells investors how gold and silver are valued against each other, not whether either metal is cheap or expensive in isolation. Treating it as an absolute valuation tool is one of the most common analytical errors investors make.
A Multi-Millennium History: How the Gold-Silver Ratio Evolved
Ancient and Pre-Modern Ratio Benchmarks
The earliest documented imposition of a gold-silver ratio comes from ancient Egypt under King Menes, where the exchange rate between the two metals was fixed at 2.5:1. By the early Roman Empire around 210 BCE, the ratio had been set at 8:1, though military conquests that flooded Rome with captured gold and silver caused it to fluctuate as high as 12:1. Julius Caesar later codified it at 11.5:1, with Augustus subsequently adjusting the standard to 11.75:1.
These government-imposed ratios served a dual purpose in bimetallic monetary systems: they provided price stability for everyday commerce while simultaneously creating persistent arbitrage opportunities whenever market forces pushed the natural exchange rate away from the official one. The economic distortions this created ultimately contributed to the abandonment of bimetallism as a workable monetary framework.
The Collapse of Bimetallism and the Ratio's Liberation
European nations began demonetizing silver in the mid-19th century, with Britain, Portugal, and Germany leading the transition toward gold-only monetary standards. The United States formalised this shift through the Coinage Act of 1873, which effectively ended silver's role in the monetary system and allowed the ratio to float freely for the first time in centuries.
The consequences were immediate. Freed from government enforcement, the ratio drifted considerably wider than its historical anchors. By the time of World War II, it had expanded to approximately 40:1. This is a critical distinction for modern analysts: the frequently cited historical reference point of 15:1 belongs to the bimetallic era and reflects a legal policy construct rather than any natural market equilibrium. Applying that figure to modern market analysis introduces a fundamental category error. For a broader perspective on historical gold-to-silver ratio patterns, examining the full sweep of these transitions is particularly instructive.
Historical Note: The transition from fixed government ratios to freely floating market ratios fundamentally changed how the metric should be interpreted. It shifted from a policy instrument enforcing exchange rates to a technical signal reflecting real-time supply and demand dynamics.
The Modern Floating Era: Establishing a New Equilibrium
The true foundation for modern ratio analysis begins in 1971 with the end of the Bretton Woods system, which severed the last formal link between the US dollar and gold. Since then, the ratio has operated purely as a market-driven metric, averaging between 40:1 and 60:1 across most of the post-gold-standard period.
The most rigorous quantitative anchor for the modern era comes from a Johansen Cointegration analysis conducted by the Silver Institute, covering data from January 1970 to May 2026. This analysis identified a long-run equilibrium for the ratio at approximately 59.65:1. The significance of this finding extends beyond a simple average: the Johansen test specifically tests for cointegration, which means it is confirming that the ratio is mean-reverting rather than following a random walk. In statistical terms, this is a meaningful distinction that validates the ratio's use as a market signal rather than dismissing it as noise.
Shorter-run changes in the relative supply and demand for each metal push the ratio away from this equilibrium, while longer-run forces steadily pull it back. According to Silver Institute research, periods of extreme market disequilibrium serve as clear indicators of major over- or undervaluation in either gold or silver, rather than signalling a permanent structural break in the relationship.
Is the Gold-Silver Ratio Still Relevant in Today's Markets?
The Case Against Relevance
Critics of the ratio's continued usefulness make several arguments worth taking seriously:
- Silver's demonetization removes the foundational logic that originally justified tracking the two metals as a paired monetary unit
- Silver's expanding industrial footprint in solar photovoltaics, consumer electronics, and electric vehicles introduces demand variables that have no gold equivalent
- Modern financial instruments, algorithmic trading, and global capital flows have potentially decoupled the two metals' price behaviour
These critiques are coherent in isolation, but they fail to account for what the data actually shows. In addition, understanding silver versus gold performance across different market regimes adds important nuance to these arguments.
The Statistical Case for Continued Relevance
The Silver Institute's analysis arrives at a counterintuitive conclusion: the price correlation between gold and silver has strengthened over the past two decades, not weakened. The mechanism behind this finding is the very financialisation that critics cite as a disrupting force. The proliferation of gold and silver exchange-traded funds from the mid-2000s onward increased simultaneous retail and institutional participation in both markets, and correlated speculative positioning across futures markets reinforced rather than disrupted the co-movement between the two metals.
The Silver Institute's research confirms that despite the dismantling of formal bimetallic and silver monetary standards spanning more than a century through to 1971, the structural relationship between gold and silver has continued into the modern era.
The mean-reversion evidence is compelling:
- The ratio fell from above 80:1 during the post-2008 monetary expansion to approximately 30:1 by 2011
- The record 123:1 reading in 2020 reverted to approximately 60:1 within months
- The ratio's run between 80:1 and 100:1 in the period before October 2025, including a brief breach of 100:1 in March 2025, was followed by a plunge to 43:1 in January 2026
Research Insight: Contrary to sceptic narratives, increasing market financialisation has deepened rather than diminished the statistical relationship between gold and silver prices. The ratio remains mean-reverting and continues to function as a robust relative value indicator.
Mapping the Ratio Through Major Market Crises
Crisis-Driven Spikes and Their Reversions
The pattern across major market dislocations reveals a consistent dynamic: acute stress events cause gold to attract aggressive safe-haven capital flows while silver underperforms due to its dual identity as both a monetary metal and an industrial commodity. When economic conditions stabilise, the safe-haven premium in gold unwinds and silver's catch-up move compresses the ratio. Understanding how gold and silver markets respond to these macro forces provides further context for interpreting these crisis-driven movements.
| Market Event | Approximate Ratio Peak | Subsequent Reversion |
|---|---|---|
| 2008 Global Financial Crisis | ~80:1+ | Fell to ~30:1 by 2011 |
| COVID-19 Pandemic (2020) | Record ~123:1 | Reverted to ~60:1 |
| Pre-October 2025 Rally | Briefly above 100:1 (March 2025) | Plunged to ~43:1 in January 2026 |
| Mid-2026 Reading | ~70:1 | Above long-run equilibrium, ongoing |
The 2020 Record and Its Analytical Significance
The 123:1 reading recorded during the acute phase of the COVID-19 pandemic deserves particular attention because it illustrates both the extremity that silver's dual nature can produce and the speed with which the relationship can normalise. Gold surged as investors sought safety; silver was simultaneously crushed by the collapse in industrial demand as global manufacturing ground to a halt.
When central banks responded with unprecedented liquidity injections and governments began reopening economies, both forces reversed in tandem, producing one of the fastest ratio compressions in modern market history. The lesson embedded in this episode is one of the ratio's more nuanced characteristics: the more extreme the dislocation, the sharper and faster the mean-reversion has historically been.
Silver's Dual Identity: The Variable That Makes the Ratio Complex
Silver occupies a unique position among commodities that creates analytical complexity absent from gold analysis. It simultaneously functions as:
- A monetary and store-of-value asset closely tracked by macro-oriented investors
- An industrial input with growing demand from solar panel manufacturing, electronics, and medical applications
- A speculative vehicle accessed through futures, options, and ETFs by retail and institutional traders alike
This duality explains an important pattern: silver tends to underperform gold during financial crises because industrial demand collapses at the same moment safe-haven demand for gold spikes. Conversely, during economic recoveries and monetary easing cycles, silver can dramatically outperform gold because monetary demand rebounds alongside industrial demand simultaneously. Consequently, for ratio analysis, this means the metric is increasingly influenced by the intersection of monetary cycles and industrial supply-demand dynamics, which is a layer of complexity that pure gold analysis does not require.
The next major ASX story will hit our subscribers first
How Investors Use the Gold-Silver Ratio as a Practical Tool
Portfolio Allocation and Tactical Rotation
The most practically applicable use of the ratio is as a relative value allocation signal between the two metals rather than as an absolute trading trigger for either. Comprehensive precious metals analysis frameworks typically incorporate the ratio alongside other indicators for a more complete picture:
- When the ratio is significantly above the long-run average of approximately 60:1, the historical pattern supports increasing silver exposure relative to gold
- When the ratio approaches or falls below historical lows, the implied trade shifts toward gold as the relatively undervalued metal
- At mid-range readings, the ratio provides limited directional signal and other analytical tools carry more weight
A ratio of 70:1 in mid-2026 sits meaningfully above the long-run equilibrium, placing it in the range where historical precedent has repeatedly favoured silver outperformance in subsequent periods.
The Ratio as a Macro Sentiment Barometer
Beyond direct metals positioning, the ratio serves as a useful sentiment indicator across broader market conditions. For instance, the directional signals tend to align with the following patterns, as documented by sources such as Investopedia's historical guide to the gold-silver ratio:
- Rising ratio: often correlates with elevated market uncertainty, risk-off sentiment, monetary tightening cycles, or demand-side economic weakness
- Falling ratio: often correlates with improving risk appetite, monetary easing, accelerating industrial activity, or broader commodity reflation
Used alongside complementary indicators, including real interest rates, US dollar strength, and equity market volatility indices, the ratio can add a meaningful layer of context to macro positioning decisions.
Investor Caution: The gold-silver ratio is an analytical signal, not a guarantee of any specific outcome. Investors who treat extreme ratio readings as automatic reversal triggers without accounting for macro context, position sizing, and time horizon have historically experienced extended drawdown periods before any reversion materialised.
Critical Limitations: What the Ratio Cannot Tell You
Several limitations are essential to understand before incorporating the ratio into any investment framework.
The ratio is descriptive, not prescriptive. A reading of 70:1 indicates that silver is historically cheap relative to gold. It does not specify whether silver will rise, gold will fall, or some combination of both will produce the normalisation.
There is no fixed correct level. The 59.65:1 long-run equilibrium identified through cointegration testing is a probabilistic anchor derived from historical data, not an immutable law. Market structure can shift over sufficiently long time horizons.
Timing risk is real and underappreciated. The ratio remained persistently above 80:1 for an extended period from 2018 through to early 2020. Investors who initiated silver positions purely on ratio signals in early 2018 faced multi-year waiting periods before the mean-reversion they anticipated materialised. Position sizing, liquidity management, and time horizon planning are non-negotiable elements of any ratio-based strategy. Furthermore, live ratio tracking tools can help investors monitor these movements in real time and avoid reactive decision-making.
FAQ: Gold-Silver Ratio Relevance
What is a normal gold-silver ratio in today's markets?
Statistical analysis covering January 1970 to May 2026 identifies a long-run equilibrium of approximately 59.65:1. Most modern market analysts treat the 50:1 to 80:1 range as historically common, though significant dislocations beyond this band have occurred during major crises.
Does a high ratio guarantee silver will rally?
No. A high ratio indicates silver is historically cheap relative to gold but provides no guarantee of reversal, no specified direction of correction, and no indication of timing. Gold could fall, silver could rise, or both could move simultaneously.
Is the ratio still analytically useful now that silver is no longer a monetary metal?
Silver Institute research indicates yes. Price correlation between the two metals has strengthened over the past two decades alongside increasing market financialisation, and the cointegration relationship remains statistically robust. Gold-silver ratio relevance, in this respect, is well supported by the empirical evidence.
What was the highest gold-silver ratio ever recorded in modern history?
Approximately 123:1, reached during the acute phase of the COVID-19 pandemic in 2020.
How should investors practically apply the ratio?
Most effectively as a relative allocation guide between gold and silver when readings reach historical extremes, and as a supplementary macro sentiment indicator alongside real interest rates, dollar trends, and equity volatility. It should never function as a standalone trading system.
Key Takeaways
- A Johansen Cointegration analysis of data spanning January 1970 to May 2026 confirms a long-run equilibrium of approximately 59.65:1, validating the ratio as a mean-reverting rather than random variable
- Every major ratio extreme over the modern era has ultimately resolved back toward this equilibrium, though the timing has varied significantly from months to multiple years
- Silver's dual identity as both a monetary and industrial metal creates ratio behaviour that is more complex than traditional monetary metal analysis would suggest
- Financialisation of precious metals markets through ETFs and futures has strengthened rather than eroded the gold-silver statistical relationship
- The ratio's value lies in relative positioning decisions and macro sentiment reading, not in absolute price forecasting for either metal
- At a mid-2026 reading of approximately 70:1, the ratio sits above its long-run equilibrium, consistent with historical setups that have preceded periods of silver outperformance — though timing remains inherently uncertain
Investors seeking deeper quantitative research on the gold-silver relationship can access the full Silver Institute report on ratio behaviour and precious metals market structure at the Silver Institute's official website. This independent institutional research provides the statistical foundation referenced throughout this analysis.
Want to Spot the Next Major Precious Metals Discovery Before the Market Does?
Discovery Alert's proprietary Discovery IQ model delivers real-time ASX alerts on significant mineral discoveries — including gold and silver — transforming complex geological data into actionable investment insights for traders and investors at every experience level. Start your 14-day free trial today and explore historic discovery returns on Discovery Alert's discoveries page to understand just how transformative early-mover positioning can be.