August 1, 2026
When Economic Regimes Shift, Gold's Role Becomes Clearer
History rarely announces its turning points in advance. The transitions that matter most in financial markets tend to emerge gradually, visible only in retrospect to most participants but legible in real time to those tracking the right indicators. The shift from a low-inflation, moderate-growth environment toward one characterised by simultaneous price pressure and economic deterioration is precisely the kind of inflection point that has defined gold's most powerful bull runs across multiple decades.
Understanding where the current gold bull market narrative stands requires looking beyond short-term price action and examining the structural architecture underneath. Corrections are inevitable in any secular bull market. What matters is whether the foundational thesis remains intact.
When big ASX news breaks, our subscribers know first
The Regime Transition Underway in 2026
From Recovery to Something More Concerning
Markets move through regimes, and regime changes are rarely comfortable for investors positioned for the prior environment. In early 2026, quantitative analysts studying 22-day rolling correlations of market returns identified a shift in progress: the relatively benign recovery conditions that characterised the start of the year were giving way to patterns associated with inflationary booms and tightening financial conditions. According to analysis cited by Dow Jones, Citi's quantitative strategy team noted that these return patterns are characteristic of the environment that typically precedes stagflation.
This is not a trivial observation. A stagflationary regime, defined by high inflation, slowing growth, and rising unemployment occurring simultaneously, carries distinct implications for asset allocation. It is one of the few macro environments in which both equities and conventional bonds can underperform simultaneously, while real assets including gold historically reassert their value.
What the Data Was Showing as of May 2026
Several economic indicators were converging in a pattern that reinforced the stagflation thesis:
- US inflation climbed to 3.3% year-on-year in March 2026, a sharp acceleration from 2.4% in both January and February
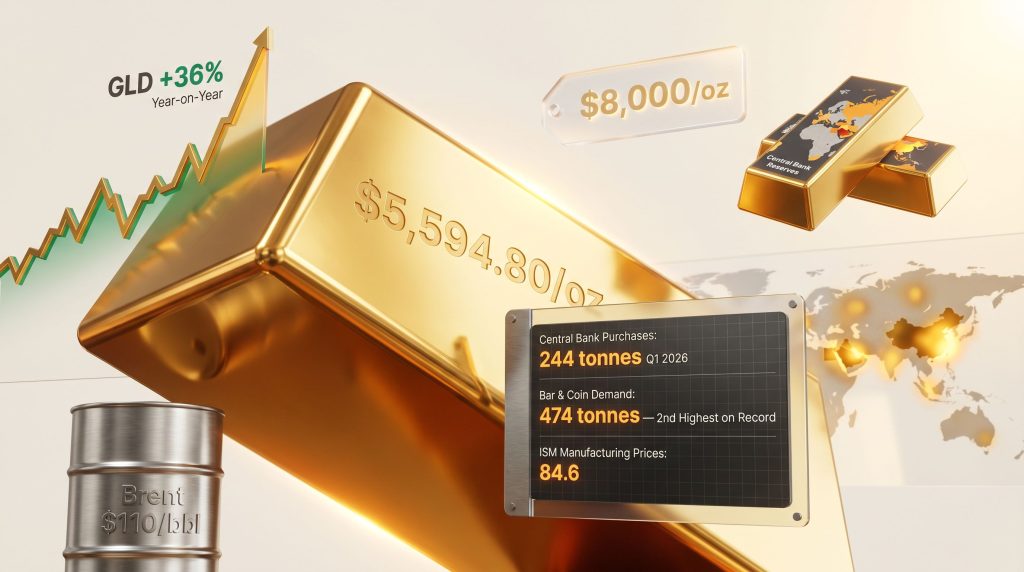
- The ISM Manufacturing Prices Index surged 6.3 points to 84.6 in April 2026, the highest reading since May 2022, with prices paid rising 25.6 points over three months, described as the largest three-month increase on record
- The US economy shed 92,000 jobs in February 2026, pushing unemployment to 4.4%, while manufacturing employment fell to its lowest level since January 2022 at 12.57 million jobs
- Brent crude oil was trading at $110.46 per barrel at the time of writing, sustaining both inflationary pressure and growth headwinds simultaneously
These are not isolated data points. They form a coherent picture of an economy caught between the competing pressures of rising input costs and contracting labour market conditions, which is precisely the stagflationary dynamic that has historically been among gold's most powerful tailwinds.
How Stagflation Has Historically Rewarded Gold Holders
The 1970s Blueprint Still Matters
The most instructive historical analog for the current environment remains the 1970s, when two overlapping energy shocks, the OPEC oil embargo of 1973 and the Iranian Revolution of 1979, pushed the US into a prolonged period of stagflation. During this period, gold surpassed the $3,000 milestone benchmark and eventually appreciated from its Bretton Woods-fixed price of $35 per ounce to a peak near $850 per ounce by January 1980, representing a gain exceeding 2,300%.
What made this performance so striking was not just the magnitude but the context. Equities and bonds both underperformed significantly during extended stretches of this period, while gold served as the primary vehicle for capital preservation. The mechanism was straightforward: when both growth and monetary stability are simultaneously compromised, tangible assets with no counterparty risk command a premium.
Oil price increases contributed not only to the 1970s stagflationary crises but also to US recessions in 1990 and 2008. Russia's invasion of Ukraine in February 2022 triggered a major energy shock, particularly in Europe, reinforcing the pattern that energy market disruptions carry systematic economic consequences well beyond the commodity sector itself.
Recession Performance Across Market Cycles
The historical record of gold versus equities across recessionary periods provides important context for evaluating the current environment:
| Economic Environment | Gold's Relative Performance |
|---|---|
| Last 8 US recessions | Outperformed S&P 500 in 6 of 8, averaging +37% outperformance |
| 1970s stagflation cycle | Gained over 2,300% while equities significantly underperformed |
| 2008 financial crisis | Outperformed as equity markets collapsed sharply |
| Current regime (2026) | Stagflation pricing emerging per quantitative analysis |
Capital Economics provides a useful analytical framework for understanding the oil-inflation transmission mechanism: a 5% rise in oil prices adds approximately 0.1% to developed-market inflation. The IMF estimates that every 10% increase in oil prices reduces global economic output by 0.1 to 0.2%. With Brent crude above $110 per barrel, these multipliers carry significant weight for the economic outlook.
The Federal Reserve's Internal Division and What It Means for Gold
The Most Contested Fed Decision in Three Decades
The Federal Reserve's April 29, 2026 rate decision was reportedly the most divided since 1992, according to Reuters. Eight officials voted to maintain the Federal Funds Rate in the range of 3.5 to 3.75%, while four dissented. Three of the dissenters, Fed presidents Lorie Logan of Dallas, Beth Hammack of Cleveland, and Neel Kashkari of Minneapolis, objected to the inclusion of an easing bias in the policy statement. A fourth dissenter voted for an immediate rate cut, illustrating the breadth of internal disagreement.
The specific word that drew dissent was the term additional in the Fed's forward guidance, which policy watchers interpreted as signalling openness to further rate reductions. The dissenting regional presidents argued this framing was inappropriate given both the inflationary environment and a labour market that had stabilised sufficiently to remove urgency for accommodation.
Real Interest Rates: The Single Most Reliable Gold Price Indicator
Of all the variables that influence gold pricing, including the US dollar, ETF flows, inflation, bond yields, and physical demand, real interest rates maintain the strongest and most consistent historical relationship. The logic is straightforward: when inflation-adjusted returns on cash and sovereign bonds turn negative, the opportunity cost of holding gold effectively disappears. Furthermore, the relationship between gold and bonds across economic cycles illustrates just how central this dynamic is to long-term price behaviour.
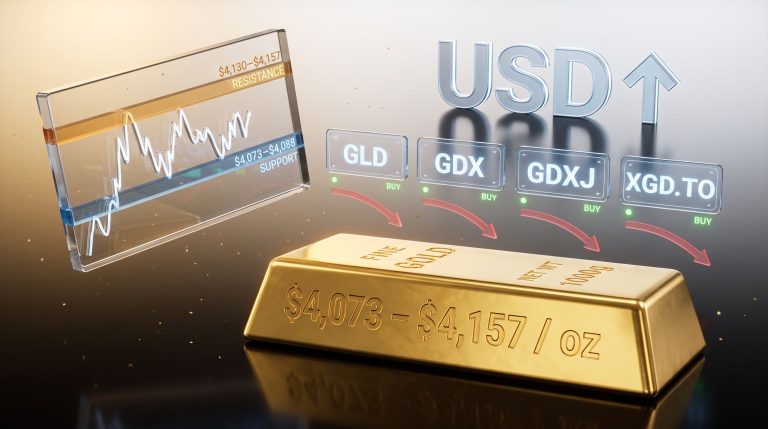
When risk-free government bonds pay yields north of 4% and monetary policy signals patience, a non-yielding asset like gold faces structural headwinds in the short term. This dynamic, noted by Yahoo Finance in April 2026, explains much of gold's recent price weakness despite the persistence of geopolitical risk and inflationary pressure.
As of May 2026, the real interest rate stood at approximately +1.1%, calculated as the nominal rate of 4.4% minus CPI of 3.3%. Positive real yields reduce gold's near-term appeal by offering investors an inflation-adjusted positive return from government bonds. However, the trajectory of this figure matters more than its current level.
If CPI continues its upward trend toward 4% while the Fed holds rates unchanged, real yields could turn negative. Historically, this is one of the most powerful conditions for gold price acceleration. The Fed's internal divisions make this scenario plausible: with Kevin Warsh, President Trump's nominee for Fed Chair, expected to take the reins within weeks of the May 2026 decision, the institutional pressure toward rate reduction could intensify even as inflation climbs.
Central Bank De-Dollarisation: The Most Durable Structural Support
A Generational Shift in Reserve Management
Perhaps the most significant structural development underpinning the gold bull market narrative is the sustained and broadening accumulation of gold by central banks globally. In 2024, global central bank gold reserves surpassed US Treasury reserve holdings for the first time since 1996. This is not a marginal shift; it reflects a fundamental reassessment of reserve management priorities among monetary authorities worldwide. Indeed, central bank demand boosting gold has become one of the defining features of this cycle.
Since the 2008 financial crisis, central banks have collectively added over 225 million ounces to their gold reserves. For three consecutive years, net central bank gold purchases have exceeded 1,000 tonnes annually, double the average pace of the preceding decade. Meanwhile, the US dollar's share of global reserve assets has declined from over 60% in the early 2000s to approximately 40% today.
Why Central Banks Are Structurally Shifting Toward Gold
The motivations driving this reserve reallocation are multiple and reinforcing:
- Post-pandemic inflation eroded confidence in the long-term purchasing power of fiat currencies held as reserve assets
- US fiscal deterioration, with the current deficit running at approximately $1.9 trillion, is raising sovereign debt sustainability concerns among foreign reserve managers
- The weaponisation of dollar-denominated financial infrastructure through sanctions has given non-Western central banks a concrete operational incentive to reduce exposure to assets that can be frozen or restricted
- Gold carries no counterparty risk, unlike Treasury bonds, which are the liability of the US government and therefore subject to geopolitical constraints
- China has been selling US Treasuries at rates unseen since 2008, simultaneously building gold reserves as part of a broader reserve diversification strategy
The Geographic Broadening of Accumulation
What makes the current central bank buying cycle particularly significant is that it has extended well beyond the major historical accumulators. According to analysis published by Investing Live, buying activity has broadened to include Saudi Arabia, Qatar, the UAE, and Egypt, suggesting the trend has further structural momentum. Emerging market central banks currently hold gold at only 16% of total reserves, well below the allocation levels of developed-market institutions. This low baseline creates substantial headroom for continued accumulation.
The Deutsche Bank $8,000 Scenario
Deutsche Bank published a scenario analysis in late April 2026 projecting that gold could approach $8,000 per ounce within five years if emerging market central banks increase their gold allocation from the current 30% to 40% of reserves. The bank described this scenario as anchored in one of the most significant shifts in global reserve management in a generation, rooted in the unwinding of the post-Cold War international order and the practical incentives created by dollar weaponisation through sanctions.
JPMorgan and Wells Fargo have established year-end 2026 price targets in the $6,000 to $6,300 range, reflecting a growing Wall Street consensus that gold's multi-year ascent is structurally far from complete. Gold hit an all-time high of $5,594.80 per ounce in early February 2026 before pulling back approximately 22%. Despite this correction, the SPDR Gold Shares ETF (GLD) remains up 36% over the prior year and 6% year-to-date, confirming the broader structural uptrend remains intact. According to VanEck's analysis of the gold bull market, this enduring uptrend reflects structural forces unlikely to reverse in the near term.
What Q1 2026 Demand Data Reveals About Market Dynamics
World Gold Council Q1 2026 Report: The Full Picture
The World Gold Council's first-quarter 2026 demand report, published April 29, provided a nuanced picture of gold market dynamics that cuts against any simple narrative of weakening demand:
| Demand Category | Q1 2026 | Year-on-Year Change |
|---|---|---|
| Total demand | 1,231 tonnes | +2% |
| Bar and coin investment | 474 tonnes | +42% (second highest quarter on record) |
| Gold-backed ETF inflows | 62 tonnes | Lower than Q1 2025's +230t |
| Central bank net purchases | 244 tonnes | +3% |
| Technology demand (incl. AI) | 82 tonnes | +1% |
The Asian Physical Demand Phenomenon
Bar and coin demand of 474 tonnes in Q1 2026 was the second highest quarterly figure ever recorded. Asian investors were the dominant buyers, absorbing gold investment products at an accelerated pace. This represents a meaningful divergence from Western institutional behaviour: while US-domiciled gold ETFs experienced notable outflows in March, Asian retail and institutional participants were aggressively acquiring physical gold.
This divergence is important to understand. Western investors often respond to short-term interest rate signals and equity market momentum, rotating out of gold during periods of positive real yields and equity outperformance. Asian investors, particularly in markets with recent experience of currency instability and inflationary episodes, tend to maintain more durable physical gold allocations as a core wealth preservation strategy.
Technology demand, including applications in artificial intelligence infrastructure, edged 1% higher to 82 tonnes, reinforcing that gold's industrial applications are growing alongside its investment demand.
The next major ASX story will hit our subscribers first
Peak Gold: The Supply Constraint That Rarely Gets Enough Attention
When Mine Output Cannot Meet Total Demand
A defining characteristic of the current gold market is the structural gap between mine production and total demand. Global mine output in Q1 2026 reached 884.7 tonnes, substantially below quarterly demand of 1,231 tonnes. The gap of approximately 347 tonnes was bridged by 366 tonnes of recycled gold, confirming that primary mine supply alone cannot meet market requirements.
This condition, where annual mine production is insufficient to satisfy total demand without secondary supply, represents a structural tightening rarely given adequate weight in investment analysis. The current state of gold exploration further underscores why supply constraints are becoming a more pressing factor for long-term price dynamics.
Identified, economically recoverable gold reserves are estimated at approximately 59,000 tonnes, representing roughly 20 years of production at current extraction rates, according to The Oregon Group. The pipeline of large-scale development projects capable of replacing depleting reserves is contracting, not expanding.
The Structural Challenges Compressing Future Supply
The supply-side picture is complicated by converging constraints:
- Declining ore grades across many of the world's established mining districts, requiring more ore to be processed for each ounce recovered
- A near-absence of major new discoveries over the past decade, as the most accessible geological targets have been largely exhausted
- Resource nationalism, with governments in key mining jurisdictions demanding larger equity stakes and royalty streams from foreign-operated mines, raising development risk and reducing economic viability of marginal projects
- Extended development timelines, typically 10 to 20 years from discovery to production for major deposits, meaning even significant new discoveries made today would not meaningfully contribute to supply within the current bull cycle
- Industry consolidation behaviour, with major mining companies pursuing merger and acquisition activity rather than the greenfield exploration spending that generates new discoveries
While 2025 saw record gold mine production levels globally, the pipeline of large-scale projects capable of sustaining or growing output is shrinking. The industry is increasingly dependent on junior exploration companies to identify the next generation of deposits, a process with no guarantee of near-term supply relief.
Where the Current Cycle Stands in Historical Context
Bull Market Duration and the Case for Further Upside
| Gold Bull Market | Approximate Duration | Primary Catalyst |
|---|---|---|
| 1972 breakout cycle | USD depegging, energy crisis, monetary expansion | |
| 2005 breakout cycle | Emerging market growth, dollar weakness | |
| Historical average (major cycles) | ~1,062 days | Monetary and geopolitical convergence |
| Current cycle (from late 2022) | ~735 days as of late 2025 | De-dollarisation, fiscal stress, geopolitical risk |
The current bull market remains meaningfully shorter than the historical average duration for major gold cycles. Technical analysts tracking long-term chart structures have noted that a 12 to 13 year cup-and-handle base completed in 2024 historically signals continued structural upside, while gold-to-equity ratio breakouts across 12-year bases suggest a rotation from financial assets into hard assets is in early stages rather than approaching completion.
Importantly, the major bull markets of the 1970s and 2000s each endured five or more corrections exceeding 10% before reaching their ultimate peaks. The current approximately 22% pullback from the February 2026 all-time high is consistent with the pattern of drawdowns that characterise primary uptrends rather than terminal reversals. Furthermore, analysts at Ahead of the Herd argue that despite recent weakness, the fundamental case underpinning the bull market remains squarely on track.
Key Risk Factors and the Monitoring Dashboard
What Could Derail the Gold Bull Market Narrative
| Factor | Bull Case Pathway | Bear Case Risk |
|---|---|---|
| Federal Reserve policy | Rate cuts in late 2026 push real yields negative | Persistent hold or hikes maintain positive real yield headwinds |
| Oil prices | Sustained elevation drives stagflation rotation into gold | Sharp oil price decline reduces inflation pressure |
| Central bank buying | Emerging markets accelerate toward 40% gold allocation | Reserve diversification reversal or coordinated selling |
| US dollar | Fiscal concerns drive structural dollar weakness | Risk-off dollar strengthening offsets gold tailwinds |
| Geopolitical environment | Ongoing conflict sustains safe-haven premium | Rapid de-escalation reduces geopolitical risk pricing |
| Mine supply | Production deficit deepens, supporting structural floor | Major new discoveries or recycling surge ease constraints |
The Indicators Worth Tracking Closely
Investors seeking to monitor the integrity of the gold bull market narrative should track this dashboard of leading indicators:
- Real interest rates: A move back toward zero or negative territory on the 10-year Treasury real yield is the single most important positive catalyst
- ISM Manufacturing Prices Index: Already at 84.6 in April 2026, the highest since May 2022, with prices paid rising 25.6 points over three months in what analysts describe as the largest three-month increase on record
- Central bank purchase data: Quarterly World Gold Council reports tracking whether net buying remains above the 1,000-tonne annual threshold
- US unemployment rate: Rose to 4.4% in February 2026, with manufacturing sector employment at its lowest since January 2022
- Brent crude oil: Sustained prices above $100 per barrel amplify both inflation and stagflation risk, reinforcing gold's structural case
- Gold ETF flows: A return to strong Western institutional inflows would signal broad re-engagement with the structural bull thesis
- US Treasury demand from foreign holders: China's accelerating Treasury sales function as a leading indicator of de-dollarisation momentum
In addition, monitoring the gold-silver ratio can offer valuable signals about broader precious metals market sentiment and relative value during different phases of the cycle.
Frequently Asked Questions About the 2026 Gold Bull Market
Is the gold bull market over after the recent price correction?
The approximately 22% decline from gold's all-time high of $5,594.80 per ounce in early February 2026 is consistent with historical correction patterns observed within major secular bull markets. Gold ETFs remain up approximately 36% over the prior year, and the structural demand drivers including central bank accumulation, de-dollarisation dynamics, and supply constraints remain firmly in place. Major historical bull markets each survived multiple corrections of similar or greater magnitude before reaching their ultimate peaks.
What would need to happen for gold to reach $8,000 per ounce?
Deutsche Bank's scenario analysis projects gold could approach $8,000 per ounce within five years if emerging market central banks increase their gold allocation from approximately 30% to 40% of total reserves. Given that emerging market institutions currently hold gold at only 16% of reserves, well below developed-market norms, the structural headroom for continued accumulation is substantial. This scenario does not require an extreme geopolitical or financial crisis; it requires only a continuation of the de-dollarisation trend already underway.
Why does the Federal Reserve's internal division matter for gold investors?
The Fed's April 2026 decision being the most divided since 1992 signals genuine institutional uncertainty about the appropriate path for monetary policy. If incoming Fed Chair Kevin Warsh pushes for rate cuts while inflation continues rising, the result could be a collapse in real yields toward negative territory, historically one of gold's most powerful catalysts. Conversely, if the dissenters prevail and rates remain elevated amid climbing inflation, the stagflation scenario becomes more pronounced, which also favours gold based on historical precedent.
What is peak gold and why does it matter?
Peak gold describes the condition in which annual mine production is insufficient to satisfy total demand without relying on secondary recycled supply. In Q1 2026, mine output of 884.7 tonnes fell well short of total demand of 1,231 tonnes, with recycling bridging the gap. With identified economically recoverable reserves estimated at approximately 59,000 tonnes representing roughly 20 years of supply at current rates, the long-term production outlook structurally supports tighter gold market conditions over the coming decade.
Why are Asian investors buying record amounts of physical gold?
Asian investors, particularly across China and broader Southeast Asia, maintain culturally and historically embedded preferences for physical gold as a core wealth preservation vehicle. Unlike Western institutional investors who rotate between gold, equities, and bonds based on short-term yield signals, Asian retail and institutional participants tend to increase physical gold accumulation during periods of monetary uncertainty, currency weakness, and geopolitical instability. All three of these conditions were present simultaneously in Q1 2026, driving bar and coin demand to the second highest quarterly total ever recorded.
The Structural Case Remains Intact
The convergence of forces supporting the gold bull market narrative is not a product of any single variable that could be reversed by a single policy decision. It is the product of simultaneous, reinforcing structural shifts: generational de-dollarisation by central banks managing trillions in reserves, a US fiscal trajectory that is raising long-term sovereign debt sustainability questions, an energy-driven stagflationary impulse with historical precedent for producing gold's most powerful bull phases, and a mine supply pipeline that is contracting rather than expanding to meet growing structural demand.
Short-term price weakness, driven by positive real yields and equity market rotation, represents a cyclical interruption within a structural uptrend rather than evidence that the underlying thesis has been invalidated. The market is beginning to reprice real assets for an environment of persistent inflation, manufacturing contraction, slowing global growth, and rising unemployment. Gold, as the most universally recognised real asset with no counterparty risk, stands at the centre of this repricing.
The current bull cycle remains shorter than the historical average duration for major gold cycles. Western retail participation has yet to approach the levels seen during prior cycle peaks. And the structural demand floor provided by central bank accumulation shows no sign of abating. The gold bull market narrative, on balance, remains firmly on track.
This article is for informational purposes only and does not constitute financial advice. Forecasts, price projections, and scenario analyses referenced herein represent the views of third-party analysts and institutions and are inherently speculative. Past performance of gold in prior economic cycles does not guarantee future results. Investors should conduct their own due diligence and consult a qualified financial adviser before making investment decisions.
Want to Identify ASX Gold Stocks Before the Market Catches On?
Discovery Alert's proprietary Discovery IQ model delivers real-time alerts on significant ASX mineral discoveries, cutting through complex data to surface actionable opportunities the moment they are announced — particularly relevant as stagflationary pressures and central bank de-dollarisation continue to reshape the investment landscape. Explore how historic mineral discoveries have generated substantial returns on Discovery Alert's dedicated discoveries page, then begin your 14-day free trial to position yourself ahead of the broader market.