
June 26, 2026
The Mechanics Most Investors Never Learn About Gold and Economic Data
There is a widespread assumption embedded in how most people think about precious metals investing: a healthy economy is gold's enemy. When growth accelerates, the theory goes, central banks tighten, yields rise, and the appeal of a non-yielding metal evaporates. Clean logic. Simple narrative. And persistently incomplete.
The reason why gold rose on strong GDP data released on June 25, 2026 is not a paradox. It is a window into a pricing mechanism that sophisticated market participants understand well, and that most retail investors have never been taught. Unpacking it properly requires separating three distinct forces that operate on gold simultaneously, across very different time horizons.
When big ASX news breaks, our subscribers know first
Two Markets Operating Inside One Metal
Gold is not a single market. At any given moment, its price reflects the interaction between at least two fundamentally different investor populations with entirely different motivations.
The first group trades gold through futures contracts, ETFs, and leveraged paper instruments. Their decisions are driven by rate expectations, dollar positioning, real yield dynamics, and short-term risk appetite. Their time horizon is measured in days or weeks.
The second group holds physical gold as a long-duration macro hedge. Their thesis is built on purchasing power erosion, sovereign debt expansion, and the structural limitations of fiat monetary systems. Their time horizon is measured in years or decades.
When economic data is released, these two groups respond differently, and often in opposite directions. Understanding which group is dominant in any given session is the key to interpreting gold's seemingly contradictory reactions to macro data. Furthermore, the gold and bonds dynamics at play between these two populations often reveal deeper patterns than any single data release can capture.
Critical distinction: The paper price of gold and the structural value thesis for gold are not the same thing. A single GDP print can move one significantly while leaving the other entirely untouched.
Why Strong Economic Growth Pressures Gold's Paper Price
The transmission mechanism from GDP growth to gold pricing works through the interest rate channel. Gold generates no income. It carries no coupon and pays no dividend. When competing assets offer attractive real returns, capital migrates away from gold toward yield-bearing alternatives.
The sequence unfolds as follows:
- Economic data surprises to the upside (strong GDP, low jobless claims, elevated inflation)
- Market participants reprice rate hike probability upward, anticipating the Federal Reserve will use the strong growth environment to tighten further
- Real yields rise as bond markets adjust to a more restrictive rate path
- The U.S. Dollar Index strengthens on the expectation of higher domestic interest rates relative to global peers
- Gold faces compounding headwinds: a stronger dollar makes dollar-denominated gold more expensive for foreign buyers, while higher real yields increase the opportunity cost of holding a zero-income asset
- Futures traders and paper gold holders reduce exposure, rotating into bonds or cash instruments that now offer improved real returns
| Macro Signal | Rate Expectation Shift | Dollar Reaction | Gold Paper Price Impact |
|---|---|---|---|
| GDP beats forecast | Hike probability rises | Strengthens | Typically bearish |
| GDP misses forecast | Cut probability rises | Weakens | Typically bullish |
| Inflation above target | Hike pressure intensifies | Mixed | Context-dependent |
| Labor market weakens | Rate cut expectations build | Softens | Typically bullish |
| Inflation below 2% for multiple quarters | Rate cut confirmed | Weakens | Bullish repricing |
The June 25, 2026 Data Release: What the Numbers Actually Said
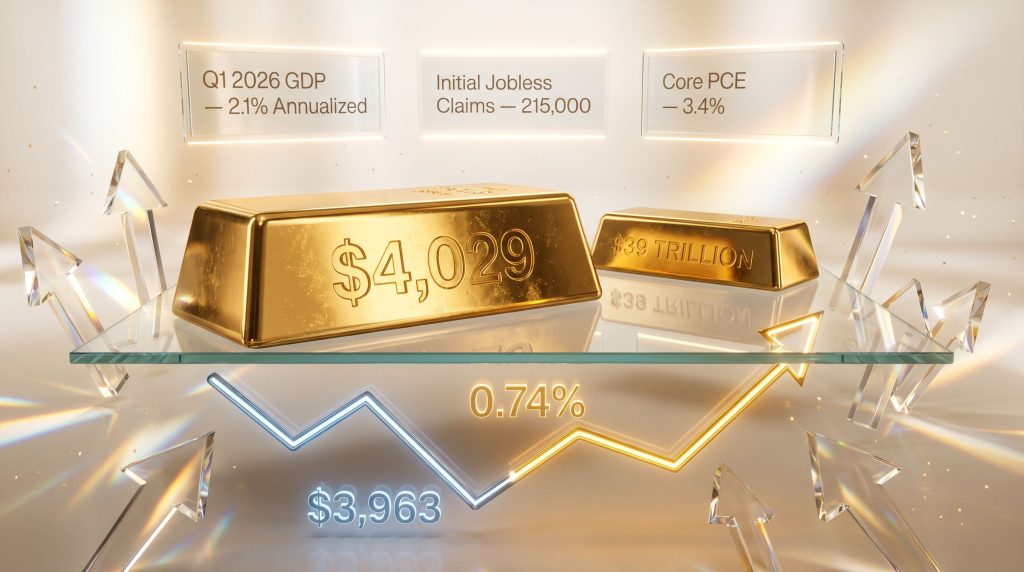
Three significant data points arrived simultaneously on June 25, 2026, and taken together they painted a picture of a resilient economy operating alongside persistent inflation pressures.
| Data Release | Reported Result | Market Estimate | Interpretation |
|---|---|---|---|
| Q1 2026 GDP (Revised) | 2.1% annualized | Below prior estimate | Growth remains solid |
| Initial Jobless Claims | 215,000 | 225,000 estimate | Labour market tighter than expected |
| May PCE Inflation (YoY) | 4.1% | Consensus in-line | Inflation running well above Fed target |
By conventional analysis, this data combination should have applied sustained downward pressure on gold. The Federal Reserve had held rates at 3.50 to 3.75% since its June 17 meeting, at which nine of eighteen FOMC members who submitted projections indicated support for at least one additional rate increase before year-end (Federal Reserve Summary of Economic Projections, June 17, 2026). The CME FedWatch Tool placed a 63% probability on a September rate hike as of June 25, 2026.
The 2.1% GDP revision matters for a specific reason beyond the headline number. When growth is sluggish, a central bank confronting above-target inflation faces a genuine constraint: tighten aggressively and risk tipping a fragile economy into contraction, or stay cautious and allow purchasing power to erode further. That dilemma limits the practical ceiling for rate hikes, which in turn limits the structural headwind facing gold.
A confirmed 2.1% growth rate dissolves that constraint. The Federal Reserve gains what might be called operational permission to raise rates without triggering a growth shock. Markets interpreted this as an expanded rate ceiling, and that interpretation had already been priced into gold's paper price on June 24, when gold touched $3,963, its lowest level in seven months.
The Pre-Pricing Phenomenon: Why Gold Recovered on Bearish Data
Gold closed June 25, 2026 up 0.74% at $4,029. The apparent contradiction dissolves once the concept of pre-pricing is properly understood.
By the time a scheduled data release arrives, institutional traders, macro hedge funds, and algorithmic systems have already repositioned based on probability-weighted expectations. When the FOMC delivered its hawkish signal on June 17, including the nine-member dot plot indicating additional rate increases, the selling that bearish GDP data would have caused began immediately following that meeting.
The core insight: Markets do not react to what data says. They react to the difference between what data says and what had already been assumed. When a data release simply confirms a scenario that traders had already positioned for, the marginal seller has already exited, and the catalyst for further downside has been neutralised.
By June 24, gold had absorbed the rate-hike probability into its price at $3,963. When June 25's triple release landed without delivering a new hawkish surprise beyond what was already baked in, buyers re-entered. The recovery was not a fundamental reassessment of gold's outlook. It was a technical rebound from an oversold position after the exhaustion of pre-positioned sellers.
This distinction is not merely academic. Misreading a pre-pricing rebound as a genuine bullish signal is one of the most common errors made by investors who interpret gold's day-to-day movements as commentary on its structural value. The GDP-gold relationship further illustrates why these short-term reactions rarely tell the full story.
What the GDP Revision Leaves Completely Unchanged
This is where the analytical framework separating paper price mechanics from structural value becomes most important. Several conditions that form the foundation of the long-term case for gold were entirely unaffected by the June 25 data.
The fiscal arithmetic remains intact:
- The U.S. national debt stood at approximately $39 trillion as of June 2026 (U.S. Treasury, Debt to the Penny, June 2026), a figure no single GDP revision can meaningfully alter
- Annual federal interest payments exceeded $1 trillion in fiscal year 2026, a level that creates structural constraints on how aggressively the Federal Reserve can maintain restrictive rates over extended periods
- Core PCE inflation remained at 3.4%, which sits approximately 70% above the Federal Reserve's 2% target (Federal Reserve Summary of Economic Projections, June 17, 2026), and the Fed's own projections showed it staying elevated through year-end
There is a rarely discussed dynamic here that deserves attention: the fiscal constraint on monetary policy. Every 25 basis point increase in the federal funds rate adds materially to the government's annual debt servicing burden. At $39 trillion in outstanding debt, the relationship between rate levels and federal budget pressure is not theoretical. It creates a practical ceiling on how long restrictive monetary policy can be sustained, regardless of what any individual GDP print indicates.
This asymmetry defines the structural gold thesis. Strong economic growth temporarily elevates the opportunity cost of holding gold and strengthens the dollar. It does not reduce sovereign debt, reverse the federal deficit trajectory, or push core inflation sustainably below 2%. Consequently, the strategic case for gold remains compelling precisely because these macro conditions remain unchanged. Until those conditions materialise, the multi-decade purchasing power erosion argument for holding physical gold remains structurally intact.
The next major ASX story will hit our subscribers first
The Three-Layer Framework for Reading Gold's Reaction to Any Macro Release
| Layer | Primary Driver | Relevant Time Horizon | Effect of Strong GDP |
|---|---|---|---|
| Paper Price Mechanics | Rate expectations, real yields, futures positioning | Days to weeks | Typically bearish: higher opportunity cost |
| Pre-Pricing Dynamics | Institutional positioning ahead of releases | Hours to days | Can neutralise bearish impact if already absorbed |
| Structural Value Thesis | Sovereign debt, inflation trajectory, purchasing power erosion | Years to decades | Largely unaffected by individual data prints |
Understanding which layer is active explains nearly every counterintuitive gold reaction to economic data. When pre-pricing has already absorbed the hawkish implications of strong data, the paper price can rally even as the headline looks bearish. When the structural backdrop remains unchanged, long-duration holders have no rational basis for adjusting their position based on a single quarterly GDP revision.
What to Watch: The July Payrolls Report and Its Binary Implications
The next significant test for gold markets arrives with the July Non-Farm Payrolls report, scheduled for Thursday, July 2 rather than the usual Friday, due to the July 4 Independence Day holiday. The outcomes are binary and their implications for gold's paper price diverge sharply.
Scenario A: Strong payrolls print
- September rate hike probability likely moves above 68%
- Dollar strengthens, real yields rise further
- Paper gold faces renewed selling pressure
- Physical holders: no structural change warranted
Scenario B: Weak payrolls print
- The growth constraint the Fed lost with the solid GDP revision partially returns
- Rate cut expectations begin to build into the forward curve
- Dollar softens, gold recovers further from recent lows
- Paper gold positioning shifts toward bullish
The data that would genuinely challenge the structural case for gold over the long run requires a different checklist entirely. It would need to include:
- Sustained federal budget surpluses producing meaningful debt reduction over multiple years
- Core PCE inflation consistently printing below 2% for multiple consecutive quarters without policy reversal
- A structural narrowing of the federal deficit trajectory, not merely a single quarter of better-than-expected growth
- Real interest rates remaining durably positive across the full yield curve for an extended period
None of those conditions appeared in the June 25 data. The GDP revision confirmed economic resilience. It did not rewrite the fiscal architecture that underpins why long-term investors hold gold in the first place.
For long-term gold holders: The relevant question after any macro data release is not whether the headline number was better or worse than expected. The relevant question is whether the data changes the multi-year fiscal, monetary, and purchasing power trajectory. June 25's data did not. The structural case remains intact.
Common Questions About Why Gold Rose on Strong GDP Data
Does strong GDP always push gold prices lower?
Not automatically. The relationship depends entirely on whether the data changes the expected path of monetary policy relative to what markets had already priced in. Strong data that was anticipated produces minimal incremental selling pressure because pre-positioning has already occurred.
What is the primary mechanism linking GDP data to gold prices?
The connection runs through interest rate expectations. Strong GDP data raises the probability of additional rate hikes, increases real yields, strengthens the dollar, and raises the opportunity cost of holding a non-yielding asset. All four forces create headwinds for gold's paper price. In addition, the inflation hedge role gold plays means its structural demand persists even when short-term price pressure intensifies.
Why does the U.S. national debt matter for gold?
At approximately $39 trillion, the sheer scale of federal debt creates a structural ceiling on how restrictive monetary policy can remain over extended periods. As interest payments consume a growing share of federal revenue, the political and economic pressure to eventually ease policy increases, which is historically constructive for gold as a store of value. Furthermore, central bank influence on gold markets means these dynamics are amplified at an institutional level well beyond retail investor activity.
What economic data points most directly influence gold's short-term price?
The most influential data for gold's near-term price movements includes Federal Reserve rate decisions and forward guidance, PCE and CPI inflation readings, Non-Farm Payrolls reports, real yield movements on the 10-year Treasury, and the U.S. Dollar Index. However, understanding how gold price moves equities in tandem adds another dimension to interpreting these signals across a broader portfolio context. The World Gold Council's research on Australia's macro shifts also provides a valuable regional lens for understanding why gold rose on strong GDP data and what that means for domestic investors.
Sources: Bureau of Economic Analysis, Q1 2026 GDP Revision; Bureau of Economic Analysis, Personal Income and Outlays, May 2026; U.S. Department of Labor, Initial Jobless Claims, Week Ending June 20, 2026; Federal Reserve Summary of Economic Projections, June 17, 2026; CME Group FedWatch Tool, June 25, 2026; U.S. Treasury, Debt to the Penny, June 2026.
This article is for informational and educational purposes only and does not constitute financial or investment advice. All forecasts, scenarios, and projections referenced involve uncertainty and should not be interpreted as predictions of future performance. Readers should consult a qualified financial adviser before making any investment decisions.
Want to Know Which ASX Mineral Discoveries Could Deliver the Next Major Return?
While understanding gold's macro mechanics sharpens your analytical edge, Discovery Alert's proprietary Discovery IQ model does the heavy lifting for ASX investors — instantly scanning daily announcements across 30+ commodities to surface actionable mineral discovery opportunities the moment they hit the exchange. Explore historic discovery returns on Discovery Alert's dedicated discoveries page and begin your 14-day free trial to position yourself ahead of the broader market.