
June 26, 2026
When Rate Cycles Collide With Structural Bull Markets
Few dynamics in global finance are as revealing as the tension between short-term monetary tightening and long-term structural commodity demand. Throughout history, precious metals markets have repeatedly absorbed rate-driven corrections, only to emerge at higher price levels once the monetary cycle turned. The current situation facing gold is textbook in its architecture: a central bank pivoting toward unexpected tightening, a commodity that had already priced in a different outcome, and a structural demand story that remains entirely intact beneath the surface volatility.
Understanding the BofA gold forecast amid Fed rate pressures requires separating two distinct narratives that are currently competing for investor attention. One is a story about timing. The other is a story about direction. They are not the same conversation, yet much of the market noise conflates them entirely.
When big ASX news breaks, our subscribers know first
The Monetary Pivot That Repriced Gold's Near-Term Trajectory
At the beginning of 2026, the prevailing market consensus anticipated a Federal Reserve easing cycle. The gold price forecast climbed accordingly, surging above $5,400/oz in January 2026 as investors positioned for rate cuts, dollar weakness, and accelerating institutional demand. That consensus has since been comprehensively dismantled.
The catalyst was a geopolitical shock with direct inflationary consequences. The outbreak of conflict involving Iran destabilised global energy supply chains, reigniting cost-push inflation across developed economies at precisely the moment the Fed had been expected to pivot dovish. Rather than cutting rates, the Federal Reserve has held the federal funds rate at 3.50–3.75% with no reductions projected until mid-2027 at the earliest.
The market has absorbed this shift aggressively. According to CME FedWatch Tool data, financial markets are now pricing in a greater than 70% probability of a formal interest rate hike by September 2026. Michael Widmer, Head of Metals Research at Bank of America, has noted that this elevated probability of additional rate increases correlates directly with gold's correction from its January peak, with the tightening cycle estimated to reduce the commodity's near-term upside potential by approximately 50%.
Gold has responded predictably. From its January 2026 high above $5,400/oz, the price has corrected to approximately $4,502/oz, representing a drawdown of roughly 17%. For investors anchored to near-term price targets, this correction appears alarming. For those familiar with how gold behaves across monetary cycles, the move is considerably less surprising.
The critical distinction here is between a forecast revision and a forecast abandonment. BofA has revised the timeline for its $6,000/oz target while explicitly maintaining the target itself. These are fundamentally different signals.
What BofA's Two-Tier Forecast Structure Actually Communicates
The Numbers Behind the Position
Bank of America's current gold forecast is structured across two distinct time horizons, and understanding both is essential for interpreting the bank's actual conviction level. BofA's analysis provides a comprehensive view of these projections.
| Forecast Metric | BofA Position | Context |
|---|---|---|
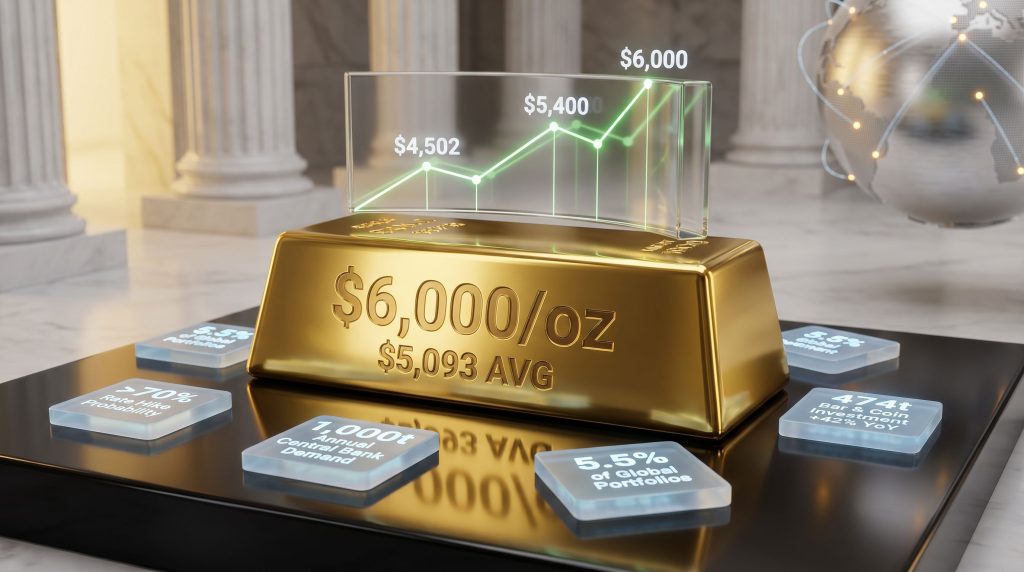
| 12-Month Price Target | $6,000/oz | Maintained despite near-term headwinds |
| 2026 Full-Year Average Forecast | $5,093/oz | Revised upward from $4,988/oz |
| Current Spot Price | ~$4,502/oz | ~17% below January 2026 peak |
| Rate Hike Probability (Sept 2026) | >70% | Per CME FedWatch Tool |
| Estimated Near-Term Upside Reduction | ~50% | Due to tightening cycle repricing |
| Fed Funds Rate (Current Hold) | 3.50–3.75% | No cuts expected until mid-2027 |
The most counterintuitive element of BofA's current positioning is that even as the bank acknowledged near-term obstacles, it simultaneously raised its 2026 full-year average gold forecast from $4,988/oz to $5,093/oz. This is not the behaviour of an institution abandoning its thesis. It reflects a conviction that the structural price floor has risen, even if the ceiling is temporarily constrained by monetary conditions.
This two-tier approach — separating a near-term cyclical headwind from a medium-term structural target — is a sophisticated analytical framework that many retail investors misread as contradiction. In institutional research, raising an annual average whilst flagging short-term risk is a signal of disciplined confidence, not confusion.
The Underinvestment Argument: Gold's Structural Ceiling
One of the less widely discussed elements of BofA's structural case is the observation that total physical and paper gold investments currently represent only 5.5% of aggregate global equity and fixed-income markets. This figure is striking given gold's historical role as a portfolio diversifier and crisis hedge.
The implication is that gold remains structurally underweighted in institutional portfolios globally. BofA has pointed to a potential transition toward a 60:20:20 asset allocation model (equities, bonds, and alternatives including gold) as a significant latent demand catalyst. Once rate-hike expectations are fully absorbed by markets, even a marginal reallocation at institutional scale would represent hundreds of billions of dollars in incremental gold demand.
The Four Structural Pillars Keeping the $6,000 Target Alive
1. U.S. Fiscal Deterioration as a Currency Debasement Signal
The United States fiscal deficit is running at approximately 6% of GDP, a level that historically correlates with long-term currency purchasing power erosion. Sustained deficit spending at this magnitude creates conditions where hard assets with finite supply, particularly gold, attract increasing allocations as a store of value.
Compounding this, foreign holdings of U.S. Treasuries have been on a documented declining trend. The combination of elevated deficit spending and reduced foreign appetite for U.S. government debt creates structural pressure on the dollar that cannot be resolved by a single tightening cycle.
2. De-Dollarisation Within Global Reserve Structures
The shift away from U.S. dollar-denominated reserve assets is no longer a speculative narrative. According to the latest central bank gold survey, 74% of institutional respondents project a moderate-to-significant reduction in U.S. dollar allocations within their reserve structures over the next five years. Furthermore, central bank gold demand shows sovereign reserve managers are systematically reallocating toward hard commodity stores of value, with gold representing the most liquid and widely accepted alternative.
This is a multi-year, multi-institution structural demand driver that operates independently of any single rate cycle.
3. Central Bank Accumulation at Generational Highs
Global central banks have averaged 1,000 tonnes of annual gold purchases over the trailing four-year period. This represents a 100% increase from the 500-tonne annual average of the preceding decade, and the trajectory shows no sign of reversing.
The World Gold Council's Central Bank Gold Reserves Survey reinforces this outlook:
- 90% of reserve managers cited gold's historical performance during crises as highly relevant to their allocation decisions.
- 89% expect global central bank gold reserves to increase over the next 12 months.
- 84% project gold will occupy a moderately or significantly higher share of global reserve portfolios within five years.
These are not speculative projections. They represent stated intentions from the institutions with the largest and most stable gold purchasing mandates on earth.
4. Mine Supply Constraints and Rising Production Economics
The global gold mining industry faces a structural supply problem that is rarely discussed in macro gold analysis but is critically important to long-term price dynamics. Rising input costs, energy price inflation, increasingly complex ore bodies at existing mines, and lengthening timelines for new project development all constrain the industry's ability to rapidly expand output in response to price signals.
Unlike many commodities where higher prices quickly incentivise new supply, gold mine development operates on decade-long timelines from discovery to production. A mine discovered today will not deliver meaningful output until the mid-2030s. This supply inelasticity creates a structural floor beneath gold prices that demand-side pressures can build upon without the threat of rapid supply-side neutralisation.
The combination of a structurally constrained supply side and a demand side driven by sovereign accumulation at record levels creates conditions that a single tightening cycle cannot fundamentally alter.
Q1 2026 Demand Trends: A Market Bifurcating Along Investment Lines
The Record Valuation Story
World Gold Council data from the Q1 2026 Gold Demand Trends report reveals a market undergoing a significant structural rebalancing. Total quarterly gold demand reached 1,231 tonnes, up 2% year-on-year in volume terms. However, the financial value of that demand surged 74% year-on-year to a record US$193 billion, reflecting the elevated price environment rather than a volume explosion.
Jewelry Contraction Versus Investment Acceleration
The most analytically important feature of Q1 2026 demand data is the sharp divergence between discretionary and investment demand categories.
| Demand Category | Q1 2026 Volume | Year-on-Year Change |
|---|---|---|
| Global Jewelry Consumption | 300 tonnes | -23% |
| China Jewelry Demand | Subset of above | -32% |
| India Jewelry Demand | Subset of above | -19% |
| Global Bar and Coin Investment | 474 tonnes | +42% |
| China Retail Bar Investment | 207 tonnes (quarterly record) | +67% |
| Physically Backed Gold ETF Flows | +62 tonnes net inflow | Positive for quarter |
| Asian-Listed ETF Accumulation | +84 tonnes | Offset U.S. ETF outflows |
The interpretation of this data reveals an important behavioural dynamic. Elevated prices are suppressing discretionary jewelry purchases in volume-sensitive markets like China and India, where gold jewelry functions partly as a cultural store of value and partly as a consumer product. When prices exceed psychological thresholds, gift-giving and adornment purchases decline.
Simultaneously, the same elevated prices are amplifying investment urgency. Chinese retail investors recorded a quarterly record of 207 tonnes in bar and coin purchases during Q1 2026. This is not consumer behaviour. This is a population treating physical gold as a financial instrument, specifically as a hedge against domestic economic uncertainty and currency risk.
The ETF picture adds further nuance. Asian-listed gold ETFs accumulated 84 tonnes during the quarter, more than absorbing late-quarter tactical outflows from U.S.-listed portfolios. The geographic centre of gravity for gold demand is continuing to shift eastward, a trend with significant long-term implications for how gold prices are set and who holds pricing influence.
Scenario Analysis: Pathways to $6,000
Scenario 1: Fed Pauses After a Single Additional Hike (Base Case)
The rate hiking cycle peaks at one additional move by September 2026. Inflation moderates through the second half of the year as energy supply disruptions stabilise. Gold finds a floor above $4,500/oz and begins a recovery trajectory into early 2027. Gold safe-haven demand and ETF inflows from Asian markets provide a structural bid throughout the correction period. The $6,000 target becomes achievable within a 12 to 18 month window.
Scenario 2: Extended Tightening Through December 2026
Multiple rate hikes compress gold's near-term upside materially. Gold trades in a constrained range of $4,200 to $4,600/oz for an extended period. The structural drivers remain fully intact but are temporarily masked by rate-driven selling pressure. The $6,000 target timeline extends beyond 12 months, but the thesis is not invalidated. This is the scenario BofA's structural case is explicitly designed to survive.
Scenario 3: Geopolitical Escalation Triggers Safe-Haven Demand
Further deterioration in Middle Eastern energy corridors or the emergence of new geopolitical flashpoints overrides rate-driven selling pressure with acute safe-haven flows. Gold spikes toward $5,000 to $5,400/oz on risk-off demand. The timeline toward the $6,000 target accelerates materially. This scenario cannot be modelled with precision, but historical precedent confirms that geopolitical shock events have repeatedly driven gold above fair-value estimates in the near term.
The next major ASX story will hit our subscribers first
Central Bank Architecture: How Sovereign Demand Is Reshaping Market Structure
The Domestic Purchase Programme Trend
One of the least widely reported developments in global gold markets is the growing adoption of domestic gold purchase programmes by emerging market central banks. According to World Gold Council survey data, 50% of all central bank respondents now utilise a domestic purchase programme denominated in local currency to build gold reserves. Within emerging market and developing economies specifically, 53% have implemented this mechanism.
This trend is structurally significant for several reasons:
- Domestic programmes bypass international gold market infrastructure, creating demand channels that do not register in traditional Western financial market flow data.
- Local currency purchases reduce the foreign exchange cost of reserve building, making gold accumulation more accessible for central banks with constrained hard currency reserves.
- These programmes create a direct link between domestic gold mining production and sovereign reserve accumulation, incentivising mining sector development in producing nations.
The Benchmark Gap as a Multi-Decade Demand Runway
The established gold reserve benchmarks set by developed economies provide important context for understanding why emerging market demand is structural rather than cyclical. The World Gold Council's 2026 outlook further reinforces this perspective.
| Country | Official Gold Reserves |
|---|---|
| United States | 8,133.5 tonnes |
| Germany | 3,350.3 tonnes |
Most emerging market central banks hold gold reserves that represent a fraction of these benchmarks as a percentage of total reserves. The gap between current EMDE holdings and developed-market reserve compositions represents a multi-decade structural demand runway. Even incremental progress toward developed-market reserve ratios across dozens of emerging economies would represent sustained additional demand at the scale of hundreds of tonnes annually.
How the Current Correction Compares Historically
Gold's approximately 17% drawdown from its January 2026 peak is significant in absolute terms but historically unremarkable within the context of structural bull markets interrupted by monetary tightening. The 2013 taper tantrum produced a far more severe correction, with gold falling approximately 28% in a matter of months before recovering and eventually establishing a higher structural base.
The 2022 Federal Reserve hiking cycle, the most aggressive in four decades, produced a correction of approximately 20% from peak to trough before gold resumed its upward trajectory. The critical distinction in each historical case was not the severity of the correction but rather the integrity of the structural demand thesis during the downturn.
In the current cycle, with central bank purchases running at double their prior-decade average and de-dollarisation trends accelerating, the structural thesis is arguably stronger than it was during either previous episode. Consequently, gold and mining equities are increasingly viewed as a compelling proposition at current valuations.
For investors with a 12-month or longer investment horizon, BofA's framing of the current price level as a potential accumulation window rather than a trend reversal aligns closely with how gold has historically behaved following rate-driven corrections from elevated bases.
Key Takeaways for Investors Navigating the BofA Gold Thesis
- The $6,000/oz target remains intact but has been time-shifted by the Fed's hawkish pivot, not abandoned.
- BofA raised its 2026 average forecast to $5,093/oz even whilst flagging near-term headwinds, a signal of underlying structural conviction.
- A greater than 70% probability of a September 2026 rate hike represents the primary near-term obstacle, estimated to reduce short-term upside by approximately 50%.
- Central bank accumulation at 1,000 tonnes per year, de-dollarisation trends, U.S. fiscal deterioration at 6% of GDP, and constrained mine supply all remain structurally intact.
- Q1 2026 demand data shows jewelry contracting sharply whilst investment demand surges, with China recording a quarterly record of 207 tonnes in retail bar purchases.
- Gold representing only 5.5% of global investment portfolios points to a substantial structural underweight with significant reallocation potential once rate pressures normalise.
This article contains analysis of publicly available financial research, economic data, and market forecasts. All forward-looking statements and price targets discussed herein are sourced from institutional research and should not be construed as personal investment advice. Past performance of any asset class is not indicative of future results. Investors should seek independent financial advice before making investment decisions.
Want To Know When the Next Major ASX Gold Discovery Hits the Market?
Discovery Alert's proprietary Discovery IQ model scans ASX announcements in real time, delivering instant alerts on significant mineral discoveries — including gold — so subscribers can act on actionable opportunities before the broader market reacts. Explore how historic discoveries have generated substantial returns on Discovery Alert's dedicated discoveries page, and begin your 14-day free trial today to position yourself ahead of the next major find.