July 29, 2026
The Invisible Hand Moving Gold: How Expectation Anchoring Shapes Price Reality
Most investors learn a simple rule early: inflation rises, gold rises. It feels intuitive. Hard assets protect against the erosion of paper money. So when the Bureau of Economic Analysis confirmed that the Personal Consumption Expenditures price index climbed to 4.1% year-over-year in May 2026, the highest reading since April 2023, the textbook response seemed obvious. Gold should have surged. Understanding why did gold go up after PCE 4.1% requires a deeper look at market mechanics.
Instead, gold had already spent the better part of two weeks falling. And then, on the morning the hot inflation data was officially confirmed, it went up.
Understanding why this happened is not a matter of trivia. It is one of the most practically useful concepts in commodity investing, and it separates investors who hold through volatility from those who sell into it at exactly the wrong moment.
When big ASX news breaks, our subscribers know first
What the PCE Actually Measures and Why the Fed Watches It Closely
PCE vs. CPI: Not the Same Inflation Gauge
Many investors treat the Consumer Price Index and the PCE index as interchangeable. They are not. The CPI measures what consumers pay for a fixed basket of goods. The PCE measures what consumers actually spend, adjusting its basket dynamically as purchasing behaviour shifts. This makes PCE more reflective of real-world consumption patterns over time.
The Federal Reserve has formally anchored its 2% inflation target to the PCE index rather than CPI, which means PCE readings carry direct policy implications in a way that CPI does not. When PCE runs above target, the Fed's mandate pushes toward tighter monetary conditions. Furthermore, understanding gold and bond dynamics helps clarify how these policy signals ripple through markets simultaneously.
The May 2026 Data in Context
| Metric | May 2026 Reading | Prior Month | Fed Target | Consensus Estimate |
|---|---|---|---|---|
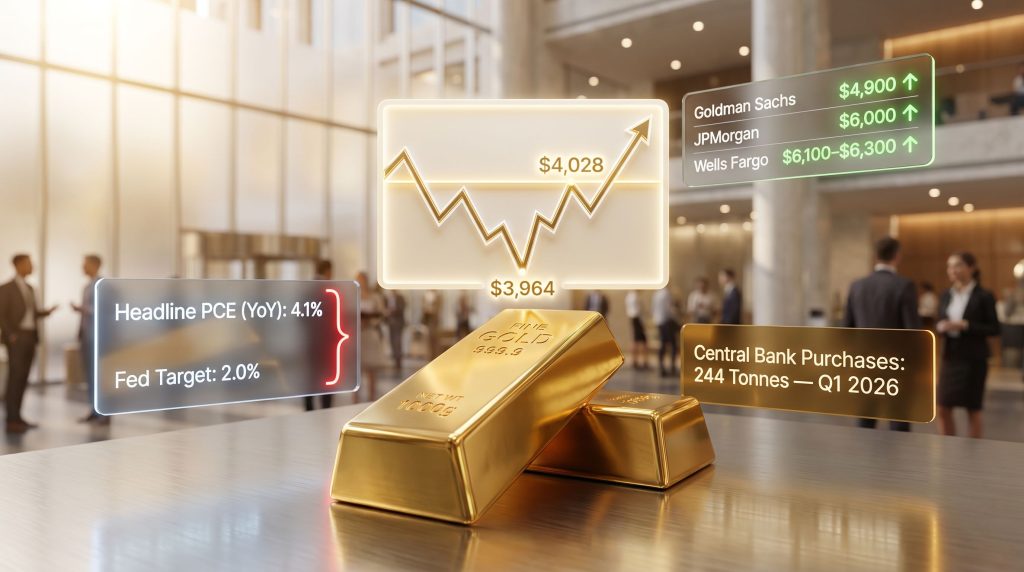
| Headline PCE (YoY) | 4.1% | ~3.8% | 2.0% | ~4.1% |
| Core PCE (YoY) | 3.4% | 3.3% | 2.0% | ~3.4% |
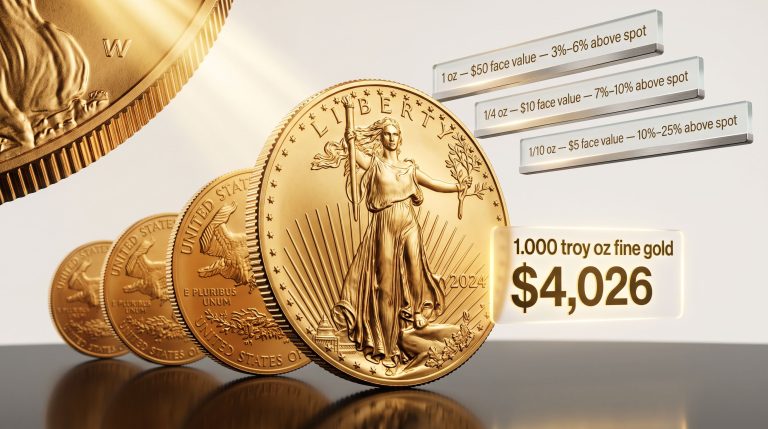
| Gold Spot (Pre-Data) | ~$3,980 | |||
| Gold Spot (Post-Data) | ~$4,028 |
Both the headline and core readings landed precisely in line with the Dow Jones consensus. That alignment, unremarkable on the surface, turned out to be the most important feature of the entire release.
Key context: A 4.1% PCE headline represents a policy gap of more than double the Federal Reserve's stated objective. Yet gold moved higher on the release. The mechanism behind this apparent contradiction sits at the heart of how modern financial markets process information.
Why Did Gold Go Up After PCE Came in at 4.1%? The Expectation Gap Explained
Markets Reprice Before Events, Not During Them
The phrase priced in gets used frequently in financial commentary, but its mechanics are rarely spelled out. Here is how the sequence actually works in commodity markets:
- A risk scenario becomes identifiable and probable, based on forward-looking signals such as central bank guidance or economic projections.
- Futures traders, macro hedge funds, and ETF managers adjust their positioning in the days and weeks before the confirming data arrives.
- The asset price moves to reflect the anticipated outcome while the uncertainty is still unresolved.
- When the data is released and confirms the anticipated scenario without exceeding it, there is no new information for marginal sellers to act upon.
- With selling pressure exhausted, structural buyers reassert dominance and the price recovers.
This is precisely what occurred in the gold market between mid-June and June 25, 2026. According to analysis from GoldSilver, the relationship between PCE data and gold pricing reflects this expectation gap in a highly consistent pattern.
The June 17 FOMC Meeting Was the Real Catalyst
The actual trigger for gold's decline was not the PCE report. It was the Federal Reserve's June 17, 2026 meeting, the first chaired by Kevin Warsh. At that meeting, nine of eighteen FOMC members who submitted economic projections indicated support for at least one rate hike during 2026, according to the Federal Reserve's Summary of Economic Projections released that day.
The market reaction was immediate and significant:
- The U.S. Dollar Index surged above 101, reaching its strongest level since May 2025.
- Gold fell from above $4,100 to a seven-month low of $3,964 by June 24, 2026.
- By the morning of the PCE release, the CME FedWatch Tool placed the probability of a September rate hike at 68%, already embedded in gold's price.
By the time the PCE data dropped, gold at approximately $3,980 had already absorbed a substantial hawkish risk premium. The data confirmed the feared scenario. It did not worsen it.
The No-Worse-Than-Feared Trigger in Practice
When an inflation print matches expectations precisely, it creates what traders sometimes describe as a neutral-to-positive outcome for a market that has been selling off into the event. The marginal seller, who positioned short or reduced exposure based on fear of an upside inflation surprise, has no new information to justify further selling.
The dollar eased modestly following the release as the risk of an upside inflation shock dissipated. Treasury yields slipped slightly. Both moves removed headwinds that had been pressing gold lower throughout the preceding week. Consequently, gold recovered above $4,000 on the same morning that the government confirmed inflation was running at its fastest pace in over three years.
Why did gold go up after PCE hit 4.1%? Because the market had already priced in a hawkish outcome over the prior two weeks, pushing gold from above $4,100 to a seven-month low of $3,964. When the 4.1% reading confirmed rather than exceeded those fears, sellers had no new catalyst. Structural buyers returned, and gold recovered above $4,000. The data was hot. The surprise was not. (Source: Bureau of Economic Analysis, Personal Income and Outlays, May 2026; CME Group FedWatch Tool, June 2026)
The Two Gold Markets Operating Simultaneously
Rate-Sensitive Paper Traders vs. Structural Physical Buyers
One of the least understood features of the gold market is that two fundamentally different buyer groups operate within it simultaneously, responding to identical macro data in opposite and sometimes contradictory ways.
| Participant Type | Time Horizon | Primary Driver | Reaction to 4.1% PCE |
|---|---|---|---|
| Futures traders and macro hedge funds | Days to weeks | Rate-cycle positioning | Sold ahead of data; covered after in-line print |
| ETF managers | Weeks to months | Rate expectations and fund flows | Reduced exposure during pre-FOMC selloff |
| Central bank reserve managers | Decades | Reserve diversification and currency risk | Continued accumulation regardless of data |
| Physical retail investors | Years to decades | Inflation protection and wealth preservation | No structural change in holdings |
Central Bank Demand as the Structural Demand Floor
While paper markets were repricing rate-hike risk throughout June, sovereign reserve managers were doing something entirely different. According to the World Gold Council's Gold Demand Trends report for Q1 2026, global central banks purchased a net 244 tonnes of gold during that quarter alone, up from 208 tonnes in Q4 2025.
Central bank gold demand has become one of the most powerful structural forces underpinning prices. China's People's Bank extended its gold reserve additions to 19 consecutive months of net purchases by mid-2026. Furthermore, the World Gold Council's 2026 survey found that a record 45% of institutions indicated plans to increase their gold allocations over the coming year.
These buyers do not operate on the same informational timeline as futures traders. Their mandate is structural reserve diversification and currency risk management across multi-decade horizons. A quarterly PCE reading that confirms an already-anticipated rate move does not alter their allocation framework.
The practical effect is that sustained paper-market selling creates a mechanical dynamic where central bank buyers increase their volume of physical purchases at lower prices. Each significant price decline invites greater sovereign demand, creating an asymmetric downside protection effect that purely rate-focused analysis misses entirely.
A less commonly recognised insight: Approximately 298 tonnes of gold held within ETFs was sitting at a loss at June 2026 price levels, creating a structural ceiling on near-term paper-market recovery. Yet central banks, unmoved by short-term pricing, continued accumulating at the same pace. The same metal. Two entirely different investment realities operating in parallel.
What Persistent Inflation at 4.1% Means for the Long-Term Gold Thesis
Purchasing Power Erosion Is Not a Narrative, It Is Arithmetic
At a 4.1% annual PCE inflation rate, a portfolio held entirely in dollar-denominated cash instruments loses approximately 4.1% of its real purchasing power per year. The compounding effect over five to ten years is substantial, and it operates regardless of whether the Federal Reserve raises rates by 25 or 50 basis points in any given meeting.
The conventional framework holds that rising interest rates are negative for gold because they increase the opportunity cost of holding a non-yielding asset. This logic is sound, but it applies most forcefully when rate increases exceed the inflation rate, producing meaningfully positive real yields. When inflation runs above the nominal policy rate, real yields remain suppressed or negative, and the inflation hedge role of gold remains structurally intact.
At 4.1% PCE with the Fed's policy rate below that level, the real rate environment in mid-2026 continued to favour assets with intrinsic scarcity. Historical precedent supports this: during the extended inflation cycles of the 1970s and during portions of the early 2000s, gold delivered positive returns during rate-hiking phases when inflation outpaced the pace of monetary tightening.
The Constraint That Limits the Fed's Rate Response
A speculative but increasingly discussed consideration in institutional research circles involves the Federal Reserve's operational room to raise rates aggressively. At current levels of US government debt, each percentage point increase in the policy rate materially increases federal debt-servicing costs. This constraint may limit the Fed's willingness or ability to raise rates high enough to produce genuinely positive real yields, even if inflation remains elevated.
If that constraint proves binding, the real yield environment that supports gold could persist well beyond what a conventional rate-hiking cycle might suggest. The broader gold price drivers at play in 2025 and 2026 point consistently toward this structural dynamic.
This remains a speculative scenario and should not be treated as a forecast. Investors should consult qualified financial advisers before making allocation decisions.
Major Institutional Price Targets After the PCE Release
Where the Largest Banks See Gold Heading
| Institution | Year-End 2026 Target | Primary Rationale | Implied Upside from ~$4,028 |
|---|---|---|---|
| Goldman Sachs | $4,900 | Revised down $500 after removing 2026 rate cuts from model (June 19, 2026) | ~+22% |
| JPMorgan | $6,000 | Central bank demand prioritised over near-term rate moves | ~+49% |
| Wells Fargo | $6,100–$6,300 | Structural debasement and reserve diversification thesis | ~+51–56% |
(Sources: Goldman Sachs Global Research, June 19, 2026; J.P. Morgan Global Research, May 2026)
The Goldman Sachs revision is worth examining carefully. The bank lowered its year-end target by $500 after explicitly removing all 2026 rate-cut assumptions from its forecasting model, yet the revised floor of $4,900 still implies approximately 22% upside from the post-PCE recovery price near $4,028. The downward revision reflected a more hawkish rate path, but the directional thesis remained intact.
The $1,200 spread between Goldman's floor and Wells Fargo's ceiling reflects genuine analytical disagreement about which factor will dominate, rate sensitivity or structural central bank demand. That disagreement is itself informative: it signals that the market has not reached consensus on the primary price driver, which historically corresponds to periods of sustained volatility rather than directional resolution. Reuters reporting from June 25, 2026 reinforced this picture, noting how dollar strength continued to create complex crosscurrents for gold pricing throughout the period.
The next major ASX story will hit our subscribers first
Physical Gold vs. Paper Gold: Why the Same Selloff Means Different Things
Three Risks That Apply Exclusively to Paper Gold Instruments
- Margin call risk: Leveraged futures positions face forced liquidation when prices decline below maintenance margin levels, regardless of the holder's long-term investment conviction or the fundamental case for the asset.
- Fund redemption risk: When ETF investors panic-sell during a price decline, fund managers are obligated to liquidate underlying holdings at depressed prices to meet redemptions, amplifying the selling pressure.
- Counterparty risk: All paper gold instruments, whether futures contracts, ETFs, or structured products, depend on the financial solvency and operational integrity of the issuing or managing institution. Physical gold carries none of this dependency.
How to Interpret a Screen Price Decline as a Physical Holder
The decline from above $4,100 to $3,964 between mid-June and June 24, 2026 was a paper-market repricing of rate-hike expectations. It was not a change in gold's physical scarcity, its absence of counterparty risk, its function as a reserve asset, or its millennia-long role as a store of value. Physical holders experienced no change in the quantity or nature of what they owned during that period.
This distinction matters most precisely when paper markets are loudest. Choosing between physical gold vs ETFs is consequently one of the most consequential decisions a gold investor can make, and it shapes the experience of exactly these kinds of volatile periods. Understanding that a price event driven by futures positioning is categorically different from a structural event helps separate patient holders from panic sellers.
Frequently Asked Questions: Gold, PCE, and Market Mechanics
Does High Inflation Always Push Gold Higher Immediately?
Not in the short term, and not mechanically. Gold's response to an inflation print depends almost entirely on whether that reading changes market expectations or confirms them. When inflation surprises to the upside relative to consensus, the dollar tends to strengthen, rate-hike odds rise, and gold often faces selling pressure. When inflation meets or falls short of expectations, as occurred with the 4.1% May PCE reading, the marginal seller loses their catalyst and structural demand reasserts.
Why Was Gold Already Falling Before the PCE Report?
The FOMC meeting on June 17, 2026, not the PCE data, was the actual catalyst for gold's decline. Nine of eighteen FOMC members projected at least one 2026 rate hike, the dollar surged above 101 on the DXY, and traders spent the following week repricing gold to reflect a 68% September rate-hike probability. By the time the PCE data arrived, that risk was already embedded in the price.
What Is the Relationship Between the US Dollar and Gold?
Gold is priced globally in US dollars, so a stronger dollar makes gold more expensive in every other currency, mechanically reducing international demand. The DXY surging above 101 post-FOMC was a direct headwind for gold. When the PCE release produced no upside inflation surprise, the dollar's upward momentum faded, removing that headwind and allowing gold to recover.
Is Gold Still a Relevant Inflation Hedge When Rates Are Rising?
The hedging case for gold is strongest when real yields, the nominal rate minus inflation, remain low or negative. With PCE running at 4.1% and the policy rate below that level in mid-2026, the real yield environment continued to favour assets with intrinsic scarcity. The short-term headwind from rate-hike expectations is real. The long-term purchasing power erosion argument, operating at 4.1% annually, does not pause during FOMC meetings.
This article is for informational and educational purposes only. It does not constitute financial or investment advice. Past performance is not indicative of future results. Readers should consult a qualified financial adviser before making any investment decisions.
Want to Stay Ahead of the Next Major Mineral Discovery on the ASX?
While gold markets navigate inflation data and rate expectations, Discovery Alert's proprietary Discovery IQ model delivers real-time alerts on significant ASX mineral discoveries — instantly cutting through complex data to surface actionable opportunities for both short-term traders and long-term investors. Explore historic discoveries and their remarkable returns, then begin your 14-day free trial at Discovery Alert to position yourself ahead of the market.