June 15, 2026
The Seasonal Clock That Governs Gold Prices
Every major financial market carries embedded rhythms shaped by human behaviour, and gold is no exception. Unlike equities, which follow earnings cycles and central bank meeting calendars, gold's seasonal pulse is anchored to something more primal: the annual ebb and flow of cultural celebrations, income cycles, and institutional rebalancing windows that collectively generate demand surges at predictable points each year.
Understanding this rhythm is arguably one of the most underappreciated edges available to long-term precious metals investors. And within this rhythm, one period stands apart for its distinctive lack of catalysts: the gold summer doldrums.
When big ASX news breaks, our subscribers know first
What the Gold Summer Doldrums Actually Mean
The phrase itself originates from maritime history. The doldrums describe an equatorial ocean zone where hot air perpetually rises, creating persistent low-pressure conditions with almost no wind. Sailing ships could be stranded in this zone for days or weeks, depleting their provisions while making no progress. The psychological toll on crews was severe, often leading to conflict and despair.
The parallel to gold markets during early summer is remarkably fitting. As northern hemisphere populations shift their attention toward leisure and holidays, trading volumes thin, institutional desks are understaffed, and the sustained engagement required to push gold meaningfully higher simply evaporates. The result is not usually a crash, but something arguably more demoralising for traders: directionless, grinding sideways action that slowly erodes patience and confidence.
The gold summer doldrums are most concentrated in June and early July, with the seasonal weakness typically bottoming in late June. By mid-July, history suggests the pattern begins to reverse as the building blocks of gold's autumn rally start to accumulate.
Why Summer Specifically Lacks Demand Catalysts
Gold's strength in other parts of the year is well-documented and structurally grounded:
- Autumn: Indian wedding season and Diwali drive substantial physical gold demand across South Asia, while Western investors returning from summer begin portfolio repositioning.
- Winter: Chinese New Year preparations lift demand across East Asia, coinciding with year-end portfolio diversification flows.
- Spring: Post-Chinese New Year restocking and broader global jewellery demand keep prices supported into early June.
Summer, by contrast, sits in the longest gap between these recurring demand surges. There is no equivalent cultural or income-driven catalyst. This absence is the structural foundation of the gold summer doldrums pattern. Furthermore, as Kitco's analysis of summer gold prices illustrates, seasonal price softness during this period has been a consistent and observable feature across multiple market cycles.
Quantifying the Seasonal Effect: Data Across 22 Bull Market Years
Any serious analysis of gold's seasonal patterns must account for the extraordinary range of gold prices over recent decades, from approximately $257 per ounce in April 2001 to over $5,000 in early 2026. Comparing raw price movements across such a wide range is statistically meaningless, which is why analysts index each year's summer price action to 100 at the final close of May. This converts everything into comparable percentage terms.
Crucially, this analysis applies only to bull market years. The 2013 to 2015 secular bear, during which gold declined approximately 41.3%, represents a fundamentally different technical environment where seasonal patterns carry little predictive weight. Isolating the 22 bull market years between 2001 and 2026 produces a much cleaner and more analytically valid dataset.
Monthly Performance: Gold and Gold Miners During Summer
| Period | Average Gold Price Change | Average Gold Miner Stock Change |
|---|---|---|
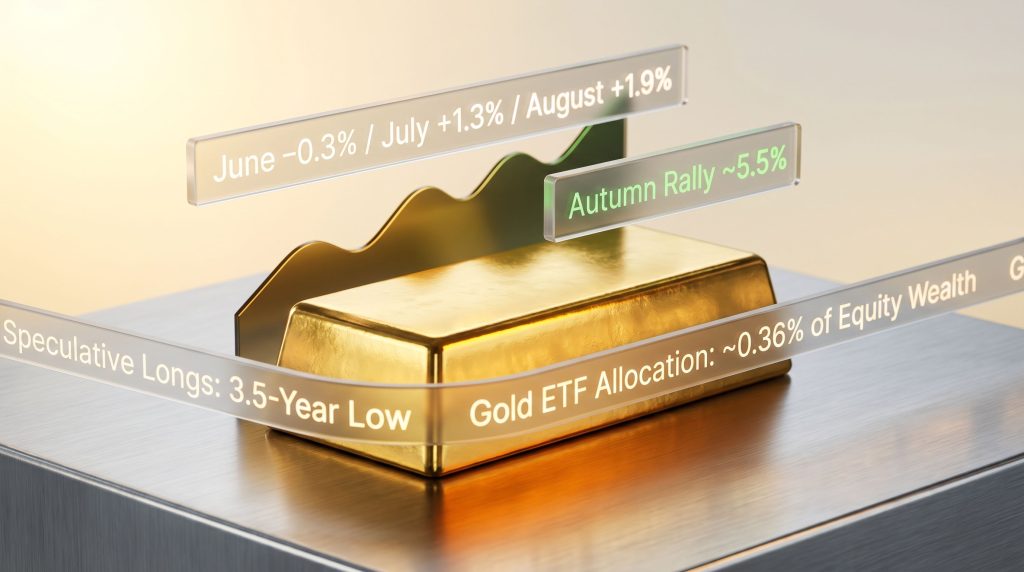
| June | -0.3% | +0.4% |
| July | +1.3% | +1.4% |
| August | +1.9% | +3.2% |
| Seasonal Low (late June) | -0.6% from May close | -1.5% from May close |
| Autumn Rally (to late Sept.) | +5.5% | Proportionally amplified (2x-3x) |
| Winter Rally (to late Feb.) | +7.9% | Proportionally amplified |
| Spring Rally (to early June) | +4.3% | Proportionally amplified |
Two things stand out immediately. First, the average summer decline is genuinely shallow: a 0.6% peak-to-trough drawdown from May's close to the late-June seasonal low is not the dramatic collapse that the phrase "doldrums" might suggest. Second, the seasonal weakness is heavily compressed into June and very early July. By August, gold is already in positive territory on average, transitioning into the early stages of its autumn rally.
The gold summer doldrums are less a period of significant price destruction and more a pause in momentum, a seasonal consolidation phase that historically resolves to the upside with consistent regularity across modern bull market cycles.
Why Critics Are Not Entirely Wrong
Sceptics of seasonal analysis in gold markets raise legitimate methodological concerns. The sample size of 22 years, while meaningful, is not enormous. More importantly, macro shocks, currency crises, and geopolitical disruptions can and do override seasonal tendencies in specific years. The seasonal pattern is a probabilistic tendency derived from historical averages, not a mechanical guarantee. Any trader treating it as the latter is misapplying the analysis.
That said, when seasonal tendencies align with supportive macro and technical conditions, the combined signal carries substantially more weight. For a broader perspective on how these tendencies manifest, Sprott's summer doldrums research offers additional context on the historical consistency of this seasonal pattern across precious metals.
Why the 2026 Gold Summer Doldrums Setup Is Structurally Different
The context entering the 2026 summer doldrums is unlike almost any prior year in the dataset. To understand why, it is necessary to first appreciate the magnitude of what preceded it.
Gold's most recent cyclical bull run recorded gains of approximately 196% over 27.8 months, the largest cyclical bull in dollar terms on record, without experiencing a single correction exceeding 10% throughout that entire advance. The January 2026 terminal peak, near a record closing price of $5,394 per ounce, saw gold trading approximately 43.4% above its 200-day moving average, a level of technical overextension not recorded since March 1980, nearly 46 years earlier.
Such extremes historically demand rebalancing. A subsequent decline of approximately 18.6% over 1.8 months brought gold to a low near $4,390, broadly consistent with historical precedent following similar overextended bull runs. The ten largest prior cyclical gold bulls averaged subsequent drawdowns of approximately 20.8% over 2.1 months, making the 2026 correction within the expected range rather than an aberration.
The Technical Reset That Changes the Risk Profile
By early June 2026, gold had retreated to just 1.1% above its 200-day moving average, representing its least technically stretched position in approximately 2.6 years. This is a critical distinction from most prior summer doldrums setups.
Historical data from these 22 bull market years suggests an inverse relationship between the degree of technical overextension entering June and the severity of the subsequent summer decline. Put differently: the more froth that has been cleared before summer begins, the shallower the doldrums tend to be and the stronger the subsequent autumn rally typically proves. Entering 2026's summer doldrums with nearly all of January's speculative excess cleared represents a materially more constructive setup than entering summer at peak overextension. The gold price forecast for the remainder of the year consequently appears supportive once this technical reset is factored in.
The Geopolitical Distortion: Gold's Backward War Trade
One of the most analytically interesting dynamics of 2026's gold market is that the metal has been behaving in a manner that inverts conventional safe-haven logic. Historically, geopolitical escalation, particularly involving major oil-producing regions, drives gold higher as investors seek refuge. In the current cycle, gold has been declining when US-Iran hostilities intensify and rallying when peace negotiations appear to progress.
This anomalous behaviour originated in mid-March 2026, triggered by heavy central bank gold demand reversals led by Turkey. The background is important: Turkey imports approximately 90% of its crude oil and petroleum products, making it acutely vulnerable to any Middle East conflict affecting energy supply. Persistent inflation and a chronically weakening lira had already placed extreme pressure on Turkish monetary authorities. The decision to liquidate gold reserves to support the currency caused gold to decline approximately 14.9% across just eight trading sessions, an unusually sharp move that reshaped short-term market psychology around the conflict.
The Inflation Signal Markets Are Currently Ignoring
The long-term implications of an effectively closed Strait of Hormuz are not subtle. The strait handles approximately one-fifth of global oil and LNG trade and roughly one-third of global seaborne fertiliser trade. The inflationary consequences of sustained disruption to these flows are not speculative; they are mathematically inevitable once energy stockpile buffers are exhausted.
Historical precedent provides context for the scale of this risk. During the 1970s oil shock, a supply disruption considerably smaller in relative terms than the current one, gold as inflation hedge properties were demonstrated clearly, with gold appreciating approximately 24.3 times over a decade. Gold's annual mined supply grows at roughly 1% per year, meaning its production cannot be meaningfully scaled up in response to rising prices the way other commodities can. This structural supply inelasticity means gold prices tend to at least match and often materially exceed inflation over extended periods.
The current market dynamic, in which ongoing Strait of Hormuz disruption is being treated as a near-term bearish signal for gold, is likely a temporary distortion anchored to Turkey's currency intervention rather than a durable reassessment of gold's inflation-hedge properties.
Futures Positioning: The Hidden Contrarian Signal
Gold's short-term price action is frequently dominated by speculative positioning in the futures market, where leverage amplifies both upward and downward moves. When speculative long contracts (upside bets) are concentrated at high levels, gold becomes vulnerable to sharp reversals as those positions unwind. Conversely, when spec longs reach multi-year lows, the market has effectively reset its positioning base, creating substantial capacity for the next accumulation cycle.
As of early June 2026, total speculative long contracts in gold futures stood at approximately 247,900 contracts, representing a 3.5-year secular low in bullish positioning. The last time spec longs were this low was late November 2022, when gold was trading near $1,749 per ounce, well before the subsequent bull run had even started.
This positioning dynamic is among the most constructive indicators for gold heading into and out of the 2026 summer doldrums. Speculators have an unusually large capacity to re-enter long positions, and when they do, their activity tends to accelerate price gains disproportionately given the embedded leverage in futures markets.
The next major ASX story will hit our subscribers first
The American Investor Allocation Gap: A Structural Demand Catalyst
Current Exposure Is Historically Negligible
| Metric | Current Level | Implication |
|---|---|---|
| Physical gold in US ETFs (GLD, IAU, GLDM) | ~$244.8 billion | Historically low vs. equity wealth |
| Gold ETF holdings as % of S&P 500 market cap | ~0.36% | Effectively one-third of one percent |
| Typical diversified portfolio gold allocation | 5-10% | Implies massive structural underallocation |
American investors have, for the past several years, been heavily concentrated in technology and AI-adjacent equities, leaving portfolio diversification principles largely abandoned. This concentration has suppressed gold investment demand precisely when equity valuations have reached historically extreme levels.
The AI Bubble Parallel and What It Means for Gold
Several data points illustrate the scale of current equity market excess:
- One anticipated major IPO carries a reported valuation of approximately $1,750 billion, equivalent to nearly 94 times the prior year's revenues
- The dot-com era's most expensive IPOs averaged approximately 49 times revenues at the 2000 peak
- Semiconductor and AI-adjacent equities have reached valuation multiples described by multiple independent analysts as historically unprecedented
When equity bubbles deflate, investors historically rotate toward hard assets. With implied gold portfolio allocations currently rounding to essentially zero for most American stock investors, even a modest reallocation of equity wealth into gold would represent a demand surge with few historical parallels in scale or speed.
Gold Mining Stocks: Amplified Exposure to the Seasonal Cycle
Major gold mining companies carry operational leverage to the gold price because their cost structures are largely fixed in the short term. When gold prices rise, a disproportionate share of incremental revenue flows directly to earnings. This leverage typically amplifies gold's price moves by approximately 2 to 3 times when assessed across leading gold-stock indices and ETFs. Consequently, gold and mining equities tend to move in tandem, with miners amplifying each directional shift in the underlying metal.
This amplification applies across the seasonal cycle, including both the summer doldrums and the subsequent rallies. A 5.5% autumn gold rally historically translates to proportionally larger miner stock gains, while the 7.9% winter rally compounds those returns further.
Record Earnings, Decade-Low Valuations
The Q1 2026 earnings season produced record financial results for major gold miners, with sales and profits reaching all-time highs on the back of elevated gold prices. Yet despite this profitability milestone, the trailing twelve-month price-to-earnings ratios for leading gold miners fell to their lowest levels in at least a decade by mid-May 2026, with many major companies trading at low double-digit and even single-digit P/E multiples.
This combination of record earnings and compressed valuations is analytically unusual. It typically reflects either a market consensus that current earnings are unsustainable, or a structural undervaluation driven by investor inattention and sector rotation away from metals. Furthermore, gold miners outperform broader market indices during periods when the underlying metal is well-supported, reinforcing the case for sector attention as the doldrums pass.
Identifying the Seasonal Turning Point
For investors seeking to position ahead of gold's autumn rally, timing the end of the gold summer doldrums matters. Historical data points to late June as the typical seasonal low, with the autumn rally beginning to gain meaningful momentum by mid-July.
Several observable signals have historically preceded the doldrums' end:
- Gold approaching or testing its 200-day moving average as a technical support level
- Speculative futures long positioning reaching or near multi-month lows
- Gold ETF holdings stabilising or beginning to accumulate after a period of outflows
- The seasonal calendar advancing toward mid-July
- Sentiment surveys and positioning indicators reflecting elevated pessimism or capitulation among short-term traders
In 2026, several of these conditions are either already in place or approaching threshold levels before the summer has fully progressed, which is historically unusual at this early stage of the doldrums period.
Key Risk Factors That Could Extend the 2026 Doldrums
No seasonal analysis is complete without an honest assessment of what could cause the pattern to underperform. For 2026, the key risks include:
- Additional central bank liquidation from emerging market currencies under war-related stress, replicating or exceeding Turkey's impact
- Unexpected geopolitical resolution, which could remove the inflation risk premium from gold faster than the market anticipates
- Sustained equity market strength, which would continue suppressing investor demand for diversification into hard assets
- Further deterioration in futures positioning if macro uncertainty drives speculative participants fully to the sidelines
None of these risks appear dominant based on current conditions, but each warrants monitoring as the summer progresses.
2026 Summer Doldrums Snapshot: Key Factors at a Glance
| Factor | Current Assessment |
|---|---|
| Technical overextension entering summer | Minimal, least stretched in ~2.6 years |
| Speculative futures long positioning | 3.5-year secular low |
| American investor gold allocation | ~0.36% of equity wealth |
| Geopolitical inflation risk | Elevated but currently mispriced |
| Historical seasonal low timing | Typically late June |
| Autumn rally historical average | ~5.5% from seasonal low |
| Gold miner P/E multiples | Decade-low despite record earnings |
| Overall doldrums risk | Below-average relative to prior years |
Frequently Asked Questions About the Gold Summer Doldrums
What are the gold summer doldrums?
The gold summer doldrums describe a recurring seasonal period, typically concentrated in June and extending into early July, when gold prices tend to drift sideways or decline modestly. The pattern emerges as investment demand weakens during the northern hemisphere summer, with no major cultural or income-driven buying events present to fill the gap left by reduced institutional participation.
How significant is the typical summer price decline?
Across 22 modern gold bull market years, the average peak-to-trough decline from the final close of May to the late-June seasonal low has been approximately 0.6%. This is a shallow rather than severe correction, reflecting reduced activity rather than fundamental deterioration.
Is the seasonal pattern reliable?
The gold summer doldrums represent a probabilistic tendency based on historical averages, not a mechanical rule. Macro shocks, currency crises, and geopolitical escalation can override seasonal patterns in specific years. The pattern is most analytically useful when combined with complementary technical and positioning signals.
When does the summer doldrums period typically end?
Historical data consistently places the seasonal low in late June, with gold's autumn rally beginning to build momentum by mid-July.
Why are gold mining stocks relevant to the seasonal pattern?
Gold miners amplify gold's seasonal movements by approximately 2 to 3 times due to their operational leverage to the gold price. This means both the doldrums period and the subsequent autumn rally tend to be proportionally larger for mining stocks than for gold bullion itself.
This article is intended for informational and educational purposes only and does not constitute financial advice, a recommendation to buy or sell any security, or an offer of investment services. All forecasts, projections, and seasonal analyses are based on historical data and involve inherent uncertainty. Past seasonal patterns are not guaranteed to repeat. Readers should conduct their own independent research and consult a qualified financial adviser before making any investment decisions. Gold prices, mining stock valuations, futures positioning data, and geopolitical conditions referenced in this article are drawn from publicly available sources as of early June 2026 and may have changed materially by the time of reading.
Want to Position Ahead of the Next Major ASX Mineral Discovery?
Discovery Alert's proprietary Discovery IQ model delivers real-time alerts on significant ASX mineral discoveries, instantly converting complex data across 30-plus commodities into actionable insights — so subscribers can act before the broader market catches on. Explore how historic discoveries have generated exceptional returns on Discovery Alert's dedicated discoveries page, or begin your 14-day free trial today to secure your market-leading advantage.