
August 2, 2026
Why Uranium's Physical Market and Equity Markets Are Telling Two Very Different Stories
Few disconnects in commodity investing are as instructive as when the underlying physical market holds firm while the equities tied to it fall apart. This is precisely the situation unfolding in uranium right now, and understanding why this divergence exists is the first step to evaluating whether the uranium stocks selloff buying opportunity is genuine or simply a warning sign that the thesis is cracking.
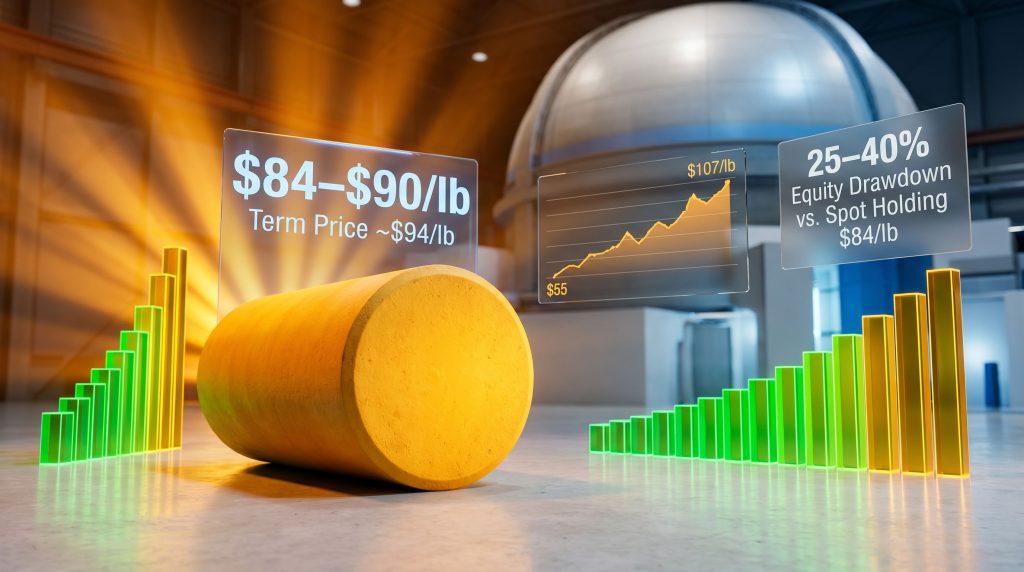
The spot uranium price has remained anchored in the $84 to $90 per pound range, levels not seen consistently since 2007 and 2008. Meanwhile, uranium equities across the ASX, TSX, and NYSE have corrected anywhere from 25% to 40% from their recent highs. That kind of gap between commodity price resilience and equity weakness is not a fundamental story. It is a sentiment story, and sentiment stories eventually resolve.
When big ASX news breaks, our subscribers know first
The Three Independent Forces Driving Nuclear Demand This Cycle
What makes this uranium cycle structurally distinct from previous bull markets is the convergence of three separate demand forces that are largely independent of one another.
The first is traditional energy security policy. Following the post-Fukushima contraction in nuclear capacity, many nations have reversed course. Reactor restarts across Japan, capacity extensions in the United States, Belgium, and South Korea, and new build programmes in Eastern Europe and Southeast Asia are all adding to long-term uranium demand projections.
The second is the electrification of artificial intelligence infrastructure. Data centres running large language models and training workloads require continuous, dispatchable power. Nuclear fits that requirement in ways that intermittent renewables simply cannot. The connection between hyperscaler electricity demand and nuclear capacity has become embedded in uranium equity valuations over the past 18 to 24 months.
The third driver is the structural underinvestment in uranium supply that followed the post-Fukushima price collapse. Mines that were shuttered, projects that were shelved, and exploration that was abandoned during the period from 2011 to 2019 created a supply pipeline that cannot be rebuilt quickly. These three forces acting together produce a demand outlook that is far more durable than anything seen in the previous uranium bull market of the mid-2000s, which was primarily driven by speculative physical purchasing.
Anatomy of the Selloff: Sentiment Versus Fundamentals
Understanding what is actually driving uranium equity weakness requires separating macro pressure from sector-specific deterioration. Furthermore, the uranium market volatility seen in recent months has amplified investor anxiety well beyond what physical market fundamentals would ordinarily justify.
| Selloff Driver | Sector-Specific? | Fundamental Impact | Investor Implication |
|---|---|---|---|
| Broad equity market risk-off | No | Minimal | Potential re-entry point |
| Cracks in AI profitability narrative | Partial | Indirect and short-term | Monitor, not exit |
| Seasonal uranium spot market slowdown | Yes | Temporary | Historically reverses |
| Geopolitical uncertainty | No | Neutral to mildly bullish | Supply risk premium remains |
| Uranium spot holding above $84/lb | No | Equities oversold versus commodity | Divergence typically corrects |
The current period tends to be seasonally softer for uranium purchasing activity, which mutes spot market momentum. When that quieter spot environment coincides with a broader risk-off move in equities, uranium stocks get caught in two crosscurrents simultaneously. The result is equity weakness that significantly outpaces any deterioration in the underlying commodity.
Experienced uranium market participants have noted that those who built cash positions ahead of this correction are approaching the weakness with strategic intent rather than fear, viewing the pullback as a deployment opportunity rather than a reason to reassess the thesis entirely. That distinction between emotional reaction and planned positioning is one of the most important dividing lines between investors who generate returns in high-volatility resource sectors and those who consistently buy high and sell low.
Behavioural finance research has consistently shown that loss aversion is neurologically stronger than gain-seeking. In volatile sectors like uranium, this asymmetry becomes particularly costly. A 30% to 40% drawdown experienced from a fully invested position feels categorically different from the same drawdown experienced while holding a deliberate cash reserve earmarked for deployment. The market outcome is identical; the investor outcome is not.
How the Physical Uranium Market Actually Works
Spot Price Versus Term Price: The Contango Structure Explained
The uranium market operates across two pricing mechanisms that most equity investors do not fully understand, and this misunderstanding contributes to misreading what current price levels actually signal. Indeed, the divergence between spot and term prices is one of the most telling structural indicators available to investors right now.
The spot price, currently around $84 per pound, reflects transactions for near-term physical delivery. The term price, currently around $94 per pound, reflects contracted future deliveries and serves as the structural pricing anchor for the bull market. When the term price exceeds the spot price, the market is in contango, which is the normal condition in a bull market where forward scarcity is priced in.
Base-escalated long-term contracts are reportedly being signed with starting prices in the mid-$90s range, with fully fixed-price contracts already transacting in triple digits. Ceiling prices on market-referenced contracts are reportedly in the $130 to $160 per pound range, with floors in the $70 to $80 per pound range. This structure reflects genuine utility conviction in long-term uranium demand.
Why Utilities Cannot Simply Buy in the Spot Market
A critical but underappreciated dynamic in uranium pricing is why large utilities consistently prefer the term market over spot purchasing for their bulk procurement needs.
The mechanics are straightforward: any utility attempting to purchase hundreds of thousands or millions of pounds of uranium in the spot market would immediately move the price against itself. If a utility's existing contracts reference spot prices at the time of delivery, pushing the spot price higher through its own buying activity directly increases its costs on those existing contracts.
This creates a structural incentive for utilities to keep spot market activity limited and to conduct large-volume procurement through the term market, where price discovery happens through negotiation rather than open market trading. This is why the spot market can appear quiet even during periods of strong underlying demand growth, and why the term market is the more reliable signal for uranium's fundamental direction.
Reading the Uranium Price Chart Correctly
Higher Highs, Higher Lows Since 2016
Taking a long-term view of uranium spot pricing since the 2016 trough reveals a clear structural trend of higher highs and higher lows. Each of the sharp spike events visible on a medium-term chart represents a period of risk-on market sentiment combined with simultaneous purchasing from multiple market participants including physical trusts, hedge funds, traders, and utilities.
The late 2023 run from approximately $55 to $107 per pound over roughly six months was driven by an unusual convergence of multiple large buyers entering the spot market simultaneously, including the Sprott Physical Uranium Trust, Kazatomprom, Cameco, hedge funds, and utilities responding to large requests for proposals. When this confluence of buying ends, the price reverts toward the term price in a return to contango. This reversion does not signal the end of the bull market — it signals a return to the normal structural pricing relationship.
Understanding the uranium spot price dynamics at play during these consolidation phases is consequently essential for investors seeking to avoid mistaking a temporary mean-reversion for a structural breakdown. Analysts at Sprott Asset Management have noted that these correction phases within uranium bull markets have historically provided the strongest forward return entry points for patient investors.
Technical Signals Worth Watching
The 200-day moving average for uranium spot price is currently sitting around $82.50, with spot trading above that level at approximately $84.75. This provides a meaningful technical anchor for assessing whether the commodity itself is at risk of trend breakdown.
Across uranium equities as a sector, RSI readings have compressed to the 30 to 35 range. Historically, readings below RSI 30 across the broader sector have preceded meaningful bottoms and strong subsequent recoveries. This does not mean the bottom is confirmed today, but it does mean the sector is approaching territory where the risk-reward balance historically has favoured patient buyers over sellers.
The Supply Reality: Why New Mines Take Longer Than Anyone Expects
A Global Audit of Significant New Projects
| Project / Region | Estimated Output | Anticipated Timeline | Key Development Risk |
|---|---|---|---|
| Rook One, Athabasca Basin, Canada | Up to 29Mlbs/yr (permitted maximum) | 48 to 54 months from construction start | 150m overburden complexity; capex likely exceeding $3B |
| Phoenix / Wheeler River, Canada | Multi-million lbs/yr | 2 to 3 years from current stage | Financing flexibility; contract delivery timing |
| French-backed ISR project, Mongolia | Up to 5 to 6Mlbs/yr at peak | Several years out | Nearly 30 years of exploration history precedes development |
| Uzbekistan expansion | Increasing annually | Ongoing | Transparency questions around reported output figures |
| Wings ISR, Namibia (Russian-backed) | Not disclosed | Delayed | Severe regional drought constraints limiting operations |
The 20-Year Rule in the World's Best Uranium Jurisdiction
One of the most instructive data points in uranium supply analysis is the development timeline for the highest-grade uranium deposit ever discovered in what is widely considered the world's premier uranium mining jurisdiction. From discovery to construction commencement took approximately 17 to 20 years, including a seven-year regulatory review process, complex First Nations benefit agreement negotiations, and navigation of a commodity price cycle that bottomed shortly after discovery. Even with all permits secured and every approval in place, treating the 29 million pounds per year maximum permitted output by 2031 as a base case is a significant analytical error.
What is particularly telling about the current development posture of Rook One is that the operator has communicated publicly that profitability begins at just 5 million pounds of annual production. This signals that output will be dictated by contracted demand rather than a race to maximise volume. Any utility modelling its future supply around 29 million pounds hitting the market in 2031 is likely building a flawed procurement plan.
How Capital Market Weakness Extends Supply Timelines and Strengthens the Long-Term Case
One of the less discussed dynamics in uranium supply analysis is how equity market downturns directly extend the timelines of supply development. When junior and mid-tier developers cannot raise capital at reasonable terms, project timelines slip. Feasibility studies that projected first production within a certain window get pushed out by 12, 24, or 36 months.
The Phoenix deposit at Wheeler River, for example, was projected in 2018 presentations to be producing uranium several years before its current anticipated timeline. This is not a failure of project quality. It reflects the reality that capital markets, commodity price cycles, and regulatory timelines compound in ways that feasibility study assumptions cannot fully anticipate. Every period of equity market weakness that delays new supply development ultimately extends the duration of the uranium supply deficit and strengthens the long-term bull case.
The next major ASX story will hit our subscribers first
The Athabasca Basin: Where the Next Generation of Deposits May Be Hiding
Exploration activity in the Athabasca Basin has picked up meaningfully over the past two years, with several joint venture programmes delivering encouraging drill results. However, junior explorer stocks have significantly underperformed mid-cap and large-cap uranium equities during this period, which experienced uranium market observers interpret as a sign that the sector is still far from the euphoric phase of a true bull market. It is during that later phase, typically characterised by triple-digit uranium prices and strong retail participation, that explorer stocks tend to generate their most dramatic revaluations.
One of the more quietly significant exploration stories currently unfolding in the Athabasca involves Cameco conducting a joint venture exploration programme at Don Lake, located immediately adjacent to ISO Energy's Hurricane deposit along the Larocque East trend. Drill results referenced in Cameco's earnings reports suggest meaningful intersections, and the proximity of this ground to the McClean Lake mill, which currently processes ore from Cigar Lake, is strategically relevant. Cigar Lake's production life is finite, and a mill of that capability would require a new feed source. Whether a development outcome involves ISO Energy or not remains unclear, but the geological and infrastructure logic is difficult to ignore.
The AI-Nuclear Nexus: Structural Tailwind or Narrative Vulnerability?
The correlation between uranium equity valuations and the AI growth narrative has created a specific vulnerability in the current selloff. As questions emerge about the near-term profitability pathway for AI infrastructure spending, and as some of the largest technology companies report significant quarterly losses from AI-related capital expenditure, market participants are reassessing the thematic premium embedded in uranium stocks.
The critical question for uranium investors is whether this narrative softening represents a structural threat to the demand thesis or a temporary sentiment headwind. The answer, on balance, points clearly toward the latter. Nuclear power's demand case rests on decades of baseload electricity growth projections that predate the AI boom entirely. The data centre electrification story was always additive to a thesis that was already compelling, not the foundation of it.
The model of major technology companies bypassing market intermediaries to secure direct commodity supply is already established in adjacent sectors. A major technology platform recently made a direct equity investment in a copper producer specifically to secure data centre supply chain inputs. The same strategic logic is now being applied to uranium fuel supply, with hyperscalers reported to be in active project finance discussions with at least one major western uranium developer. If executed at scale, this would represent a demand and financing catalyst without precedent in uranium market history.
Beyond Uranium: The Nuclear Fuel Cycle as an Investment Ecosystem
Conversion: The Overlooked Bottleneck
What is uranium conversion and why does it matter for investors? Uranium conversion is the process of transforming uranium oxide (U₃O₈) into uranium hexafluoride (UF₆), the chemical form required before enrichment can occur. This step is a critical chokepoint in the nuclear fuel supply chain, and it is one that most uranium equity investors completely overlook.
Conversion prices collapsed to approximately $6 per kgU at the market trough, largely due to a period when government-held UF₆ inventory was released into the market, devastating commercial pricing incentives and discouraging new capacity investment. That price has since tripled as demand has recovered, and at least one major North American conversion facility that was previously idled has been restarted and is reportedly on a path toward full capacity utilisation within the next few years. There are early-stage discussions about further capacity expansion if utility contracting signals sufficient long-term demand.
Expanding conversion capacity has a direct multiplier effect on uranium feedstock demand. Every additional kilogram of UF₆ produced requires uranium oxide input. This makes conversion pricing a leading indicator for uranium consumption growth.
Enrichment: Trading Sardines or Structural Investments?
The enrichment sector presents a more complex picture for investors. The handful of publicly traded vehicles with enrichment exposure have demonstrated extraordinary price volatility, with moves driven in significant part by retail trading activity rather than fundamental revaluation. This makes them effective trading instruments for short-term momentum but unreliable vehicles for long-term thematic positioning.
The more interesting longer-term enrichment development involves laser-based enrichment technologies. The most derisked of these is the GLE technology, a joint venture involving Cameco and Silex, which is progressing toward a facility in Paducah, Kentucky focused initially on re-enriching depleted uranium tails material back to natural uranium equivalent, effectively functioning as a conversion facility in its first production phase at an estimated 5 million pounds of uranium equivalent per year. Additionally, Urenco has announced plans to expand its US enrichment facility by approximately 50%, a significant signal of long-term demand confidence. If both conversion and enrichment capacity expand meaningfully, the downstream feedstock demand for uranium increases on both fronts simultaneously.
Positioning Framework: How to Think About Uranium Equity Exposure
Producers, Developers, and Explorers: Risk-Adjusted Exposure
| Equity Category | Risk Level | Price Leverage | Liquidity | Suited For |
|---|---|---|---|---|
| Major producers (ASX/TSX/NYSE listed) | Medium | Moderate | High | Core long-term position |
| Mid-tier advanced developers | Medium-High | High | Medium | Tactical allocation |
| Uranium-focused ETFs | Medium | Moderate | High | Diversified exposure, lower single-stock risk |
| Junior explorers | Very High | Very High | Low | Speculative allocation only |
| Nuclear fuel cycle companies (conversion/enrichment) | High | Variable | Low-Medium | Thematic overlay position |
Developing sound uranium investment strategies across these categories requires matching position sizing to both risk tolerance and time horizon, rather than concentrating exposure in the highest-leverage vehicles simply because they offer the most dramatic upside scenarios.
Three Conditions That Support This Being a Cyclical Correction
- Spot and term prices remain structurally elevated with no evidence of demand destruction from utilities
- Term market contracting activity continues at pace, reflecting genuine utility procurement needs rather than opportunistic buying
- Uranium equity RSI approaches or breaches oversold territory at or below 30 without any corresponding deterioration in physical market fundamentals
Three Warning Signs That Would Require Thesis Reassessment
- Significant unexpected new supply entering the market within a three to five year window, materially exceeding current modelling assumptions
- Sustained reduction in nuclear capacity additions or widespread reactor restart cancellations driven by policy reversal
- Hyperscaler data centre capital expenditure contracting materially and persistently, reducing long-term electricity demand growth projections across multiple modelling scenarios
Frequently Asked Questions: Uranium Stocks Selloff and the Buying Opportunity Question
Is the uranium bull market over after the recent selloff?
Based on current physical market data, the answer is no. The term price remains above $90 per pound, base-escalated contracts are being signed in the mid-$90s, and utility contracting activity in the term market continues. The selloff in equities reflects macro risk-off pressure and narrative headwinds from the AI sector, not a deterioration in uranium's fundamental supply-demand balance.
Why are uranium stocks falling when the uranium price is still high?
Uranium equities carry several layers of risk premium beyond the commodity price itself, including equity market beta, liquidity risk, project execution risk, and thematic narrative exposure. When broad equity markets sell off and a correlated growth narrative (AI electrification) faces scrutiny, uranium stocks absorb pressure from multiple directions simultaneously, even when the underlying commodity holds firm.
What does the term market price signal about where uranium is headed?
The term price sitting at approximately $94 per pound while spot trades near $84 represents a healthy contango structure consistent with a sustained bull market. This forward curve premium reflects genuine utility willingness to pay up for contracted future supply, which is a stronger fundamental signal than spot price movements driven by short-term purchasing or selling activity.
How long do uranium equity corrections typically last?
Historical corrections in uranium equities during structural bull markets have ranged from a few weeks to several months. The more relevant consideration is not timing the exact bottom but ensuring capital is available to deploy during periods of maximum pessimism, which historically have corresponded with the best forward returns. Analysts at Livewire Markets have highlighted that the strongest recoveries in uranium equities have consistently followed periods of extreme pessimism and oversold technical readings.
Are small modular reactor stocks a good way to play the uranium theme?
SMR-related equities vary enormously in quality. Some represent genuinely advanced industrial development programmes with strong order pipelines and credible technology. Others have been driven primarily by retail trading enthusiasm disconnected from near-term revenue reality. Valuing SMR companies requires assessing intellectual property value, the credibility of the order pipeline, and realistic timelines to commercial cash flow, none of which are straightforward exercises.
The One to Three Year Outlook: What Supply, Contracting, and Demand Suggest
The uranium market's supply-demand balance, as modelled by the most rigorous analysts tracking the physical market, does not show supply breaching demand within the next five to seven years under any realistic scenario that does not involve an unforeseen and rapid influx of new production. Given that the highest-grade deposit in the best jurisdiction in the world is taking the better part of two decades from discovery to production, the probability of supply surprising meaningfully to the upside within that window is low.
The contracting cycle is the most important near-term catalyst to watch. As utilities that have been running down legacy contract coverage are forced to return to the term market for new multi-year procurement agreements, competition for available pounds at contracted prices will intensify. This dynamic has historically preceded the most significant upward moves in both term prices and uranium equity valuations.
The current uranium stocks selloff buying opportunity, evaluated against physical market fundamentals, the contracting structure, the supply development timeline realities, and the technical positioning of the sector, presents the characteristics of a cyclical correction within an intact structural bull market. That does not make the timing of an entry certain, and individual position sizing in a high-volatility sector always matters. However, for investors with a genuine 12 to 36 month time horizon and the psychological preparedness to absorb near-term volatility, the case for treating the current weakness as a buying opportunity rather than an exit signal appears well-supported by the available evidence.
This article contains forward-looking statements, market analysis, and speculative projections related to uranium pricing, supply development timelines, and equity market performance. None of the content constitutes financial advice. Readers should conduct their own due diligence and consult a qualified financial adviser before making investment decisions. Resource sector investments carry significant risks including loss of capital. Past sector performance does not guarantee future results.
For practitioner-level insights into uranium market mechanics and physical market dynamics, VRIC Media's interview series on metals and mining, available via their YouTube channel, offers additional perspectives that complement the analytical framework presented here.
Ready to Capitalise on the Next Major Uranium or Mineral Discovery?
Discovery Alert's proprietary Discovery IQ model delivers real-time alerts the moment significant ASX mineral discoveries are announced, translating complex data across 30-plus commodities into clear, actionable insights for both traders and long-term investors. Explore how historic mineral discoveries have generated extraordinary returns and begin your 14-day free trial today to position yourself ahead of the broader market.