July 22, 2026
The Mechanics Behind the Number: How Implied Volatility Works in Gold Markets
Most investors instinctively associate volatility with danger. When a number climbs, the reflex is to assume something is breaking. In gold markets, this instinct produces some of the most persistent and costly misreadings in modern portfolio management. The gold volatility index GVZ operates on a completely different logic, one that rewards investors who understand its architecture rather than react to its surface readings.
Understanding what the index actually measures, how it is built, and what its historical extremes genuinely signify transforms it from an anxiety trigger into one of the most informative structural tools available for monitoring gold market conditions.
When big ASX news breaks, our subscribers know first
How the Gold Volatility Index GVZ Is Constructed
The Raw Input: GLD Options and Real-Time Pricing
The gold volatility index GVZ is published in real time by Cboe Global Markets under the ticker symbol ^GVZ. Its foundation is not the gold price itself, but rather the live bid and ask quotes on options contracts tied to the SPDR Gold Shares ETF (GLD), the world's largest physically backed gold exchange-traded fund.
Both put options, which confer the right to sell at a specified price, and call options, which confer the right to buy, are pulled across a wide range of strike prices. The breadth of this input is significant: rather than sampling a narrow slice of options activity, the calculation sweeps across the full available spectrum of market-implied expectations.
The index was launched on June 3, 2008, placing 2026 as its 18th year of continuous publication. Its complete daily historical record is maintained by the Federal Reserve Bank of St. Louis (FRED) under the series ticker GVZCLS, representing one of the most accessible and comprehensive long-run volatility datasets available for any commodity.
The Variance Interpolation Process: What the Calculation Actually Does
GVZ applies the same mathematical framework as the CBOE Volatility Index (VIX), which measures expected S&P 500 volatility. The step-by-step process works as follows:
- Mid-quote prices are collected from near-term GLD put and call options across multiple expiration dates
- Time-weighted interpolation is applied across strike prices to generate a constant 30-day variance estimate
- The square root of that variance is calculated and annualised to produce the final index reading
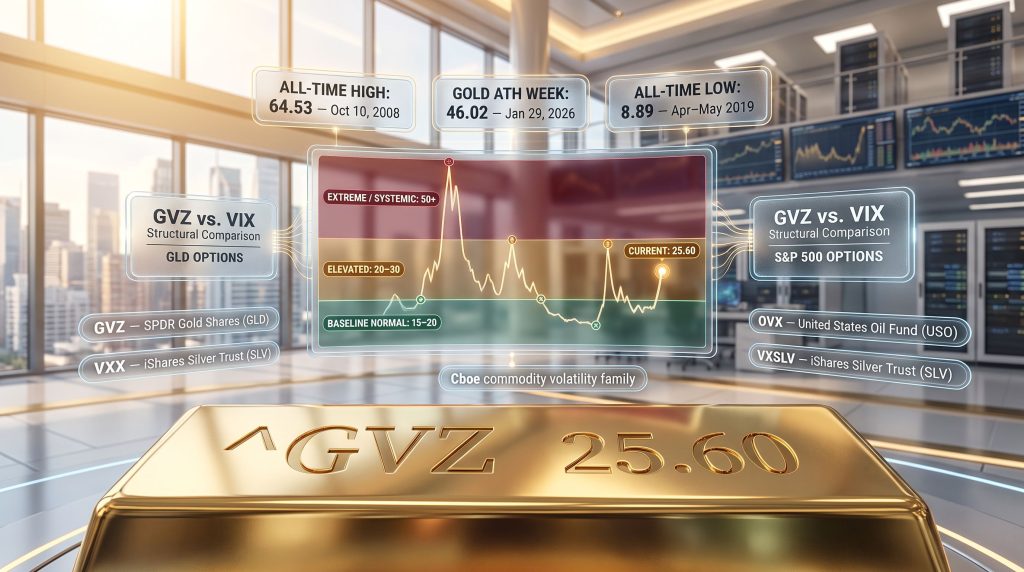
The output is expressed as an annualised percentage figure. A GVZ reading of 25.60, the closing level recorded on July 17, 2026, indicates that options markets collectively anticipate gold will move by approximately 25.6% on an annualised basis over the next 30 days.
Critical Distinction: The index quantifies expected magnitude of movement, not direction. It does not predict whether gold will rise or fall. It predicts how much it will move. This distinction is not semantic; it is the entire interpretive framework.
GVZ vs. VIX: Same Engine, Structurally Different Signals
A Methodology Comparison
| Feature | VIX | GVZ |
|---|---|---|
| Underlying Asset | S&P 500 Index options | GLD (Gold ETF) options |
| Time Horizon | 30-day forward-looking | 30-day forward-looking |
| Output Format | Annualised % volatility | Annualised % volatility |
| Primary Driver | Equity market fear and risk-off sentiment | Monetary stress, real yields, geopolitical risk |
| Directional Bias | Spikes predominantly on downside fear | Can spike on both downside fear and upside demand |
| Published By | Cboe Global Markets | Cboe Global Markets |
Why Gold Volatility Behaves Differently
The VIX carries a structural asymmetry that most market participants have internalised: it rises when equity investors fear losses and compresses during periods of relative calm. This relationship is reasonably consistent across cycles.
The GVZ, however, operates under a fundamentally different dynamic. It can spike for two structurally opposite reasons:
- Crisis-driven spikes: Forced liquidation, systemic fear, or flight from all risk asset classes simultaneously (characteristic of October 2008 and March 2020)
- Bull market-driven spikes: Heavy institutional demand for upside call options as portfolio managers scramble to gain gold exposure during rapid price appreciation
This dual-trigger architecture is the single most important feature distinguishing the GVZ from equity volatility indices. A high GVZ reading in isolation tells you very little without knowing the concurrent direction of the gold price and the type of options driving the premium expansion.
GVZ Regime Classification: What Different Levels Actually Signal
The 18-year FRED dataset enables a robust historical classification of GVZ regimes. The table below maps quantitative ranges to their market interpretations and historically verified examples.
| GVZ Range | Classification | Market Interpretation | Historical Example |
|---|---|---|---|
| Below 10 | Historically extreme calm | Near-zero expected movement priced in | All-time low: 8.89 (April-May 2019, FRED) |
| 10-15 | Unusually quiet | Low institutional engagement; directional break often follows | December 2017: 9.43 |
| 15-20 | Baseline normal | Orderly market; stable real rates; no acute catalyst | Characteristic range: 2018-2019 |
| 20-30 | Elevated | Meaningful movement expected; macro catalysts building | April 2025 tariff shock peak: 28.44 (FRED) |
| 30-50 | High | Active macro shift underway; large institutional repositioning | Russia-Ukraine escalation (March 2022): 31.70 (FRED); Gold ATH week (Jan 2026): 46.02 (FRED) |
| Above 50 | Extreme / systemic | Structural market stress or acute crisis | COVID-19 shock (March 2020): 48.98 (FRED); GFC peak (Oct 10, 2008): 64.53 (FRED) |
Source: Federal Reserve Bank of St. Louis (FRED), series GVZCLS
The Underappreciated Signal: Historically Low GVZ Readings
Most attention focuses on elevated GVZ readings, but the index's most analytically overlooked signal may be its floor behaviour. When GVZ falls below 10, as it did in April and May 2019 when it touched the all-time closing low of 8.89, the options market has effectively priced out any expectation of meaningful movement.
Historically, these extreme calm periods have preceded significant directional moves. The logic is mechanical: when option premiums compress to near-zero implied movement, any macro catalyst that materialises finds a market structurally unprepared for movement. The resulting repricing can be rapid and pronounced. Investors monitoring the GVZ for entry timing context should treat readings below 12 as potential setup conditions rather than reasons for complacency.
The January 2026 Case Study: Deconstructing the Bull Market Paradox
When Record Prices and Record Volatility Coexisted
Gold reached an intraday all-time high of $5,589.38 on January 28, 2026 (GoldSilver Price Charts). The following day, the GVZ closed at 46.02, a level historically associated with crisis conditions rather than price records (FRED, GVZCLS). This apparent contradiction is one of the most instructive events in the index's 18-year history. Furthermore, understanding the broader gold price forecast context helps contextualise why such elevated readings accompanied record highs rather than market collapses.
Two Mechanisms, One Number
Understanding this paradox requires separating the two distinct options market dynamics that produce elevated GVZ readings.
Mechanism 1: Crisis-Driven Spike (Put Option Dominance)
- Investors purchase put options to protect against rapid gold price declines or to hedge across all asset classes during forced liquidation events
- Elevated put demand drives option premiums higher, feeding directly into the GVZ calculation
- The fear being priced is a downside event
- Historical examples: October 2008 (GVZ: 64.53), March 2020 (GVZ: 48.98)
Mechanism 2: Bull Market-Driven Spike (Call Option Dominance)
- Institutional investors and portfolio managers who are underweight gold purchase call options to gain rapid upside exposure
- The fear here is not a price collapse; it is the fear of being left behind during an accelerating rally
- Surging call demand inflates option premiums equally, producing high GVZ readings despite a rising gold price
- Historical example: January 2026 (GVZ: 46.02 alongside $5,589 gold)
Analytical Insight: Identifying which mechanism is driving an elevated GVZ reading is the critical step that separates informed interpretation from reflexive anxiety. Put dominance signals crisis risk; call dominance signals momentum-driven institutional repositioning. Both look identical on the index surface.
The Current Environment: GVZ in Mid-2026 Context
Where the Index Stands and Why
As of mid-July 2026, the gold volatility index GVZ has been trading in the 24 to 27 range, with a close of 25.60 on July 17, 2026, against a recent daily range of 24.88 to 26.93 (FRED / Cboe). This elevated-but-not-extreme positioning reflects several converging macro catalysts:
- The July 28-29 FOMC meeting, with markets pricing a rate hold while watching closely for forward guidance shifts on the trajectory of cuts
- The June PCE inflation reading scheduled for July 30, a primary input for Fed policy calibration
- Residual volatility carried forward from the April 2025 tariff shock impact, which drove GVZ to a peak of 28.44 before subsiding
- Ongoing institutional repositioning following gold's correction from the January 2026 all-time high
The Structural Shift in GVZ's Baseline Since 2022
One of the most significant and least-discussed developments in gold market dynamics is the upward migration of the GVZ's structural baseline over the past several years. Through most of the 2015 to 2022 period, the index averaged in the mid-to-high teens, reflecting an era when institutional portfolio managers largely treated gold as a peripheral or tactical allocation.
That baseline has since shifted materially higher, driven by a convergence of structural forces:
- Central bank gold demand running at levels not recorded since the 1950s, reflecting sovereign-level de-dollarisation strategies
- Negative real interest rates reasserting themselves as a persistent condition rather than a temporary policy response
- US fiscal deficits breaking through previously symbolic thresholds, altering long-term sovereign debt credibility assessments
- Gold re-entering institutional monetary strategy as a mainstream portfolio allocation after decades of marginalisation
The elevated GVZ baseline is therefore not statistical noise. It reflects a genuine structural re-rating of gold's role in professional capital allocation, expressed through the options market's collective repricing of expected movement magnitude.
The next major ASX story will hit our subscribers first
GVZ as a Strategic Tool: Applications Across Investor Types
For Active Traders and Options Specialists
- GVZ supplies the implied volatility input required to accurately price gold options contracts
- High GVZ environments expand option premiums, increasing the income potential of covered call strategies for existing gold holders
- Regime transitions, such as GVZ crossing above 30 or falling below 15, function as potential timing signals for directional positioning reviews
- Cross-referencing GVZ against OVX (Cboe Crude Oil ETF Volatility Index) and VXSLV (Cboe Silver ETF Volatility Index) provides context on whether elevated gold volatility is a gold-specific development or reflects broader commodity-wide stress. In addition, reviewing the gold-silver ratio analysis can further clarify whether divergences between metals are driven by volatility or by shifting relative demand
The Cboe Commodity Volatility Index Family
| Index | Ticker | Underlying Asset |
|---|---|---|
| Gold ETF Volatility Index | GVZ | SPDR Gold Shares (GLD) |
| Crude Oil ETF Volatility Index | OVX | United States Oil Fund (USO) |
| Silver ETF Volatility Index | VXSLV | iShares Silver Trust (SLV) |
When GVZ spikes in isolation while OVX and VXSLV remain contained, the signal is gold-specific, likely driven by monetary or geopolitical factors unique to gold's function as a monetary metal. When all three elevate simultaneously, the signal is commodity-wide, suggesting macro stress affecting the broader real asset complex.
For Long-Term Physical Gold Holders
The single most important framing for physical gold investors is this: GVZ is derived entirely from paper market activity. Options contracts expire. The market participants trading them manage short-term positions, hedging portfolios, or speculating on price momentum. Their collective behaviour produces the GVZ reading. None of that activity touches physically allocated gold held in vault storage.
Practical considerations for physical buyers in elevated GVZ environments:
- Dollar-cost averaging is statistically more sound than single large purchases when GVZ is persistently above 25, not because the index predicts a decline, but because high-volatility regimes increase the randomness of any single entry point
- Persistently elevated GVZ signals a period of larger-than-normal price swings, making incremental accumulation a more defensible entry strategy
- The long-term purchasing power of physical gold is governed by monetary policy trajectories, sovereign debt dynamics, and gold safe-haven demand, none of which are altered by daily options market activity
Strategic Note: A high GVZ reading does not predict a gold price decline. Some of gold's strongest and most sustained rallies in the index's 18-year history have coincided with its highest volatility readings. Conflating magnitude with direction is the single most common and costly misinterpretation of this index.
Key GVZ Statistics at a Glance
| Metric | Value | Source |
|---|---|---|
| Index inception date | June 3, 2008 | Cboe Global Markets |
| All-time closing high | 64.53 (Oct 10, 2008) | FRED (GVZCLS) |
| All-time closing low | 8.89 (Apr-May 2019) | FRED (GVZCLS) |
| COVID-19 peak | 48.98 (March 2020) | FRED (GVZCLS) |
| Russia-Ukraine escalation peak | 31.70 (March 2022) | FRED (GVZCLS) |
| Gold ATH week (Jan 2026) | 46.02 (Jan 29, 2026) | FRED (GVZCLS) |
| April 2025 tariff shock peak | 28.44 | FRED (GVZCLS) |
| Current level (July 17, 2026) | 25.60 | FRED / Cboe |
| Recent daily range (mid-July 2026) | 24.88 to 26.93 | FRED / Cboe |
| Gold price at Jan 2026 ATH | $5,589.38 | GoldSilver Price Charts |
Frequently Asked Questions About the Gold Volatility Index GVZ
What does GVZ stand for?
GVZ is the ticker designation for the Cboe Gold ETF Volatility Index, published by Cboe Global Markets. The G references gold, V references volatility, and Z is the exchange-assigned index identifier used by Cboe.
How is the GVZ different from the VIX?
Both indices use identical mathematical methodology and express output as annualised implied volatility percentages. The underlying asset differs: the VIX measures expected S&P 500 equity volatility, while the GVZ measures expected gold price volatility via GLD options. Their structural drivers also diverge significantly. The VIX functions primarily as an equity fear gauge, while the GVZ responds to monetary stress, real yield dynamics, geopolitical risk, and institutional gold demand patterns.
What is a normal GVZ level?
Based on the complete FRED historical record spanning June 2008 to present:
- Below 10: Historically extreme calm (all-time low: 8.89, May 2019)
- 10-15: Unusually quiet; periods that have historically preceded directional moves
- 15-20: Baseline normal operating range
- 20-30: Elevated; meaningful movement expected from identifiable macro catalysts
- 30 and above: High; active macro shift or significant institutional repositioning underway
- 50 and above: Extreme systemic stress (observed only during the Global Financial Crisis and COVID-19)
Does a high GVZ mean gold prices will fall?
No. GVZ measures expected movement magnitude, not direction. The index recorded some of its highest readings during gold's strongest bull market phases, including the period surrounding the January 2026 all-time high of $5,589.38, when GVZ reached 46.02. High GVZ is equally consistent with rapid upside price movement as with downside risk.
Where can investors track the GVZ?
| Platform | Access Type | Notes |
|---|---|---|
| Cboe Global Markets | Real-time | Official publisher; full methodology documentation available |
| FRED (St. Louis Fed) | Historical daily | Series: GVZCLS; data from June 2008 inception |
| Investing.com | Real-time + historical | Ticker: ^GVZ |
| Yahoo Finance | Real-time + historical | Ticker: ^GVZ |
The FRED GVZCLS series is the most valuable resource for long-run regime analysis, providing an unbroken daily record since the index's June 3, 2008 inception. Cboe's official product page supplies the complete technical methodology documentation for practitioners requiring calculation-level detail.
Disclaimer: This article is for informational and educational purposes only and does not constitute financial or investment advice. All historical data referenced is sourced from Cboe Global Markets and the Federal Reserve Bank of St. Louis (FRED, series GVZCLS). Past performance and historical index readings are not indicative of future results. Investors should consult a qualified financial adviser before making any investment decisions.
Want to Know When Major Gold Discoveries Hit the ASX Before the Market Moves?
Discovery Alert's proprietary Discovery IQ model delivers real-time alerts on significant ASX mineral discoveries — including gold — instantly translating complex data into actionable investment opportunities for both short-term traders and long-term investors. Start your 14-day free trial today and explore Discovery Alert's discoveries page to see how historic mineral discoveries have generated exceptional market returns.