
June 21, 2026
The Portfolio Architecture Question Most Precious Metals Investors Get Wrong
Spend enough time watching commodity markets and a recurring pattern emerges: investors approach precious metals as a binary choice problem. Gold or silver. Safety or growth. Reserve asset or industrial commodity. This framing is not just incomplete — it is strategically counterproductive. The more useful question, particularly across a five-year horizon, is not which metal to own but what specific function each metal performs inside a portfolio architecture designed to survive multiple economic scenarios. This gold vs silver investment guide examines that question in structural detail.
The 2025 price cycle exposed this distinction with unusual clarity. Both metals delivered their strongest annual gains since 1979, according to London Bullion Market Association data, yet the mechanics behind those gains were fundamentally different in character. Gold's advance was driven by institutional accumulation, currency confidence erosion, and central bank gold demand. Silver's surge incorporated all of those monetary factors plus accelerating industrial consumption from electrification infrastructure, solar manufacturing, and electric vehicle production.
Understanding that distinction is the starting point for building a precious metals allocation that does not just perform in favourable conditions, but holds its shape when conditions turn.
When big ASX news breaks, our subscribers know first
What the 2025 to 2026 Price Cycle Reveals About Each Metal's True Character
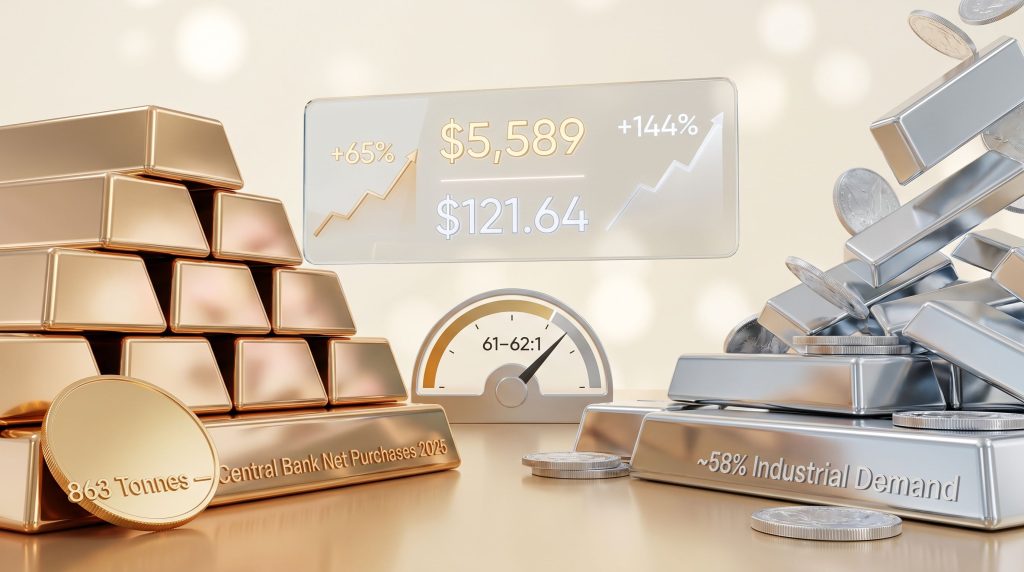
The raw performance numbers from 2025 are striking by any historical measure. Gold posted a full-year gain of approximately 65%, its strongest annual performance since 1979 (LBMA, Precious Metals Market Report: Q4 and Full Year 2025). Silver surged approximately 144% across the same period, also its sharpest calendar-year advance since 1979.
By late January 2026, gold had reached an all-time high of approximately $5,589 per ounce, while silver crossed the $100 per ounce threshold for the first time in recorded history, peaking near $121.64. As of early May 2026, both metals had corrected substantially. Gold was trading in the $4,500 to $4,600 range, while silver had pulled back to approximately $73 to $74.
That correction tells an instructive story about each metal's structural character:
- Gold declined approximately 19 to 20% from its January 2026 record high by May 2026
- Silver declined approximately 40% from its all-time peak over the same window
- The amplitude differential, roughly 2:1, is not an anomaly but a repeating structural feature of silver's smaller, less liquid market
This asymmetry between gold's relatively contained pullback and silver's sharper correction reflects a persistent structural feature of silver markets: smaller market depth means larger sell orders move prices more severely, compressing or widening price rapidly in ways that gold's more liquid market absorbs far more efficiently.
The 2020 COVID-19 dislocation provided an earlier illustration of this same dynamic. During March 2020, silver's decline exceeded 50% from its February 2020 highs, while gold corrected approximately 15 to 20% over the same period. The subsequent recovery similarly amplified silver's upside, with the metal gaining over 130% from its March 2020 lows by December 2020, compared to gold's approximately 25% recovery gain.
What Drives Gold's Price Through 2031: The Monetary Architecture
Central Bank Accumulation as a Structural Price Floor
The most durable demand driver beneath gold's price is institutional and sovereign accumulation operating largely independently of retail investor sentiment. Global central banks purchased a net 863 tonnes of gold in 2025, the fourth-largest annual total ever recorded, according to the World Gold Council's Gold Demand Trends: Full Year 2025 report. Critically, this represents the 15th consecutive year of net central bank gold buying, a pattern that signals a strategic repositioning rather than cyclical opportunism.
The primary motivation behind sustained central bank accumulation is well-documented: reducing sovereign portfolio concentration in US dollar-denominated assets and building reserve holdings in an asset class that no government can unilaterally devalue, freeze, or confiscate. The weaponisation of dollar-based financial infrastructure through sanctions regimes has accelerated this transition among emerging-market central banks in particular.
Total global gold demand surpassed 5,000 tonnes in 2025 for the first time in recorded history, generating approximately $555 billion in value, a 45% increase year-over-year (World Gold Council, Gold Demand Trends: Full Year 2025). This demand total was not speculative in character. It reflected simultaneous buying pressure from central banks, exchange-traded fund investors, and retail buyers across multiple geographies, all responding to the same underlying macroeconomic signals.
What Gold Offers That Silver Cannot
Gold as a safe haven rests on decades of monetary cycle data rather than recent performance alone. When purchasing power deteriorates, gold has historically preserved or grown real value across multiple inflationary regimes. This relationship holds with greater consistency than silver's, for one structural reason: gold's demand is approximately 85% monetary and investment-driven, meaning its pricing mechanism is largely insulated from the industrial cycle volatility that affects silver.
Rising real interest rates represent the most significant sustained headwind for gold, since the opportunity cost of holding a non-yielding asset increases when fixed-income alternatives offer meaningful returns. Prolonged dollar strength and geopolitical de-escalation scenarios also present meaningful downside risks. Neither of these factors eliminates gold's role as a portfolio anchor, but they constrain the upside in ways investors should integrate into their scenario planning.
What Drives Silver's Price Through 2031: The Industrial Multiplier
The Demand Floor That Makes Silver Structurally Different
Approximately 58% of global silver demand originates from industrial applications, including photovoltaic solar panels, electric vehicles, advanced electronics, and electrification infrastructure (Silver Institute / Oxford Economics, Silver: The Next Generation Metal, December 2025). Furthermore, silver's dual nature as both a monetary and industrial metal creates a demand floor that persists regardless of investor sentiment. Unlike gold, where investment flows can simply reverse direction, manufacturers require silver to produce goods, and that requirement does not pause during financial market corrections.
The composition of silver's industrial demand is worth disaggregating, as it reveals where the structural growth vectors are concentrated:
- Photovoltaic solar manufacturing: approximately 18 to 20% of total silver demand
- Electrical and electronics applications: approximately 15 to 17%
- Brazing, soldering, and other industrial uses: approximately 8 to 10%
- Photography and chemical processes: approximately 8 to 10%
- Automotive and EV components: a rapidly expanding share with a 3.4% compound annual growth rate projected through 2031 (Silver Institute, December 2025)
The Electric Vehicle Intensity Multiplier
Battery-electric vehicles consume approximately 67 to 79% more silver per unit than internal combustion engine equivalents, according to Silver Institute and Oxford Economics research published in December 2025. This intensity differential matters because EV adoption is not a sentiment-driven trend — it is a manufacturing transition backed by government fleet electrification mandates, corporate sustainability targets, and consumer preference shifts that operate on multi-year timelines.
Automotive silver demand is projected to grow at a 3.4% compound annual rate between 2025 and 2031, according to Silver Institute forecasts. As global EV penetration expands, this demand segment compounds structurally, adding approximately 3 to 4% per year to automotive silver consumption independent of broader macroeconomic cycles.
The Dual-Demand Risk That Silver Investors Must Understand
Silver's hybrid character creates a specific vulnerability that gold does not share. During stagflationary conditions — for example, when inflation is elevated but economic activity is contracting — silver faces opposing pressures simultaneously. The monetary component responds to inflation by driving demand higher. The industrial component responds to economic weakness by contracting, as manufacturers reduce production schedules and capital expenditure. The net price outcome under this scenario is genuinely uncertain, which is why silver's inflation-hedging credentials are less reliable than gold's on a through-cycle basis. For a more detailed comparison, the Perth Mint's analysis of gold vs silver factors offers useful supplementary context.
| Demand Category | Gold | Silver |
|---|---|---|
| Central bank and sovereign | High and structurally growing | Negligible |
| Inflation hedge and monetary | Primary driver | Secondary driver |
| Industrial and manufacturing | Minimal | ~58% of total demand |
| Clean energy and technology | Limited | Significant and expanding |
| Investment and ETF flows | Significant | Moderate |
| Portfolio role | Capital preservation anchor | Growth and industrial exposure layer |
The Gold-to-Silver Ratio: A Practical Rebalancing Framework
How the Ratio Works and What It Currently Signals
The gold-silver ratio is calculated by dividing the spot price of gold by the spot price of silver. It expresses how many ounces of silver are required to purchase one ounce of gold at prevailing market prices. As of early May 2026, the ratio sits at approximately 61 to 62:1, within the long-run historical average band of 60:1 to 80:1 (GoldSilver.com, May 2026).
The ratio's analytical value derives primarily from its extreme readings rather than its mid-range levels. In March 2020, the ratio reached a modern record of 127:1 during peak pandemic market stress, a reading that retrospectively identified silver as extremely undervalued relative to gold. At the 2011 silver price peak, the ratio compressed to approximately 32:1, identifying a point of extreme silver overvaluation relative to gold, ahead of a multi-year silver decline.
The gold-to-silver ratio measures how many ounces of silver equal one ounce of gold in value. Historically, readings above 80:1 have indicated silver is undervalued relative to gold, while readings below 60:1 suggest the reverse. At approximately 61 to 62:1 in May 2026, both metals trade near long-run historical fair value, offering limited immediate tactical rotation guidance.
A Practical Framework for Ratio-Based Portfolio Decisions
| Ratio Level | Historical Signal | Strategic Implication |
|---|---|---|
| Above 80:1 | Silver historically cheap relative to gold | Consider increasing silver allocation |
| 60:1 to 80:1 | Both metals near historical fair value | Maintain existing allocation; monitor |
| Below 60:1 | Gold historically cheap relative to silver | Consider rotating toward gold |
| Below 40:1 | Silver significantly expensive vs. gold | Evaluate tactical profit-taking on silver |
One important caveat: the ratio does exhibit mean reversion tendencies over multi-year horizons, but the timing of that reversion is non-linear and difficult to predict precisely. From the 127:1 March 2020 extreme, the ratio compressed to approximately 70 to 75:1 by mid-2021 before widening again as economic conditions shifted. Investors should, consequently, treat extreme ratio readings as directional signals rather than precise timing tools.
Gold vs. Silver: A Full Investment Comparison
| Investment Factor | Gold | Silver |
|---|---|---|
| Price per ounce (May 2026) | ~$4,500 to $4,600 | ~$73 to $74 |
| 2025 annual gain | ~65% | ~144% |
| All-time high (early 2026) | ~$5,589 | ~$121.64 |
| Volatility profile | Lower | 2 to 3x higher than gold |
| Primary demand driver | Monetary and institutional | Industrial plus monetary |
| Industrial demand share | Minimal | ~58% of total demand |
| Market liquidity | Large and highly liquid | Smaller and less liquid |
| Long-run annual return (1925 to 2023) | ~4.81% | ~3.71% |
| Inflation hedge reliability | Strong and consistent | Moderate and context-dependent |
| Correlation with gold | Benchmark | ~0.7 |
| Portfolio role | Capital preservation | Growth and industrial exposure |
| Physical storage cost | Lower (high value density) | Higher (lower value density) |
What the ~0.7 Correlation Actually Means for Portfolio Construction
Gold and silver move in broadly the same direction approximately 70% of the time. This high correlation means that holding both metals does not provide the same diversification benefit as pairing either metal with uncorrelated asset classes such as bonds, commodities, or alternative strategies. Investors seeking genuine portfolio diversification should treat precious metals as a single thematic allocation within a broader multi-asset framework.
The strategic case for holding both metals rests on role differentiation rather than statistical diversification. Gold functions as the defensive anchor, providing stability when other risk assets decline. Silver functions as the growth and industrial exposure layer, offering higher upside potential anchored by the expanding clean energy manufacturing base. These are complementary roles, not competing ones.
The next major ASX story will hit our subscribers first
Assessing the Real Risks for Both Metals Through 2031
Gold's Risk Landscape
Gold's risk profile is often described as low, but this characterisation is imprecise. Gold carries specific, identifiable risks that investors should price into their allocation decisions:
- Gold has already corrected approximately 19 to 20% from its January 2026 record, and further profit-taking pressure remains possible if macroeconomic conditions stabilise
- Rising real interest rates reduce the opportunity cost advantage of holding a non-yielding asset, and sustained rate increases could suppress price momentum meaningfully
- Prolonged dollar strength creates consistent headwinds for gold priced in US dollar terms, as international buyers face higher effective acquisition costs
- Significant geopolitical de-escalation or improvement in global fiscal discipline would reduce safe-haven demand and weaken a primary price driver
Silver's Risk Landscape
Silver's risk profile carries a higher ceiling and a deeper floor than gold's:
- The approximately 40% correction from silver's January 2026 all-time high to May 2026 levels demonstrates the severity of drawdowns possible in a smaller, less liquid market
- A global economic slowdown or recession would suppress industrial demand, removing the demand floor that distinguishes silver from gold in a downturn scenario
- Technological substitution risk is real: if alternative conductive materials reduce silver's role in solar photovoltaic cells or EV components, the industrial demand thesis weakens structurally over time
- Market illiquidity amplifies price swings in both directions, meaning silver can fall further and faster than fundamentals might justify during periods of forced institutional selling or deleveraging
Neither gold nor silver generates income. Both carry no dividends, interest payments, or cash flows. Their value is entirely mark-to-market, which makes position sizing and entry timing more consequential than with income-generating assets. Investors should size precious metals positions accordingly.
How to Build a Gold and Silver Allocation: A Scenario-Based Framework
Step 1: Establish Your Total Precious Metals Allocation
Most financial advisers recommend allocating between 5% and 15% of a diversified portfolio to precious metals in aggregate. The appropriate total depends on risk tolerance, investment horizon, and the specific portfolio function being served — whether that is inflation hedging, crisis insurance, or growth exposure through industrial demand.
Step 2: Determine Your Gold-Silver Split by Investor Profile
| Investor Profile | Recommended Gold Allocation | Recommended Silver Allocation | Primary Objective |
|---|---|---|---|
| Conservative | 8 to 10% of portfolio | 2 to 3% of portfolio | Capital preservation and stability |
| Moderate | 5 to 8% of portfolio | 3 to 5% of portfolio | Balance of security and growth |
| Aggressive / Growth-Oriented | 3 to 5% of portfolio | 7 to 10% of portfolio | Maximum silver industrial upside |
Step 3: Choose the Right Investment Vehicle
The choice between physical gold vs ETFs is one of the most consequential structural decisions in any precious metals allocation. The table below summarises the key options:
| Method | Description | Best Suited For |
|---|---|---|
| Physical bullion (coins and bars) | Direct ownership; held personally or in a vault | Long-term holders prioritising tangibility and counterparty elimination |
| ETFs (such as GLD, SLV, PHYS, PSLV) | Most liquid and accessible; no storage costs | Investors prioritising ease of access and portfolio flexibility |
| Mining equities | Indirect exposure with potential for leveraged returns | Growth-oriented investors comfortable with company-specific equity risk |
| Precious metals mutual funds | Diversified basket of mining and royalty companies | Investors seeking exposure with dividend income potential |
Step 4: Apply Dollar-Cost Averaging to Reduce Timing Risk
Rather than committing a lump sum at a single price point, spreading purchases across regular intervals reduces the impact of entry timing on long-term returns. This approach is particularly relevant for silver, given its higher volatility and susceptibility to sharp short-term corrections. Consistent smaller purchases spread over 12 to 24 months can meaningfully reduce the average cost basis relative to a single large entry, particularly when markets are trading near recent highs following significant annual gains. Morgan Stanley's decision guide for gold and silver investing provides further institutional perspective on this approach.
Three Scenarios: How Gold and Silver Respond to Different Economic Environments
Scenario A: Stagflation (High Inflation Combined with Economic Contraction)
- Gold performs strongly: monetary demand surges as currency confidence erodes, while gold's near-absence of industrial exposure insulates it from economic demand destruction
- Silver faces conflicting pressures: inflation supports monetary demand for silver, but economic weakness suppresses industrial consumption from manufacturers and clean energy developers
- The net outcome for silver under stagflation is genuinely uncertain, making it the more difficult asset to hold with conviction
- Allocation implication: Overweight gold relative to silver; consider reducing silver toward minimum tactical exposure until industrial demand trajectory becomes clearer
Scenario B: Sustained Global Economic Expansion
- Silver outperforms: industrial demand accelerates across solar, EV, AI infrastructure, and electronics sectors; clean energy investment compounds silver consumption volumes
- Gold underperforms relative to silver: strong economic conditions reduce safe-haven urgency; real interest rates may rise, creating persistent headwinds for a non-yielding asset
- Allocation implication: Increase silver weighting toward the upper range of your risk profile; gold maintained as portfolio anchor but reduced from maximum allocation
Scenario C: Geopolitical Crisis or Financial System Stress
- Gold surges: institutional and sovereign buyers accelerate accumulation; safe-haven demand dominates all other signals; central bank buying intensity increases further
- Silver initially follows gold higher before potentially diverging if economic damage materialises and industrial demand contracts due to production slowdowns
- Allocation implication: Maximum gold allocation appropriate; silver maintained at current levels but not increased until the industrial demand trajectory clarifies beyond the immediate crisis period
Frequently Asked Questions: Gold vs Silver Investment Guide
Is gold or silver the better investment for the next five years?
Neither metal dominates across all economic scenarios, which is precisely the argument for holding both. Gold provides more reliable capital preservation and performs consistently during financial stress events. Silver offers materially higher growth potential, anchored by structural industrial demand from clean energy manufacturing and electrification infrastructure, but carries substantially greater volatility. A blended allocation captures the complementary strengths of both without concentrating risk in either direction.
What is the gold-to-silver ratio and how should investors use it?
The ratio measures how many ounces of silver are required to purchase one ounce of gold at current spot prices. Historically, a ratio above 80:1 has indicated silver is undervalued relative to gold. A ratio below 60:1 suggests gold offers better relative value. At approximately 61 to 62:1 in May 2026, both metals sit near long-run fair value, meaning dramatic tactical rotations are not strongly indicated at current levels. The ratio's greatest utility comes at its extremes, not at its midpoint.
Why does silver fall harder than gold during market corrections?
Two structural factors explain silver's amplified drawdowns. First, silver's market is significantly smaller and less liquid than gold's, meaning large sell orders move prices more severely as market depth disappears rapidly during risk-off episodes. Second, approximately 58% of silver demand is industrial, making prices sensitive to economic cycle deterioration in a way that gold's primarily monetary demand is not. The approximately 40% correction from silver's January 2026 record high to May 2026 levels illustrates both factors operating simultaneously.
How much of a portfolio should be allocated to precious metals?
The widely cited range is 5% to 15% of a diversified portfolio. Conservative investors typically sit at the lower end with a heavy gold weighting. Growth-oriented investors may approach 15%, with a larger silver component reflecting the industrial demand growth thesis. Neither metal generates income, so allocation sizing should reflect the specific portfolio function being served rather than speculative conviction alone.
Is silver a reliable hedge against inflation?
Silver provides a moderate inflation hedge, but its reliability is lower than gold's across full economic cycles. Gold has a longer and more consistent track record of preserving real purchasing power through inflationary periods. Silver's industrial demand component introduces variables that can pull its price in opposing directions simultaneously, particularly during stagflation, when high prices and economic contraction coexist.
What is the most cost-efficient way to gain silver exposure?
Silver ETFs such as SLV or PSLV offer the lowest-friction entry point for most investors, providing high liquidity and no storage costs. Physical silver coins and bars provide direct ownership and eliminate counterparty risk but require secure storage and carry dealer premiums over spot. Mining equities offer leveraged upside exposure but introduce company-specific operational and financial risks. For most investors beginning to build precious metals exposure, ETFs represent the most accessible and cost-efficient starting point.
Does holding both gold and silver provide genuine portfolio diversification?
Not in the traditional statistical sense. Gold and silver carry an approximate 0.7 correlation, meaning they tend to move in the same direction around 70% of the time. The value of holding both lies in role differentiation rather than statistical diversification. Gold functions as the defensive anchor; silver functions as the growth and industrial exposure layer. For true portfolio diversification, however, precious metals exposure should be complemented by genuinely uncorrelated asset classes.
Key Principles for Building a Deliberate Precious Metals Strategy
The most important shift any investor can make in approaching precious metals is moving from a selection mindset to an architecture mindset. The question is not which metal is better. The question is what role each metal plays, under which conditions, and at what portfolio weight.
Several structural conclusions emerge from examining both metals across multiple demand frameworks and economic scenarios:
- Gold and silver serve fundamentally different portfolio functions, and treating them as interchangeable alternatives misses the strategic value of holding both with deliberate, differentiated intent
- Gold's structural demand case rests on institutional and sovereign accumulation at historically elevated rates, with 863 tonnes purchased by central banks in 2025 alone, representing 15 consecutive years of net buying
- Silver's structural demand case rests on industrial growth compounding across solar energy, EV manufacturing, and electrification infrastructure, with automotive demand alone projected to grow at 3.4% CAGR through 2031
- The gold-to-silver ratio at approximately 61 to 62:1 as of May 2026 places both metals near long-run historical fair value, suggesting neither extreme undervaluation nor overvaluation on a relative basis
- Silver's approximately 40% correction from its January 2026 all-time high is not a reason to avoid the metal — it is a reason to understand its volatility mechanics before committing capital, and to size positions in proportion to the drawdowns you can tolerate without making reactionary decisions
The precious metals cycle from 2025 to 2026 reinforced a principle that experienced commodity investors have known across multiple cycles: the metals that generate the most excitement at their peaks are also the ones that punish underprepared investors most severely during corrections. Building a deliberate allocation strategy — one informed by a thorough gold vs silver investment guide — before price volatility forces a reactive decision is the single most valuable step any investor can take in this asset class.
Disclaimer: This article is for informational and educational purposes only and does not constitute financial or investment advice. All investments, including precious metals, involve risk and may result in partial or total loss. Past performance is not indicative of future results. Readers should consult a qualified financial adviser before making any investment decisions. Price data referenced reflects market conditions as of early May 2026 and is subject to change.
Want to Know When the Next Major Mineral Discovery Hits the ASX?
Discovery Alert's proprietary Discovery IQ model scans ASX announcements in real time, delivering instant alerts on significant mineral discoveries — from gold and silver to over 30 other commodities — so subscribers can act on actionable opportunities before the broader market catches on. Start your 14-day free trial at Discovery Alert today, or explore the historic returns major discoveries have generated to understand what finding the next big one early can mean for a portfolio.