
August 14, 2026
When Labor Markets Speak, Gold Listens
Few relationships in global finance are as consistent as the one between employment data and precious metals pricing. When economies generate jobs at a healthy clip, central banks gain the political and economic cover to raise interest rates, pulling capital toward yield-bearing instruments and away from non-yielding assets like gold. When that job creation falters, the calculus reverses with remarkable speed. This is not a recent phenomenon. The mechanical link between labour market health, interest rate expectations, and bullion valuations has defined gold's behaviour across multiple economic cycles, making each monthly payrolls release one of the most closely watched scheduled events on the commodities calendar.
Understanding this mechanism is essential for anyone tracking why gold rises on weak US jobs data with such reliability, and why the July 2026 nonfarm payrolls miss produced such an immediate and broad-based response across the entire precious metals complex. Furthermore, understanding gold and bond dynamics helps contextualise how these macro forces interact across asset classes simultaneously.
When big ASX news breaks, our subscribers know first
The Mechanics Behind Gold's Rate Sensitivity
Gold's price behaviour is fundamentally anchored to one variable: the opportunity cost of holding it. Unlike bonds, savings accounts, or dividend-bearing equities, gold generates no income. When interest rates are rising or expected to rise, the returns available from yield-bearing assets climb, making the decision to hold bullion increasingly expensive in relative terms. When rate expectations soften, that penalty dissolves, and gold becomes comparatively attractive almost immediately.
The Federal Reserve sits at the centre of this dynamic. Its rate decisions directly influence the real yield environment in which all non-yielding assets are priced. Traders do not wait for actual rate changes. They position in anticipation, which is why tools like the CME FedWatch Tool have become so central to intraday precious metals trading. The FedWatch instrument aggregates federal funds futures contracts to calculate the implied probability of rate decisions at upcoming Fed meetings, giving market participants a continuously updated read on where monetary policy is heading.
When the July 2026 payrolls report landed, the FedWatch probabilities shifted almost instantly, and gold's price moved in lockstep.
What the Jobs Report Revealed and Why It Mattered
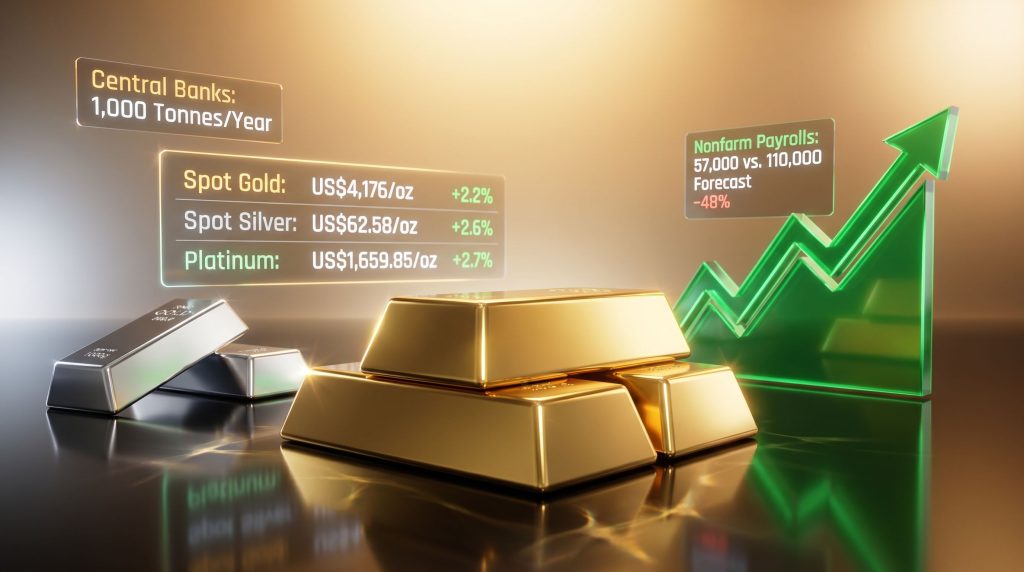
The US Bureau of Labor Statistics reported that nonfarm payrolls expanded by just 57,000 positions in the prior month, a figure that arrived 48% below the Reuters consensus forecast of 110,000 jobs. This was not a marginal miss. It represented a significant deterioration in hiring momentum that forced a rapid reassessment of the Fed's likely policy path heading into its September meeting.
| Metric | Reported Figure | Market Consensus | Variance |
|---|---|---|---|
| Nonfarm Payrolls Added | 57,000 | 110,000 | -48% |
| Unemployment Rate | 4.2% | N/A | N/A |
| Fed September Rate Hike Probability (Before) | 66% | N/A | N/A |
| Fed September Rate Hike Probability (After) | ~51-54% | N/A | N/A |
| USD Index Movement | -0.7% | N/A | N/A |
The near-term probability of a September Fed rate increase dropped from 66% to approximately 51-54% within hours of the release. That shift of roughly 12-15 percentage points translated directly into bullion demand, as traders repriced the opportunity cost of gold holdings downward in real time. According to reporting from Business Times, similar dynamics have produced comparable price surges in previous cycles of soft payroll data.
Currency dynamics added further momentum. The US dollar moved toward its largest weekly decline since April, a consequence of the same rate expectation repricing. Because gold is denominated globally in US dollars, a weaker dollar mechanically reduces the effective price of bullion for buyers operating in other currencies, expanding the addressable demand pool and providing a secondary price catalyst that operates independently of, but typically concurrent with, rate expectation shifts.
How Precious Metals Markets Responded Across the Complex
The response was not confined to gold. The repricing extended across the entire precious metals spectrum, reflecting a broad-based reassessment of the monetary environment rather than asset-specific factors.
| Asset | Price Level | Session Gain | Weekly Position |
|---|---|---|---|
| Spot Gold | US$4,176.29/oz | +1.3% | First weekly gain after 4 consecutive losses |
| Gold Futures (August) | US$4,188.80/oz | +1.53% | Weekly advance |
| Spot Silver | US$62.58/oz | +2.6% | Weekly gain |
| Platinum | US$1,659.85/oz | +2.7% | Weekly gain |
| Palladium | US$1,277.25/oz | +0.7% | Weekly gain |
Spot gold climbed to US$4,176.29 per ounce, marking its highest level since June 23 and accumulating a weekly advance exceeding 2%. Gold futures for August delivery settled at US$4,188.80 per ounce, a gain of 1.53% on the session. Technically, gold's recovery above its 21-day moving average with a sustained weekly gain signals a potential inflection point following the four-week corrective phase that had eroded significant value from earlier 2026 highs.
Silver's 2.6% single-session advance to US$62.58 per ounce is particularly noteworthy given the metal's turbulent trajectory over 2026. Silver peaked above US$121 per ounce earlier in the year during a period of combined gold safe-haven demand and retail investor enthusiasm, before suffering a correction that erased as much as 36% of its value. The severity of that drawdown led some market participants to describe silver as effectively untradeable during peak volatility periods, highlighting the metal's historically amplified response to macro sentiment shifts relative to gold.
Situating the Rally Within a Larger Structural Narrative
It is worth examining what preceded this recovery to understand whether the July 2026 bounce represents a genuine trend reversal or simply a reflexive response to a single data point.
The June correction in gold was not random. It reflected a purposeful repricing as markets absorbed a more hawkish Fed posture than had been anticipated at the start of 2026. Inflationary pressures connected to the global energy disruption following the outbreak of conflict in Iran reversed expectations of monetary easing that had briefly dominated market sentiment, pushing the Fed toward a tightening bias that directly compressed gold's near-term upside potential.
Bank of America, which had issued a target of US$6,000 per ounce for gold in January 2026, subsequently revised that projection downward, citing the rising probability of rate increases extending into December 2026 as cutting the commodity's short-term upside by roughly half. That revision serves as a useful reminder that even structurally bullish analysts must recalibrate when the rate environment shifts meaningfully.
"For gold to resume a sustained structural uptrend, the data landscape would need to consistently validate the current softening of labour market conditions. A single weak payrolls report is necessary but not sufficient evidence of a trend."
Three scenarios frame the remainder of 2026 for precious metals:
| Scenario | Trigger Condition | Likely Gold Price Impact |
|---|---|---|
| Bullish Continuation | Further labour market softening; Fed pauses rate hikes | Sustained rally toward prior highs |
| Range-Bound Consolidation | Mixed economic data; Fed signals data dependency | Sideways trading with elevated volatility |
| Bearish Reversal | Inflation re-acceleration; strong payrolls rebound | Renewed correction; rate hike bets return |
Structural Demand: The Foundation Beneath the Volatility
While short-term price movements reflect rate expectation dynamics, the multi-year bull cycle in gold is underpinned by structural demand forces that operate largely independently of any single payrolls report. Central bank gold reserves represent one of the most significant of these forces, and their accumulation has accelerated dramatically in recent years.
The World Gold Council's 2026 Central Bank Gold Reserves Survey documented an extraordinary acceleration in official sector accumulation. Central banks have been purchasing an average of 1,000 tonnes of gold annually over the past four years, representing double the 500-tonne annual pace recorded during the preceding decade. This is not speculative investment. It reflects deliberate reserve diversification strategies by sovereign institutions responding to geopolitical fragmentation, currency risk, and the demonstrated performance of gold during systemic stress events.
The survey findings reveal the specific motivations driving this behaviour:
| Central Bank Survey Factor | Share of Respondents Citing as Highly Relevant |
|---|---|
| Gold's historical crisis performance | 90% |
| Interest rate environment | 92% |
Physical investment demand has reinforced the institutional picture. Global bar and coin purchases rose 42% year-on-year to 474 tonnes, led by Eastern markets where retail gold accumulation remains deeply embedded in household saving cultures. This demand layer provides price support that is largely insensitive to short-term rate fluctuations, functioning as a structural floor beneath the more volatile macro-driven price movements.
The next major ASX story will hit our subscribers first
Silver's Dual Identity: Monetary Metal and Industrial Commodity
Silver occupies a structurally unique position in the precious metals complex that differentiates it meaningfully from gold. Where gold's price drivers are predominantly monetary, silver's dual role straddles two distinct demand categories that can amplify its movements in either direction.
Monetary demand for silver tracks broadly with gold, responding to rate expectations, dollar strength, and safe-haven sentiment. Industrial demand for silver, however, is driven by its physical properties: it is the most electrically conductive metal on earth, making it irreplaceable in solar panels, electronics, electric vehicle components, and a growing range of green energy applications.
This dual exposure means silver can outperform gold during periods of simultaneous economic optimism and monetary easing, but can also underperform during stagflationary conditions where industrial demand weakens while inflation remains elevated. The gold-to-silver ratio, which divides the gold price by the silver price, functions as a relative value signal for precious metals investors. A historically elevated ratio suggests silver is undervalued relative to gold on a long-term mean-reversion basis, while a compressed ratio indicates the opposite.
For Mexico specifically, which holds the distinction of being the world's largest silver producer, these dynamics carry direct operational and economic significance. Elevated silver prices widen project economics across the country's substantial silver mining base, but the volatility seen in 2026 underscores why cost discipline and hedging strategies matter as much as headline metal prices.
Mining Economics in a High-Volatility Price Environment
Price surges are welcome news for mining operators, but experienced investors and financiers evaluate project quality through a more granular lens than spot prices alone. The metric that has become the industry standard for this assessment is all-in sustaining cost (AISC).
AISC captures the comprehensive cost of producing one ounce of gold or silver equivalent, incorporating not just direct mining costs but also capital expenditure for sustaining existing operations, corporate administration, and environmental compliance. It is the most honest representation of what it actually costs to keep an ounce of metal flowing from a mine to market.
In volatile price environments, AISC discipline becomes the primary differentiator between projects that attract institutional capital and those that struggle to secure funding regardless of how high spot prices climb. A project with a high AISC is structurally fragile during price corrections, even if it appears profitable during peaks. A project with a genuinely competitive AISC, however, retains margin resilience across the cycle.
The capital allocation criteria that financiers apply before committing to gold and silver projects in jurisdictions like Mexico reflect this reality:
| Capital Allocation Threshold | Why It Matters to Investors |
|---|---|
| AISC Competitiveness | Determines margin resilience during price corrections |
| Regulatory Clarity | Reduces permitting and operational risk premiums |
| Reserve Life | Signals long-term cash flow sustainability |
| ESG Performance | Increasingly required by institutional mandates |
Established producers with proven operating track records, optimised cost structures, and demonstrated regulatory navigation capability are best positioned to capture the upside from price surges. Furthermore, Kitco's market analysis has consistently highlighted how gold rises on weak US jobs data precisely because institutional capital flows toward lower-risk, established positions in such environments. Junior explorers and greenfield projects, by contrast, face amplified exposure to price swings precisely because they lack the cash flow buffer and operational optionality that mature operations provide.
Hedging strategies add another dimension to this picture. In high-volatility environments, forward sales and options structures allow producers to lock in favourable pricing on a portion of future production, effectively insulating margins from short-term drawdowns while preserving some upside exposure. The decision of how much production to hedge, and at what price levels, represents one of the most consequential capital allocation choices a mining management team makes.
Frequently Asked Questions: Gold, Jobs Data, and Precious Metals Markets
Why does gold rise on weak US jobs data?
Disappointing employment figures reduce the probability that the Federal Reserve will raise interest rates in the near term. Lower rate expectations reduce the opportunity cost of holding gold, a non-yielding asset, making it more attractive relative to interest-bearing instruments. The result is typically an immediate increase in bullion demand and a corresponding price rise.
What is the CME FedWatch Tool and why do precious metals traders use it?
The CME FedWatch Tool aggregates federal funds futures market positioning to calculate the implied probability of Federal Reserve rate decisions at upcoming policy meetings. Because rate probability shifts are among the most reliable short-term drivers of gold price direction, traders monitor it continuously to anticipate and respond to changing monetary policy expectations.
How does a weaker US dollar affect gold prices?
Gold is priced globally in US dollars. When the dollar weakens, the same ounce of gold becomes cheaper in terms of other currencies, expanding the pool of buyers who can access it at current prices. This mechanically increases demand and provides a secondary price catalyst that operates alongside, but independently from, rate expectation dynamics.
What is AISC and why does it matter for mining investors?
All-in sustaining cost (AISC) is the comprehensive measure of what it costs a mining operation to produce one ounce of gold or silver equivalent, including capital expenditure, administrative overhead, and environmental compliance. Investors use AISC as the primary proxy for margin resilience, since operations with competitive AISC structures remain profitable even if metal prices retrace significantly from peak levels.
How much gold are central banks currently buying?
According to the World Gold Council's 2026 Central Bank Gold Reserves Survey, official sector institutions have been purchasing approximately 1,000 tonnes of gold annually over the past four years. This pace represents double the 500-tonne annual average recorded in the preceding decade and constitutes one of the most significant structural demand pillars supporting the current bull market in bullion.
This article contains forward-looking analysis and scenario projections based on available market data and publicly reported survey findings. Precious metals prices are subject to significant volatility driven by macroeconomic, geopolitical, and monetary policy factors. Nothing in this article constitutes financial advice. Readers should conduct independent research and consult qualified financial professionals before making investment decisions.
Want to Capitalise on the Next Major Precious Metals Discovery Before the Market Does?
Discovery Alert's proprietary Discovery IQ model delivers real-time alerts on significant ASX mineral discoveries, instantly translating complex geological and commodity data into actionable investment insights for both short-term traders and long-term investors. Explore how historic discoveries have generated substantial returns on Discovery Alert's dedicated discoveries page, and begin your 14-day free trial today to position yourself ahead of the broader market.