July 17, 2026
When War Fuels Inflation Instead of Fear: Gold's Counterintuitive Selloff
There is a widely held assumption among investors that geopolitical conflict is inherently bullish for gold. History has reinforced this idea repeatedly, from Cold War tensions to post-9/11 safe-haven flows. But that assumption contains a critical blind spot: it only holds when conflict generates deflationary fear, not inflationary pressure. When military escalation disrupts energy supply chains, the economic transmission mechanism runs in the opposite direction, ultimately punishing the very asset investors expect to benefit.
That is precisely the dynamic now reshaping precious metals markets in mid-2026. Gold weekly loss on Iran war inflation worries has become one of the defining market stories of the year, exposing how supply-side geopolitical shocks can invert conventional safe-haven logic and place non-yielding assets like gold under sustained structural pressure.
When big ASX news breaks, our subscribers know first
Three Simultaneous Forces Creating a Perfect Storm for Gold Bears
Rarely do commodity markets face three negative catalysts converging in a single week, but that is the environment gold bulls have been forced to navigate. The U.S.-Iran military escalation, a violent surge in crude oil prices, and a meaningful shift in Federal Reserve rate expectations have arrived simultaneously, creating compounding headwinds rather than isolated risks.
Understanding why this particular combination is so damaging requires unpacking each force individually before examining how they reinforce one another.
The Geopolitical Trigger and Its Energy Market Consequences
Renewed and intensifying exchanges between U.S. and Iranian forces throughout the week effectively unravelled a ceasefire that had been holding since the prior month. As hostilities deepened, attention shifted immediately to the Strait of Hormuz, the narrow waterway through which roughly 20% of the world's seaborne oil supply passes. Any credible threat to that chokepoint carries enormous implications for global energy pricing.
Compounding the Hormuz risk, Tehran signalled to Houthi forces that they should prepare to activate their capacity to disrupt the Red Sea export corridor, a second critical maritime route for global energy flows. The combination of these two threatened disruptions sent crude oil prices surging approximately 12% over the course of a single week, one of the sharpest weekly oil moves seen in years. Furthermore, this crude oil price analysis underscores just how rapidly energy market stress can spill over into broader macro pricing dynamics.
This is not merely an energy market story. A 12% weekly oil spike is an inflation story, a monetary policy story, and therefore a gold story.
Why a 3.4% Weekly Gold Decline Deserves Serious Attention
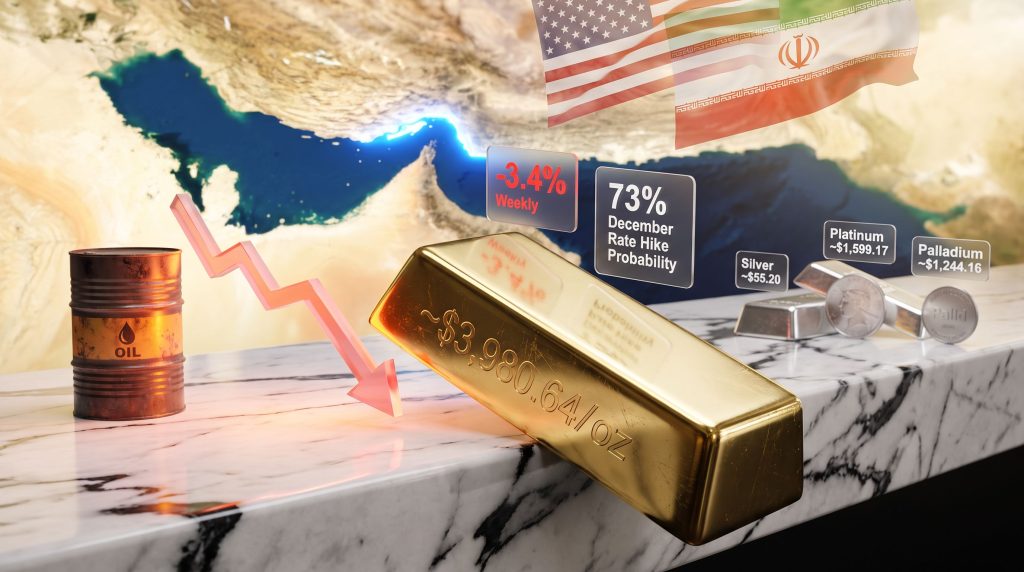
Spot gold closed the week around $3,980.64 per ounce, while U.S. gold futures for August delivery settled near $3,984.10 per ounce. The metal's 3.4% weekly decline represented its largest such loss since the week ending June 1, 2026, and extended a losing streak that had reached eight consecutive sessions by the time the week concluded.
Putting this into a broader context, gold had already declined somewhere between 13% and 20% from its conflict-era peak since the escalation cycle began, a substantial retracement that challenges the narrative of gold as an automatic war hedge. Indeed, the geopolitical gold drivers that once pushed the metal to record highs have, in this instance, conspired to work against it.
| Metric | Value |
|---|---|
| Spot gold price (July 17, 2026) | ~$3,980.64/oz |
| U.S. gold futures (August delivery) | ~$3,984.10/oz |
| Weekly gold price decline | ~3.4% |
| Weekly oil price surge | ~12% |
| Consecutive sessions of gold decline | 8 sessions |
| Cumulative decline since conflict began | ~13–20% |
| December rate hike probability (CME FedWatch) | 73% |
How an Oil Shock Transmits Into Gold Suppression
The mechanism connecting crude oil prices to gold valuations is not immediately obvious to casual observers, but it follows a logical chain that experienced traders track closely. Understanding each link in this chain is essential for interpreting why even moderating inflation data failed to support gold prices this week.
Tim Waterer, chief market analyst at KCM Trade, noted that despite softer June U.S. consumer price index and producer price index readings, the oil price surge effectively neutralised any relief those figures might have provided to the gold market. Inflation concerns driven by energy prices overwhelmed the positive signal from recent CPI and PPI prints, leaving traders without a credible bullish catalyst.
This is the paradox of an oil-driven inflationary shock: even when backward-looking inflation data improves, forward-looking inflation expectations deteriorate because markets price the energy surge into future price levels before official statistics can capture it. According to recent reporting on gold's weekly losses, this dynamic has been a persistent feature of the current escalation cycle.
Step-by-step: How an oil shock suppresses gold prices
-
Geopolitical conflict disrupts critical oil supply routes, including the Strait of Hormuz and the Red Sea corridor
-
Crude prices surge sharply, injecting energy-driven cost pressure across the broader economy
-
Forward-looking inflation expectations rise, even when recent CPI or PPI readings appear moderate
-
Central banks signal a preference for tighter monetary policy or delay previously anticipated rate cuts
-
Real yields climb as nominal rate expectations increase faster than inflation breakevens
-
The opportunity cost of holding non-yielding gold increases significantly relative to yield-bearing alternatives
-
Capital rotates toward interest-bearing instruments, reducing marginal demand for gold
-
Gold prices fall despite the geopolitical uncertainty that might otherwise generate safe-haven buying
The Federal Reserve's Pivotal Role in the Gold Selloff
Monetary policy expectations have arguably been the most consequential variable in gold's weekly performance. Two senior Federal Reserve officials delivered notably hawkish signals during the week, and markets responded with a rapid repricing of rate hike probability.
Dallas Fed President Lorie Logan became the first official within Fed Chair Kevin Warsh's cohort to publicly advocate for an interest rate increase, a significant step that markets interpreted as a potential signal of shifting internal consensus. Shortly after, Fed Vice Chair Philip Jefferson indicated openness to raising rates should near-term inflation data fail to show meaningful improvement.
The combined effect of these statements was swift and measurable. According to the CME FedWatch Tool, market-implied probability of a December rate hike climbed to 73%, a level that represents a decisive shift in the monetary policy landscape for non-yielding assets. However, understanding the relationship between gold and bonds helps contextualise why this rate repricing has been so damaging for precious metals.
At a 73% market-implied probability for a December rate hike, the monetary environment has moved firmly against gold in the near term. Non-yielding assets historically face structural headwinds whenever rate hike probability crosses the 50% threshold, and the current reading sits well above that level.
The concept of "higher for longer" interest rates, which had been receding as a market concern earlier in the year, has resurfaced with renewed force. For gold, this means the ceiling on price recovery is defined not just by geopolitical resolution but by when the Fed can credibly pivot back toward accommodation.
When Does War Help Gold and When Does It Hurt?
One of the most underappreciated distinctions in precious metals analysis is the difference between conflict types and their inflationary implications. Not all geopolitical crises are created equal from gold's perspective.
| Scenario Type | Gold Reaction | Key Driver |
|---|---|---|
| Financial crisis or banking stress | Bullish | Flight to safety, falling rate expectations |
| Demand-side recession fears | Bullish | Rate cut expectations increase |
| Supply-side energy shock driven by conflict | Bearish | Inflation leads to rate hikes and higher real yields |
| Currency debasement or fiscal excess | Bullish | Store of value demand rises |
| Geopolitical conflict with energy disruption | Mixed to Bearish | Inflation concerns dominate monetary dynamics |
The U.S.-Iran escalation fits squarely into the supply-side energy shock category, which historically generates a stagflationary rather than deflationary economic impulse. In stagflationary environments, growth weakens while inflation persists, creating a policy dilemma for central banks that typically resolves into a tightening bias rather than accommodation.
Historical episodes offer instructive parallels. The 1973 Arab oil embargo and the 1979 Iranian revolution both triggered energy-driven inflationary surges. While gold did eventually perform well across those multi-year cycles, the initial monetary tightening response created periods of significant gold underperformance before the metal's long-term store-of-value characteristics reasserted themselves. The lesson is that stagflationary shocks can be ultimately bullish for gold, but the path there is rarely linear or immediately rewarding.
The Broader Precious Metals Selloff
Gold was not alone in its weekly decline. All four major precious metals recorded losses, suggesting the selling pressure reflected a broad repositioning of precious metals exposure rather than gold-specific factors. Furthermore, the impact on gold and silver prices has been particularly striking, given silver's additional exposure to industrial demand softening.
| Metal | Price (July 17, 2026) | Weekly Direction |
|---|---|---|
| Gold (spot) | ~$3,980.64/oz | Down ~3.4% |
| Silver (spot) | ~$55.20/oz | Negative |
| Platinum | ~$1,599.17/oz | Down ~1.1% (session) |
| Palladium | ~$1,244.16/oz | Down ~0.4% (session) |
Silver's dual role as both a monetary and industrial metal creates a slightly different risk profile than gold. When rate hike expectations rise, silver faces monetary headwinds similar to gold. However, if a broader economic slowdown follows the energy shock, industrial demand for silver could also soften, creating a compounding negative. Platinum and palladium, which are more heavily weighted toward industrial and automotive demand, face their own set of pressures tied to manufacturing activity and energy-intensive production costs.
The uniformity of the decline across all four metals is notable. It signals that investors are not simply rotating within the precious metals complex but reducing overall exposure to the asset class.
The next major ASX story will hit our subscribers first
Strait of Hormuz: The Chokepoint That Markets Cannot Ignore
The Strait of Hormuz is approximately 33 kilometres wide at its narrowest navigable point, yet it carries a disproportionate share of the world's energy burden. Roughly one-fifth of global seaborne petroleum flows through this single waterway, making it arguably the most consequential maritime chokepoint in the global economy.
Any sustained restriction of Hormuz traffic would not produce a brief inflationary spike but a prolonged elevation of energy costs that would embed itself into core CPI readings over multiple quarters. Core inflation, which excludes food and energy, typically remains stable in the early stages of an oil shock but absorbs the impact over subsequent months as transportation, manufacturing, and service costs adjust upward.
If Hormuz disruption persists well beyond a brief escalation period, the inflationary impulse could extend the window in which the Federal Reserve maintains a tightening orientation, keeping structural headwinds in place for gold throughout the remainder of 2026.
Tehran's instruction to Houthi forces to stand ready to activate Red Sea disruption adds a second layer of supply risk. The Red Sea route is critical for energy exports flowing toward Europe, and simultaneous pressure on both corridors would represent an unprecedented dual chokepoint scenario for global oil markets. As analysis of the crisis in the Strait of Hormuz makes clear, the inflationary feedback loop from a prolonged closure could be severe.
Scenario Mapping: Gold's Potential Paths Forward
With so many interdependent variables in motion, gold's near-term trajectory will depend on how several key factors evolve over the coming weeks and months.
| Scenario | Oil Price Path | Federal Reserve Response | Gold Outlook |
|---|---|---|---|
| A: Rapid De-escalation | Retreats sharply | Rate cuts resume | Bullish recovery likely |
| B: Sustained Conflict | Remains elevated | Rate hikes proceed | Continued downward pressure |
| C: Stagflation Emerges | Structurally elevated | Policy paralysis | Mixed near-term; potentially bullish longer term |
Scenario A requires a genuine and durable ceasefire that removes the supply threat to the Strait of Hormuz and Red Sea. Under this outcome, oil prices would retreat, inflation expectations would moderate, and the Fed could resume its prior rate-cutting trajectory. Gold would likely recover meaningfully.
Scenario B assumes the current escalation cycle extends for multiple months without resolution. In this environment, oil stays elevated, forward inflation expectations remain sticky, and the Fed follows through on the December rate hike already priced at 73% probability. Gold faces continued pressure.
Scenario C is the most complex outcome. If energy inflation becomes embedded in core price indices while economic growth simultaneously deteriorates, the Fed faces a policy bind. In true stagflationary environments, gold's role as a store of value can eventually reassert itself, though the timing is highly uncertain and the near-term path can remain painful for holders.
Frequently Asked Questions
Why is gold falling when there is a war happening?
Gold does not automatically benefit from every type of geopolitical conflict. When military escalation disrupts energy supply and drives oil prices higher, the resulting inflationary pressure raises interest rate expectations. Since gold pays no yield, rising rates increase the opportunity cost of holding it, causing investors to reduce exposure even as uncertainty remains elevated. The gold safe-haven dynamics that typically attract capital during crises are, consequently, overridden by this rate-sensitive mechanism.
Does higher oil inflation always hurt gold prices?
Not always, and not indefinitely. In the early and middle phases of an energy shock, the inflation-rate hike dynamic typically weighs on gold. Over longer time horizons, if energy inflation becomes persistent enough to erode real purchasing power, gold can recover its role as a store of value. The key variable is the speed and degree of monetary policy tightening relative to the pace of inflation.
How does the CME FedWatch Tool measure rate hike probability?
The CME FedWatch Tool derives rate hike probabilities from federal funds futures contracts traded on the Chicago Mercantile Exchange. These contracts reflect market participants' collective expectations for where the overnight lending rate will sit at each upcoming Federal Open Market Committee meeting. A 73% reading for December means futures markets are implying roughly three-in-four odds of a rate increase at that meeting.
Is now a good time to buy gold during a geopolitical selloff?
This is a question that carries significant uncertainty and depends heavily on individual risk tolerance, investment horizon, and macroeconomic outlook. Historically, conflict-driven selloffs in gold have sometimes offered medium-term entry opportunities, particularly when the underlying geopolitical situation resolves. However, if the inflationary shock proves durable and rate hikes proceed as currently priced, gold could face further pressure before recovering. This does not constitute financial advice, and investors should consult qualified advisers before making any investment decisions.
What the Gold Selloff Reveals About the 2026 Macro Landscape
The week ending July 17, 2026 will likely be studied as a case study in how the type of geopolitical risk matters as much as its intensity. Gold bulls who positioned on the assumption that any conflict equals safe-haven demand discovered that the specific mechanics of an energy-disrupting war run directly counter to gold's fundamental value proposition in a rate-sensitive environment.
Several key observations emerge from the week's price action:
-
Geopolitical risk alone is no longer sufficient to sustain or initiate a gold rally when the conflict carries inflationary energy implications
-
The inflation-rate hike-real yield feedback loop has become the dominant pricing mechanism for precious metals in the current macro regime
-
Broad precious metals selling, spanning gold, silver, platinum, and palladium simultaneously, signals macro repositioning rather than metal-specific concerns
-
The CME FedWatch Tool's 73% December rate hike probability represents a clear and quantifiable headwind that the market has already partially priced
-
Resolution of the Hormuz and Red Sea supply threats remains the most consequential near-term variable for gold's directional outlook
The gold weekly loss on Iran war inflation worries is a reminder that macro frameworks require constant updating. The rules governing safe-haven asset behaviour are not static, and the difference between a deflationary shock and an inflationary one can mean the difference between gold's best week and its worst.
Disclaimer: This article is intended for informational and educational purposes only and does not constitute financial advice or a recommendation to buy or sell any asset. Precious metals markets involve significant risk, and past performance is not indicative of future results. Readers should consult qualified financial advisers before making investment decisions. All price data referenced reflects conditions as of July 17, 2026.
Want to Spot the Next Major ASX Mineral Discovery Before the Market Does?
While gold navigates complex macro headwinds, significant mineral discoveries on the ASX continue to generate substantial returns regardless of the broader commodities cycle — and Discovery Alert's proprietary Discovery IQ model delivers real-time alerts the moment those discoveries are announced, transforming complex geological data into actionable insights for investors of all experience levels. Explore historic discovery returns on Discovery Alert's dedicated discoveries page and begin your 14-day free trial today to position yourself ahead of the market.