August 22, 2026
When Markets Price in Uncertainty: Gold's Multi-Force Rally Explained
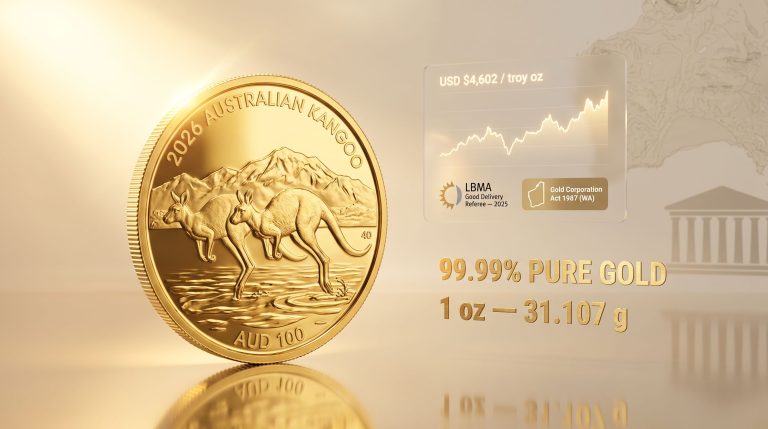
Few commodity markets reveal investor psychology as transparently as gold. When multiple independent demand forces converge simultaneously, price discovery becomes less about supply fundamentals and more about feedback loops, institutional positioning, and the mechanical behaviour of derivatives markets. That is precisely the situation unfolding in gold markets as of mid-to-late August 2026, with spot prices breaching the $4,600/oz level, registering a nearly 5% weekly gain, and clearing a significant technical threshold in the form of the 200-day moving average.
Understanding what is driving this move, and what could amplify or reverse it, requires examining three distinct layers: the macroeconomic policy environment, the structural demand backdrop shaped by central banks, and the often-overlooked mechanics of the gold options market.
When big ASX news breaks, our subscribers know first
Goldman Sachs Gold Forecast $4,900: The Revised Target in Context
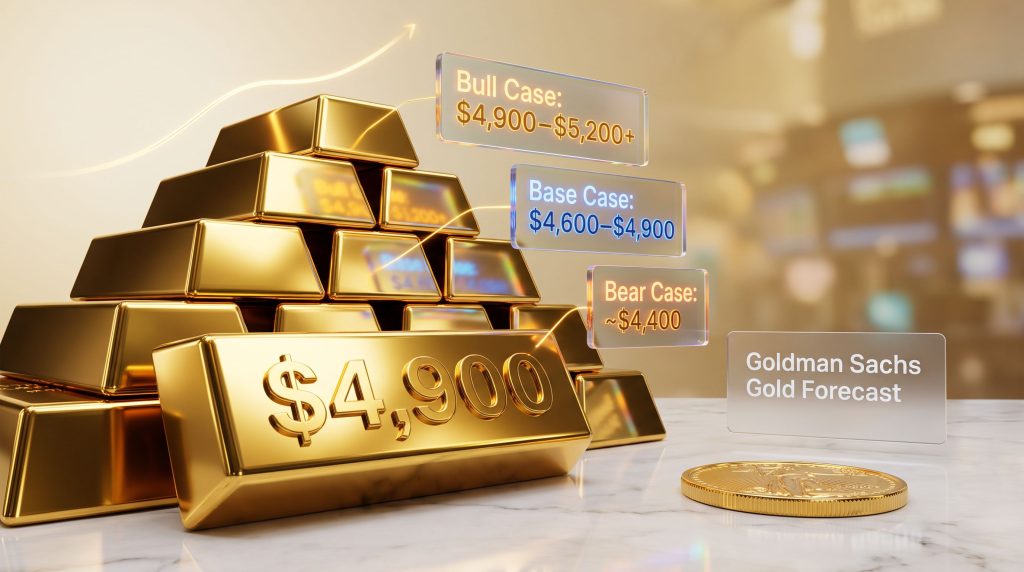
The Goldman Sachs gold forecast $4,900 has become a key reference point for institutional investors navigating mid-2026 markets. Goldman Sachs has maintained a structurally bullish view on gold throughout 2026, though its price target has evolved with shifting macroeconomic conditions. The bank currently holds a December 2026 year-end target of $4,900/oz, revised down from an earlier forecast of $5,400/oz that reflected more aggressive Federal Reserve rate-cut expectations at the start of the year.
The revision should not be read as a withdrawal of conviction. It represents a recalibration of timing rather than a fundamental change in thesis. The key drivers underpinning Goldman's bullish framework, namely persistent central bank accumulation and the potential re-engagement of Western investors, remain intact. For context, Goldman's earlier projections from 2025 already signalled this structural upward trajectory.
| Period | Goldman Sachs Gold Target | Primary Driver Cited |
|---|---|---|
| Early 2026 | $5,400/oz | Aggressive Fed rate-cut expectations |
| June 2026 | Revised to $4,900/oz | Fed rate-cut timeline pushed back; softer ETF flows |
| Mid-to-Late 2026 | $4,900/oz with upside flagged | Options demand surge; Western investor re-engagement |
Goldman's $4,900 target still implies meaningful price appreciation from mid-2026 levels. The forecast revision reflects a change in timing, not a withdrawal of the structural bull thesis.
Critically, Goldman has also highlighted that its base case could be exceeded. The bank specifically identified surging demand for gold call options as a mechanical price amplifier capable of pushing bullion materially beyond the $4,900 level under the right conditions. Furthermore, according to analysis from Kitco, sovereign demand remains a principal force behind this revised outlook.
How Gold Options Create Price Amplification Loops
The Mechanics Behind the Options Market Dynamic
Most market commentary focuses on fundamental supply and demand when explaining gold price moves. Far less attention is paid to the role of the derivatives market, specifically the gamma hedging behaviour of dealers who sell call options to institutional clients.
When large institutional investors purchase call options on gold as macro-policy hedges, the dealers on the other side of those trades carry exposure that must be managed. As the gold spot price rises toward the strike levels embedded in those options, dealers are forced to buy physical gold or futures contracts to offset their growing liability. This buying pressure accelerates the very price move that triggered it, creating a self-reinforcing loop.
The step-by-step mechanics work as follows:
-
Institutional buyers acquire gold call options at elevated strike prices, such as those clustered in the $4,600 to $4,900/oz range.
-
Dealers who sold those calls accumulate short exposure, which must be hedged by purchasing gold.
-
As spot gold approaches key strike levels, the rate of required dealer buying accelerates sharply, a phenomenon known in derivatives markets as gamma exposure.
-
If the price rally stalls and reverses, the hedging process runs in reverse, with dealers selling their positions and deepening any correction.
The Double-Edged Nature of Gamma-Driven Moves
Goldman's analysis explicitly acknowledged this symmetry. The same mechanical force that can amplify an upside breakout can equally intensify a sell-off. According to Goldman's research note published in August 2026, a renewed increase in Fed rate-hike expectations could trigger dealer hedge unwinds and produce a sharper-than-usual correction.
Risk Warning: Price moves driven by options dealer hedging are mechanical in nature and are not the same as sustained, fundamental demand-backed rallies. Investors should distinguish between the two when assessing entry and exit timing.
This dynamic is particularly relevant given that gold call option demand has risen sharply in 2026, reflecting renewed institutional appetite for macro-policy hedges amid geopolitical uncertainty and monetary policy ambiguity. In addition, record ETF inflows observed across global markets have reinforced this elevated options activity.
The Federal Reserve as Gold's Most Powerful Near-Term Variable
The Federal Reserve's July 2026 decision to hold interest rates steady, combined with subsequent data showing softer employment conditions and cooling inflation, materially shifted market expectations around the probability of a September rate hike. This shift provided a significant bullish catalyst for gold, further validating gold's role as a safe haven asset during periods of policy uncertainty.
Gold is a non-yielding asset, meaning its opportunity cost relative to interest-bearing instruments declines as rate expectations soften. Even a modest repricing of Fed expectations can translate into meaningful gold price movement, particularly when speculative positioning on the COMEX futures exchange is light and subject to rapid expansion.
Goldman noted that receding September rate-hike expectations revived speculative positioning on COMEX while simultaneously boosting exchange-traded fund demand. Both represent Western investor participation returning to the market, which Goldman identifies as a key variable in its upside scenario.
Central Bank Buying: The Structural Demand Floor
While options mechanics and Fed policy shape short-term price dynamics, the most enduring pillar of Goldman's bullish framework is the sustained accumulation of gold by global central banks. This structural demand has fundamentally changed the gold market's supply-demand equilibrium since 2022. Consequently, central banks influencing gold prices have become one of the defining narratives of the current bull cycle.
Several dynamics make central bank demand qualitatively different from speculative flows:
-
Central bank purchases are driven by reserve diversification mandates, not short-term price targets, making them relatively insensitive to price volatility.
-
The broader trend of de-dollarisation among emerging market central banks has created a structural, multi-year source of demand that operates independently of Western investor sentiment.
-
Reserve managers tend to accumulate on weakness, providing a natural price floor that speculative sellers must overcome to sustain any meaningful correction.
-
Monthly and quarterly data from the World Gold Council and the International Monetary Fund on central bank reserve changes remain among the most important data inputs for assessing whether this structural demand pillar remains intact.
Furthermore, central bank demand boosting gold throughout 2025 laid the groundwork for the price levels being tested today.
Scenario Analysis: Three Pathways for Gold Through December 2026
Rather than treating Goldman's $4,900 target as a binary outcome, a scenario-based framework is more analytically useful for understanding the range of potential price trajectories.
Scenario A: Bull Case — Gold Breaks Above $4,900
Conditions required:
-
Western ETF inflows accelerate beyond current trajectory, validating Goldman's upside risk variable.
-
Central bank buying maintains or exceeds the pace seen across 2025 and 2026.
-
The Federal Reserve signals that rate cuts are back on the agenda for late 2026 or early 2027.
-
Gold approaches key options strike levels, triggering mechanical dealer buying and a gamma squeeze.
Estimated price range: $4,900 to $5,200+/oz by December 2026
Scenario B: Base Case — Gold Consolidates Near $4,600 to $4,900
Conditions required:
-
The Fed holds rates steady without signalling either hikes or cuts.
-
ETF demand recovers gradually without a surge in inflows.
-
Central bank buying continues at a measured pace.
-
Options activity remains elevated but does not trigger a significant gamma event.
Estimated price range: $4,600 to $4,900/oz by December 2026
Scenario C: Bear Case — Gold Retreats Toward $4,400
Conditions required:
-
The Fed resumes hawkish signalling, reviving September or November rate-hike expectations.
-
Real yields rise, prompting ETF outflows and speculative position unwinds.
-
Dealer hedge unwinds accelerate a technically-driven correction.
Estimated price range: Approximately $4,400/oz or lower
| Scenario | Key Trigger | Implied Price Range | Probability Driver |
|---|---|---|---|
| Bull Case | ETF surge + Fed pivot | $4,900 to $5,200+ | Western investor re-entry |
| Base Case | Rate hold + steady CB demand | $4,600 to $4,900 | Central bank accumulation |
| Bear Case | Fed hawkish surprise | ~$4,400 or lower | Rate hike resumption |
The next major ASX story will hit our subscribers first
Technical Signals Reinforcing the Fundamental Thesis
Gold's breach of the 200-day moving average in the week ending 21 August 2026 carries significance beyond simple charting. This indicator is one of the most widely monitored trend signals by institutional systematic funds, including commodity trading advisors (CTAs). When a major asset class clears this level decisively, trend-following algorithms are programmed to add long exposure, creating a mechanical wave of buying that compounds the fundamental drivers already in place.
Three consecutive weeks of gains heading into late August, combined with the nearly 5% single-week price advance, suggests momentum conditions that historically attract a broader cohort of institutional participants beyond the initial macro-driven buyers. This technical confirmation layered on top of the options market dynamics creates a compounding effect that Goldman's analysis was careful to flag as both an opportunity and a risk. According to Yahoo Finance, Goldman's view is that gold is far from finished.
What Investors and Market Watchers Should Monitor
Given the multi-layered nature of the forces currently driving gold toward the Goldman Sachs gold forecast $4,900 level, a disciplined monitoring framework is essential. Key variables to track include:
-
Federal Reserve communications: Any shift in tone toward rate hikes or cuts will likely be the single most powerful near-term price catalyst.
-
Weekly ETF flow data: Western investor re-engagement through exchange-traded funds is Goldman's primary upside risk indicator.
-
COMEX net speculative positioning: This provides a real-time read on institutional conviction and remaining capacity for position expansion.
-
Options open interest near $4,600 to $4,900 strike levels: Elevated open interest in this range signals heightened gamma exposure and potential for mechanical price amplification.
-
World Gold Council and IMF reserve data: Monthly updates on central bank gold holdings provide the most reliable signal for assessing whether structural demand remains intact.
-
US inflation and employment data: These are the primary inputs shaping Fed expectations and, by extension, gold's opportunity-cost calculus.
This article contains forward-looking analysis, price forecasts, and scenario modelling drawn from publicly available institutional research. It does not constitute financial advice. All investment decisions should be made with reference to individual risk tolerance and independent professional guidance. Forecasts referenced are those of third-party institutions and are subject to revision as macroeconomic conditions evolve.
Want to Stay Ahead of the Next Major Mineral Discovery Driving Gold Market Momentum?
Discovery Alert's proprietary Discovery IQ model delivers real-time alerts on significant ASX mineral discoveries, instantly transforming complex mineral data into actionable insights for both short-term traders and long-term investors — explore historic discoveries and their extraordinary returns to understand the opportunity, then begin your 14-day free trial at Discovery Alert to position yourself ahead of the broader market.