July 27, 2026
The Institutional Weight Behind the World's Most Closely Watched Gold Call
Reserve currency systems do not unravel overnight. They erode across decades, quietly at first, then abruptly as confidence thresholds are crossed. The global monetary architecture that took shape after Bretton Woods, and was reinforced after 1971, has been showing structural stress fractures for years. However, it was a single geopolitical decision in 2022 that appears to have accelerated a fundamental reassessment of what reserve assets actually mean in a world where financial infrastructure itself can be weaponised.
Against that backdrop, the Goldman Sachs gold price forecast has emerged as arguably the most consequential price call in global commodity markets. Understanding why Goldman holds its position, what its models are actually measuring, and where the genuine disagreement lies across Wall Street provides a far richer picture than any single price target can convey.
When big ASX news breaks, our subscribers know first
Why Goldman's Commodity Research Carries Outsized Market Influence
Goldman Sachs occupies an unusual position in financial forecasting. Its commodity research desk operates at the intersection of macroeconomic modelling, geopolitical risk analysis, and deep client-flow intelligence. When Goldman revises a gold target, the effect on futures positioning is frequently observable within hours.
Several structural factors explain this influence:
- Goldman has historically demonstrated a willingness to publish contrarian price calls before consensus catches up, lending its forecasts predictive credibility over time
- Its proximity to central bank advisory relationships and sovereign wealth fund mandates provides access to directional intelligence unavailable to most market participants
- The bank's models explicitly separate base-case probability-weighted outcomes from tail-risk stress scenarios, giving investors a more complete analytical framework than a simple point estimate
This methodology matters enormously. The difference between Goldman's base case and its stress scenario modelling is not merely a range of outcomes; it is a structured probability distribution that allows sophisticated investors to size positions against specific macro triggers.
The 2022 Inflection Point That Rewired Central Bank Reserve Thinking
How Sanctions Became a Gold Catalyst
To understand the current gold cycle, one must first understand what changed in early 2022. Following Russia's invasion of Ukraine, Western governments executed what became the largest coordinated asset freeze in modern financial history. More than $300 billion in Russian sovereign foreign currency reserves held within Western financial institutions were rendered inaccessible, effectively overnight.
Simultaneously, major Russian financial institutions were excluded from the SWIFT messaging network, severing their capacity to conduct international transactions. The combined effect was unprecedented: a nation-state's financial reserves, accumulated over decades, were neutralised without military engagement.
The ripple effect through global sovereign wealth management circles was immediate. Reserve managers at central banks across Asia, the Middle East, Latin America, and Africa began running the same analytical exercise: if Russian reserves could be frozen, under what circumstances might their own holdings face comparable vulnerability?
The answer, widely reached independently across multiple sovereign institutions, pointed to a single asset class that carries no counterparty risk, cannot be frozen by a foreign jurisdiction, and requires no intermediary infrastructure to hold: physical gold.
The Resulting Demand Transformation in Numbers
The shift from tactical hedging to structural reallocation is visible in the data. Furthermore, central bank gold demand has transformed from a cyclical consideration into a defining structural force:
| Period | Average Annual Central Bank Gold Purchases |
|---|---|
| 2000 to 2009 | Under 100 tonnes per year |
| 2010 to 2020 | ~400 tonnes per year |
| 2022 | 1,136 tonnes (record high) |
| 2023 | 1,037 tonnes |
| 2024 | 1,086 tonnes |
| 2025 (projected) | 900 to 1,000 tonnes |
This is not a recovery from a trough or a cyclical buying opportunity. It is a regime change in sovereign reserve management philosophy.
A lesser-appreciated technical detail adds further significance: central bank gold transactions are executed through the London OTC market using 400-troy-ounce good delivery bars. These are not retail coins or small-denomination instruments. Once purchased, these bars move into sovereign vaults and are effectively removed from the tradeable market indefinitely. Central banks are currently absorbing roughly 25% of total annual global gold mine production through this mechanism, creating a structural supply constraint that operates independently of any speculative demand cycle.
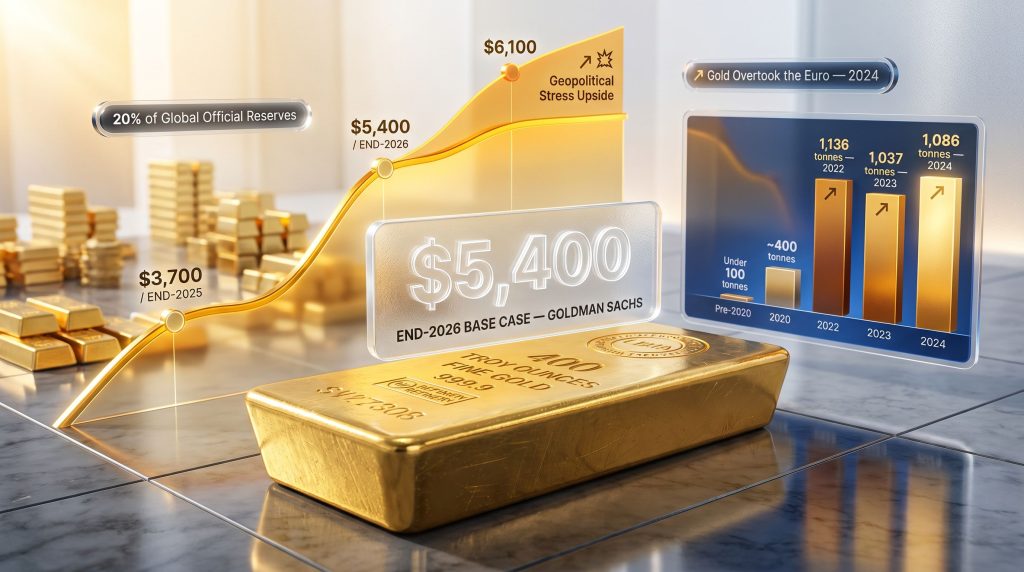
By 2024, gold had overtaken the euro to become the world's second-largest reserve asset class, representing 20% of global official reserves compared to the euro's 16% and the US dollar's 46%, according to European Central Bank data. This is a monetary realignment, not a portfolio rotation.
In addition, central bank gold reserves have continued climbing well beyond what most consensus forecasts anticipated at the start of this cycle.
Goldman Sachs Gold Price Forecast: Targets, Timelines, and Scenarios
Breaking Down the Numbers
The Goldman Sachs gold price forecast that has commanded the most attention across Wall Street projects gold reaching $5,400 per troy ounce by end-2026 as its base-case outcome. This is not an extreme tail-risk scenario; it is Goldman's central expectation under its primary macro framework. For instance, the Goldman Sachs $3,700 forecast for end-2025 alone represents a target that many competing institutions consider optimistic.
The full scenario matrix currently looks like this:
| Scenario | End-2025 Target | End-2026 Target |
|---|---|---|
| Base Case | $3,700/oz | $5,400/oz |
| Recession / Risk Spike | $3,900 to $4,500/oz | Up to $5,700/oz |
| Geopolitical Stress Upside | – | $5,700 to $6,100/oz |
Goldman's multi-factor thesis rests on three reinforcing demand pillars:
- Federal Reserve easing – Rate reduction cycles compress the real yield on competing assets, expanding the relative attractiveness of non-yielding gold
- Durable central bank accumulation – Sovereign de-dollarisation is treated as a structural, decade-long regime shift rather than a temporary response to geopolitical events
- Retail investor re-engagement – Futures and derivatives positioning in gold remains well below historical cycle peaks, suggesting substantial latent upside as retail and institutional participation catches up to underlying fundamentals
How Wall Street's Gold Forecasts Compare
The Spectrum of Institutional Views
The degree of genuine disagreement across major banks on gold's medium-term trajectory is striking and unusual for a commodity with such transparent fundamentals. J.P. Morgan's research, for instance, presents a comparatively measured outlook alongside Goldman's more aggressive projections.
| Institution | 2025 Target | 2026 Target | Upside Scenario |
|---|---|---|---|
| Goldman Sachs | $3,700/oz | $5,400/oz | $5,700 to $6,100/oz |
| J.P. Morgan | $3,675/oz (Q4 2025) | ~$5,000/oz (Q4 2026) | $5,400/oz by end-2027 |
| UBS | $3,500/oz | Not specified | $3,800/oz |
| Citibank | $3,100 to $3,500 range | Not specified | Not specified |
| Bank of America | Below $3,100/oz | Not specified | Not specified |
| Deutsche Bank | $2,450 to $3,050 range | Not specified | Not specified |
The spread between Goldman's $5,400 end-2026 target and Deutsche Bank's sub-$3,050 ceiling represents a divergence rarely observed at this scale among Tier 1 investment banks operating on the same publicly available data. The difference is not primarily about economic modelling mechanics; it reflects fundamentally different assumptions about the permanence of central bank behavioural change.
Goldman's analytical framework treats the de-dollarisation trend as a structural shift unlikely to reverse even if geopolitical conditions partially normalise. Deutsche Bank and Bank of America apply significantly heavier discounting to geopolitical risk premiums, effectively modelling a reversion toward pre-2022 reserve management patterns. Goldman also explicitly incorporates retail investor re-engagement as an emerging demand multiplier that consensus forecasts have not yet fully captured.
The Retail Reawakening: The Demand Layer That Changes the Equation
Why Individual Investors Are Now Entering the Gold Market
For the majority of the current bull cycle, gold's price appreciation was driven almost entirely by institutional and sovereign flows. Retail investors were largely absent. That dynamic shifted materially in early 2025, and the scale of the shift is significant.
Key Q1 2025 demand metrics:
- Total investment demand: 552 tonnes, a 170% year-over-year increase and the highest reading since early 2022
- Gold-backed ETF inflows: 227 tonnes in Q1, reaching 342 tonnes by April, the strongest quarterly surge in several years
- Physical bar and coin purchases: 325 tonnes, up 15% year-over-year, with Chinese retail investors accounting for one of the two highest quarters on record for physical buying
A particularly revealing signal came from mainstream retail distribution channels. Large-format warehouse retailers reported difficulty keeping physical bullion in stock, indicating that gold awareness has expanded well beyond traditional precious metals investor demographics into the general consumer population.
The FOMO Dynamic and Its Self-Reinforcing Properties
The psychological mechanics of retail precious metals markets are distinct from equities. Rising gold prices generate media coverage, which attracts new buyers unfamiliar with gold's historical role, which consequently supports further price appreciation. This feedback loop is identifiable in prior bull markets and appears to be in early-stage formation currently.
The combination of ETF inflows and physical bar and coin demand creates a dual-channel demand surge that operates across different investor segments simultaneously. In prior gold cycles, this convergence has historically preceded the most sustained and aggressive phase of price appreciation.
The next major ASX story will hit our subscribers first
Geopolitical Risk as a Structural Gold Premium
Why Multiple Active Conflicts Support Sustained Safe-Haven Demand
Active military conflicts in multiple theatres create a qualitatively different demand environment for gold than single-crisis episodes. The safe-haven premium embedded in gold pricing during multi-front geopolitical instability tends to be stickier because resolution in one theatre does not eliminate uncertainty in others.
One specific risk factor deserves attention from a market mechanics perspective. Approximately 20 million barrels of oil per day transit through the Strait of Hormuz, representing close to one-fifth of all global seaborne oil shipments. Any credible threat to that corridor triggers simultaneous energy price spikes and flight-to-safety capital flows into gold, creating a compounding pressure on prices that operates independently of monetary policy variables.
Beyond immediate safe-haven flows, ongoing geopolitical instability validates the reserve diversification thesis for central banks that may otherwise face internal pressure to slow gold accumulation. Active conflicts effectively reinforce the risk-management case for continued sovereign gold buying.
What Could Make Goldman's Forecast Wrong
The downside risk framework is equally important to understand:
- A rapid, durable resolution of major global conflicts that removes the safe-haven premium currently embedded in gold prices
- A global recession severe enough to force institutional investors to liquidate gold holdings to cover equity and credit losses
- A meaningful reversal in Federal Reserve policy toward rate increases, raising the opportunity cost of zero-yield gold ownership
- A sharp and sustained appreciation in the US dollar, which historically correlates inversely with gold price performance
- An unexpected reversal in central bank gold accumulation behaviour, potentially triggered by a geopolitical normalisation framework
The Mining Equity Disconnect: Where the Leverage Lives
Understanding the Valuation Gap Between Gold and the Companies That Mine It
Perhaps the least widely appreciated dimension of the current gold cycle is the structural valuation disconnect between the metal itself and the publicly listed companies that extract it. The existence of undervalued mining stocks across the sector represents one of the more compelling asymmetric opportunities currently available to investors.
Consider the comparative scale:
- Total global gold market capitalisation: estimated at $21 to $23 trillion
- Total market capitalisation of all listed gold mining companies globally: approximately $500 billion
This produces a ratio of roughly 40:1 between the underlying asset and the combined equity value of the entities that produce it. In any other commodity sector, such a disparity would attract significant capital reallocation attention.
The relationship between bullion price and mining equity performance is non-linear. A 30% rise in gold does not produce a 30% gain in miner valuations. Due to operating leverage on fixed cost structures, it can produce gains of 100% to 300% or more in well-positioned producers and explorers.
Several structural factors amplify this dynamic in the current cycle:
- Junior gold mining equities remain deeply depressed relative to historical norms, with the sector estimated to sit approximately 70% below its 2012 capitalisation peak on a market-cap-adjusted basis
- Mid-tier and senior producers are generating substantial free cash flow at current spot prices, creating a fundamental investment case entirely independent of further gold price appreciation
- Total global gold ETF holdings represent a far larger asset base than total mining equity market cap, meaning even marginal capital rotation from bullion vehicles into mining equities could produce outsized price movements in the latter
Furthermore, understanding how gold and mining equities interact during sustained bull markets is essential for investors seeking to maximise their exposure to this cycle.
The pattern observed in prior gold bull markets is consistent: mining equities lag the metal during the early accumulation phase, then deliver multiples of the metal's percentage gain once institutional capital rotates into the sector. The current cycle appears to be at an early stage of that rotation.
Key Macroeconomic Variables That Will Shape Gold's Path
Federal Reserve Rate Decisions
Goldman's $5,400 base-case forecast is partially contingent on the Federal Reserve executing a meaningful easing cycle through 2025 and 2026. Each 25-basis-point rate reduction compresses the real yield on competing Treasury instruments, improving gold's relative value profile. The pace and depth of Fed easing will likely function as the primary domestic variable determining how quickly the Goldman Sachs gold price forecast timeline plays out.
Dollar Credibility and Fiscal Trajectory
A sustained weakening of the US dollar, whether driven by fiscal expansion, structural deficit dynamics, or deliberate policy accommodation, amplifies gold's purchasing-power-preservation appeal across both domestic and international investor cohorts.
The longer-term question of dollar reserve currency credibility is increasingly discussed in academic, central bank, and institutional investment circles. This narrative does not need to reach mainstream consensus to be directionally relevant for gold; it only needs to persist as a consideration in sovereign reserve management decision-making.
Inflation and Real Yield Compression
If inflation proves more persistent than central bank projections indicate, real yields will remain compressed or negative, historically among the most powerful macro environments for gold price appreciation. Goldman's modelling appears to incorporate a scenario where inflation stays elevated enough to keep real yields structurally low through the forecast period, reinforcing the structural case for the metal. Goldman's official outlook elaborates further on these inflationary assumptions underpinning the bank's longer-range projections.
Frequently Asked Questions: Goldman Sachs Gold Price Forecast
What is Goldman Sachs' gold price forecast for 2025?
Goldman Sachs projects gold at approximately $3,700 per troy ounce by end-2025 as its base case. Under stressed conditions such as a global recession or acute geopolitical escalation, the bank's models point to a range of $3,900 to $4,500 per ounce.
What is Goldman Sachs' gold price forecast for 2026?
Goldman's base-case target for end-2026 is $5,400 per troy ounce. Under an intensified geopolitical stress scenario involving accelerated de-dollarisation, the upside range extends to $5,700 to $6,100 per ounce.
Why is Goldman more bullish than Deutsche Bank or Bank of America?
Goldman places greater analytical weight on the structural and multi-decade permanence of central bank de-dollarisation, treating the 2022 asset freeze as a lasting inflection point rather than a temporary shock. It also incorporates retail investor re-engagement as an emerging demand variable not yet priced into consensus forecasts.
How does central bank buying affect the gold price outlook?
Central banks are purchasing an estimated 900 to 1,000 tonnes per year, representing approximately 25% of total annual global mine production. This sustained absorption of physical supply creates a structural price floor largely independent of retail or speculative demand cycles.
What are the biggest risks to the $5,400 target?
The primary downside risks include forced institutional liquidations during a global recession, a sharp reversal in Federal Reserve easing expectations, significant US dollar appreciation, and a rapid resolution of major geopolitical conflicts that removes the safe-haven premium currently embedded in gold prices.
Is this article financial advice?
This article is published for informational and educational purposes only and does not constitute financial advice. All price forecasts referenced are third-party institutional projections subject to revision. Readers should conduct independent due diligence and consult a licensed financial adviser before making any investment decisions.
Readers seeking further analysis on gold, silver, and mining equity markets from an investor-focused editorial perspective may find additional value in the commentary and research published by The Gold Advisor at thegoldadvisor.com.
Want To Position Yourself Ahead of the Next Major ASX Mineral Discovery?
Discovery Alert's proprietary Discovery IQ model delivers real-time alerts on significant ASX mineral discoveries, instantly transforming complex geological data into actionable investment insights — explore historic discoveries and their exceptional market returns, then begin your 14-day free trial at Discovery Alert to secure your market-leading advantage before the broader market catches up.