June 13, 2026

The Invisible Architecture Behind Wall Street's Most Watched Gold Forecast
Most price forecasts in financial markets are built on publicly visible data. Earnings reports, central bank meeting minutes, trade flow statistics published by government agencies. The figures are imperfect, but they are at least observable. The J.P. Morgan $6,000 gold forecast and central bank buying is the primary thesis underpinning one of the most scrutinised institutional calls in global commodity markets today. Understanding why that gap exists, what it represents, and how independent analysts reconstruct it is the difference between seeing the forecast as speculative and understanding it as a flow model grounded in structural reality.
When big ASX news breaks, our subscribers know first
Why the Data Behind the $6,000 Gold Forecast Is Largely Invisible to Most Investors
Central banks face no binding international obligation to report gold purchases to the International Monetary Fund. Disclosure is entirely voluntary. This is not a loophole or an oversight in the reporting framework. It is a permanent, deliberate feature of how sovereign reserve management data flows through international institutions. The consequence is a recurring, structural gap between what official figures capture and what independent methodologies consistently reveal.
The magnitude of that gap in the first quarter of 2026 is extraordinary. IMF-reported net central bank gold purchases for the period came in at 16 tonnes. The World Gold Council, using London over-the-counter settlement flows and Swiss refinery export statistics as alternative data sources, estimated actual central bank gold demand for the same quarter at 244 tonnes. That is approximately 15 times the official figure. This is not statistical noise. It is the single most consequential discrepancy in global commodity markets right now, and it is the empirical foundation on which the J.P. Morgan $6,000 gold forecast rests.
When institutional price models incorporate 244 tonnes of quarterly central bank demand rather than 16 tonnes, the difference between a market in mild surplus and one facing sustained structural tightness becomes unambiguous. The forecast is inseparable from the data methodology used to generate it.
How the World Gold Council Reconstructs What IMF Data Misses
The World Gold Council does not rely on voluntary sovereign disclosures. Its demand estimation framework triangulates from three independent data streams:
- London OTC market settlement data: The London bullion market processes the majority of global wholesale gold transactions. Settlement volumes provide a flow signal entirely independent of what any central bank chooses to disclose.
- Swiss refinery trade statistics: Switzerland refines a disproportionate share of global gold supply. Export destination data from Swiss customs authorities reveals institutional flows that never appear in official reserve reporting.
- Residual demand calculation: By subtracting identifiable supply, fabrication demand, and known consumption from total flow volumes, the methodology isolates a residual that is attributable to unreported institutional and sovereign accumulation.
This is why the World Gold Council's figures consistently exceed official IMF data. The discrepancy is not an error. It is what the methodology is designed to capture.
Where Wall Street Stands: A Comparative View of 2026 Gold Price Forecasts
The J.P. Morgan $6,000 gold forecast commands the most attention, but it exists within a broader institutional consensus that is directionally unified. Understanding each institution's framing matters more than the headline numbers in isolation.
| Institution | 2026 Year-End Target | 2027 Outlook | Primary Driver |
|---|---|---|---|
| J.P. Morgan Global Research | ~$6,000/oz | ~$6,300/oz | Central bank demand, reserve diversification |
| J.P. Morgan (Full-Year Average) | $5,243/oz | – | Revised from $5,708 on softer H1 |
| Goldman Sachs | $5,400/oz | Bullish continuation | Macro uncertainty, ETF re-engagement |
| Wells Fargo | – | Up to $8,000/oz | Long-duration structural demand |
| Reuters Analyst Survey (31 analysts, April 2026) | Median: $4,916/oz | – | Broad consensus |
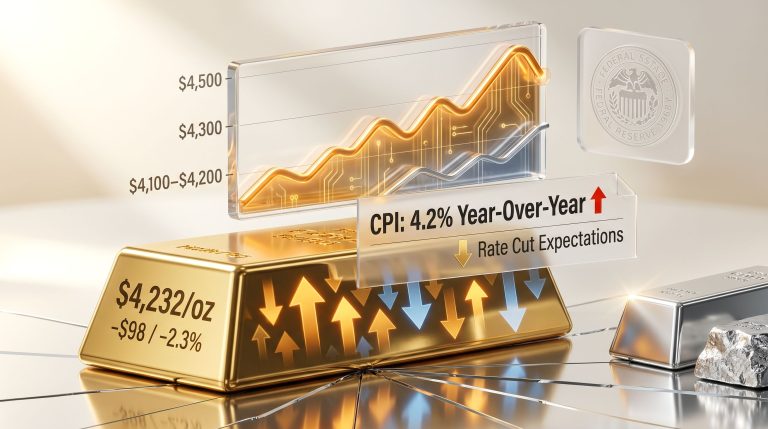
| Spot Price (June 12, 2026) | $4,216/oz | – | – |
J.P. Morgan's downward revision of its full-year 2026 average from $5,708/oz to $5,243/oz reflects an honest accounting of first-half underperformance rather than reduced conviction in the directional call. The year-end target of approximately $6,000/oz implies a substantial acceleration in the second half of 2026. Critically, the bank simultaneously revised its ETF inflow forecast from an expected 580 tonnes to 400 tonnes, acknowledging reduced Western investor participation.
Furthermore, according to Reuters, J.P. Morgan sees gold reaching $6,300 an ounce by year-end on robust central bank and investor demand. This revision carries an important analytical implication: the bull case does not depend on retail investors or ETF buyers returning to the market in force. It depends on sovereign institutional accumulation continuing at a pace that has already been running largely outside public view.
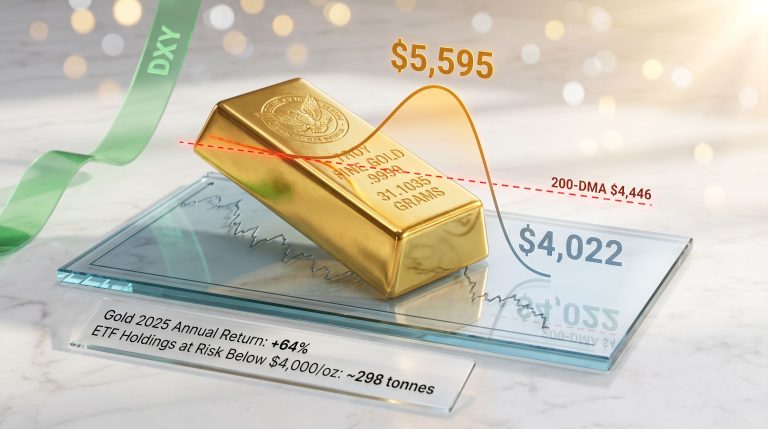
According to Gregory Shearer, Head of Base and Precious Metals Strategy at J.P. Morgan, gold is currently navigating a technically difficult zone, trading above the 200-day moving average near $4,340/oz while remaining capped below the 50-day moving average around $4,730/oz. This range reflects reduced near-term investor engagement rather than any change in the underlying structural demand thesis. (J.P. Morgan Global Research, 2026)
The Sovereign Accumulation Thesis: Why Central Banks Have Fundamentally Changed Their Behaviour
A Demand Regime Shift That Predates 2026
Central bank gold trends have been building as a structural force since at least 2021. Between 2021 and 2025, central banks purchased an average of approximately 225 tonnes per quarter, roughly double the pace recorded in the preceding five-year period. Annual totals tell a similar story:
- 2024: 1,092 tonnes (record pace)
- 2025: 863 tonnes (moderation from peak, but still well above long-run average)
- Q1 2026: Estimated 244 tonnes by World Gold Council, against 16 tonnes officially reported
This is not tactical trading. Sovereign institutions do not adjust gold allocations in response to Fed minutes or monthly CPI prints. The accumulation reflects a strategic reassessment of reserve asset risk that was crystallised by a specific geopolitical event.
The 2022 Russian Asset Freeze: A Permanent Change in Reserve Risk Calculus
When the United States and allied governments froze approximately $300 billion in Russian central bank foreign exchange reserves following the 2022 invasion of Ukraine, the event carried a meaning that extended far beyond Russia. For governments holding large USD-denominated reserve positions, it was a concrete demonstration that assets previously treated as unconditionally safe carry embedded political risk.
Physical gold held in domestic custody has a property that no dollar-denominated sovereign bond possesses: it cannot be frozen, sanctioned, or devalued by a foreign government's policy decision. This was theoretically understood before 2022. It became operationally relevant after it. The consequence has been a sustained multi-year reallocation among a broad cohort of sovereign institutions, and there is no structural reason to expect it to reverse. In fact, central banks influencing gold prices have become one of the most closely watched dynamics in global markets as a result.
Which Buyers Are Driving Demand in 2026?
- People's Bank of China: Accelerated disclosed purchases from approximately 1 tonne per month through February 2026 to 5 tonnes in March and 8 tonnes in April 2026
- China (total flows): Net Chinese gold imports reached 317 tonnes in Q1 2026, nearly triple the prior quarter's pace, far exceeding what PBOC disclosures and known domestic consumption can account for
- Poland: Among the largest disclosed buyers in Q1 2026 per World Gold Council data
- Uzbekistan: Also among the largest disclosed buyers in the same period
- Turkey: A net seller of 60 tonnes in March 2026, the primary reason the official net purchase figure was suppressed to 16 tonnes
Data interpretation warning: Turkey's March 2026 sale of 60 tonnes dramatically compressed the headline net purchase figure for the quarter. Gross buying by other central banks during the same period was substantially higher. Evaluating Q1 2026 sovereign demand on net figures alone fundamentally misrepresents the demand picture.
China's Multi-Channel Gold Accumulation: A Story That Goes Far Beyond the PBOC
Why Chinese Net Import Data Tells a Different Story Than Official PBOC Disclosures
Most analysis of Chinese gold demand fixates on PBOC monthly disclosures. This framing captures only one dimension of what appears to be a deliberate, multi-channel accumulation strategy. Chinese net gold imports, derived from customs data and Hong Kong re-export statistics, provide a more complete picture.
At 317 tonnes in Q1 2026, Chinese net imports were running at nearly three times the prior quarter's pace. The volume significantly exceeds the combined total of PBOC disclosed purchases and known domestic jewellery and industrial consumption. The residual points toward substantial unreported institutional or sovereign accumulation that does not surface in any official dataset.
China's Insurance Sector: An Under-Tracked Demand Source That Could Reshape the Market
In February 2025, China's National Financial Regulatory Administration authorised ten major insurance companies, including China Life, PICC Property and Casualty, and Ping An Life Insurance, to allocate up to 1% of their assets under management to physical gold. Initial purchases were executed on the Shanghai Gold Exchange in March 2025. (National Financial Regulatory Administration of China, February 7, 2025)
The demand implications are significant and largely unpriced by the market:
| Metric | Estimate |
|---|---|
| Allocation ceiling per institution | 1% of AUM |
| Estimated aggregate demand at 1% allocation | ~200 tonnes |
| Bank of America annual demand estimate from the policy | ~300 tonnes/year |
| As a share of global annual gold supply | ~6.5% |
Industry analysts treat the 1% ceiling as a starting point rather than a permanent limit. These institutions are not currently required to disclose their gold holdings publicly. When mandatory reporting begins, the market may find that accumulation has proceeded considerably further than any current data point suggests. This constitutes a significant latent demand variable that most Western-focused price models do not adequately incorporate.
What Gold's Price Consolidation Is Actually Signalling
Gold's trading range of approximately $4,170 to $4,730 has been characterised by some commentators as indecision or fading momentum. However, a more rigorous interpretation is that the range represents active structural absorption by buyers with long-duration conviction who are using sideways price action to accumulate, not to exit.
Consider what the market has absorbed and held against in this range:
- Turkey's 60-tonne central bank sale in March 2026
- A downward revision in Western ETF inflow expectations from 580 to 400 tonnes for the full year
- Elevated uncertainty around the Federal Reserve's policy trajectory
- Geopolitical risk repricing related to Iran-Israel-US conflict developments
- A correction of approximately 12% from January's all-time high of approximately $4,752/oz
In prior market cycles, this combination of emerging-market central bank selling, decelerating ETF participation, and geopolitical uncertainty would typically have produced a 15 to 20% drawdown from peak levels. The observed correction is shallower than historical precedent would imply. The structure underneath has changed because the composition of the buyer base has changed. Furthermore, gold safe-haven demand continues to underpin prices even during periods of apparent technical weakness. Central banks and sovereign institutions are not managing positions against a quarterly performance benchmark. Their holding periods are measured in years and decades.
The next major ASX story will hit our subscribers first
The Primary Risk Scenario: When the Fed Becomes Gold's Most Significant Headwind
Gold generates no income. Its relative attractiveness is therefore inversely sensitive to the real return available on yield-bearing alternatives, particularly US Treasury Inflation-Protected Securities. The primary downside risk to the J.P. Morgan $6,000 gold forecast and central bank buying thesis is not a demand-side problem. It is a competing-asset problem.
The specific scenario that institutional analysts identify as most threatening to the price outlook involves the following sequence:
- US employment remains resilient and labour market conditions stay tight
- Inflation continues to accelerate, driven primarily by energy prices
- The Federal Reserve responds by initiating or accelerating a rate-hiking cycle
- Real yields rise, increasing the opportunity cost of holding non-yielding assets
- Western gold ETF outflows accelerate, removing a demand component that J.P. Morgan had already revised downward
As J.P. Morgan's Gregory Shearer noted, a Federal Reserve that feels emboldened by strong employment data and feels compelled to respond aggressively to persistently elevated inflation could begin to erode investor demand for gold in a meaningful way. (J.P. Morgan Global Research, 2026)
Critically, this scenario would not reverse the structural central bank buying thesis. Sovereign institutions are not managing gold allocations on a rate-cycle basis. But it would compress the Western investor demand component and create a persistent headwind against the background of structural support.
Scenario Analysis: Bull, Base, and Bear Cases for H2 2026
| Scenario | Key Conditions | Implied Price Direction | Notes |
|---|---|---|---|
| Base Case (J.P. Morgan) | Central bank buying continues; ETF inflows reach 400t; Fed on hold | Toward $6,000 by Q4 2026 | Primary institutional scenario |
| Bull Case | Insurance sector demand accelerates; Fed cuts; dollar weakens | $6,300 to $7,200+ | Requires multiple simultaneous tailwinds |
| Bear Case | Fed hiking cycle materialises; ETF outflows; dollar strengthens | Correction or prolonged consolidation | Contingent on energy inflation persistence |
| Structural Floor Case | Central banks absorb selling; Western demand neutral | Range-bound $4,200 to $4,800 | Likely interim phase before next leg |
What Investors Should Monitor Through the Rest of 2026
A Tiered Monitoring Framework
Not all data points carry equal weight. Prioritising information by its market impact and update frequency is more useful than following every release indiscriminately.
Tier 1: High Frequency, High Impact
- Federal Open Market Committee meeting statements and dot plot revisions (next meeting: June 16-17, 2026)
- Monthly PBOC gold reserve disclosures
- US CPI and PPI releases, with particular focus on the energy component
- Real yield movements on 10-year US TIPS
Tier 2: Structural, Lower Frequency
- World Gold Council quarterly demand trends reports
- Swiss customs gold export data (monthly, approximately six-week lag)
- Chinese net gold import figures from monthly customs releases
- First public disclosures from Chinese insurance companies on gold holdings
Tier 3: Sentiment and Positioning
- CFTC Commitments of Traders report: managed money net long positioning in gold futures
- Global gold ETF flow data via the World Gold Council monthly tracker
- LBMA gold lease rates as a signal of physical tightness in the wholesale market
Speculative perspective worth monitoring: LBMA gold lease rates have historically served as an early-warning signal for physical supply tightness. Elevated lease rates in a period of sideways spot prices have sometimes preceded significant upside moves as deferred demand concentration becomes apparent to market makers. This is not a widely publicised indicator, but experienced institutional traders track it closely.
Frequently Asked Questions
What is J.P. Morgan's gold price forecast for 2026 and 2027?
J.P. Morgan Global Research projects gold approaching $6,000 per ounce by Q4 2026 and approximately $6,300 per ounce by year-end 2027. The bank's revised full-year 2026 average price forecast is $5,243/oz, lowered from a prior estimate of $5,708/oz to reflect softer first-half performance and reduced ETF inflow assumptions. Gold was trading at $4,216/oz as of June 12, 2026, implying approximately 42% upside to the year-end target. For a detailed breakdown of this outlook, J.P. Morgan's full analysis outlines the scenario for gold to break $6,000 per troy ounce. (J.P. Morgan Global Research, 2026)
How much gold are central banks actually buying in 2026?
Official IMF-reported net central bank purchases in Q1 2026 totalled 16 tonnes. The World Gold Council, using OTC market and Swiss refinery flow data, estimates actual total central bank demand in the same quarter reached 244 tonnes, approximately 15 times the official figure. The discrepancy reflects the entirely voluntary nature of IMF gold reporting. Moreover, central bank gold reserves data suggests this structural accumulation trend shows no signs of abating in the near term. (World Gold Council, Gold Demand Trends Q1 2026)
Why is China accumulating gold at an accelerating pace?
China's gold accumulation strategy functions primarily as a hedge against the risk that dollar-denominated reserve assets can be subjected to foreign policy restriction. The US freezing of Russian central bank reserves in 2022 demonstrated this risk concretely. Physical gold held in domestic custody cannot be frozen or restricted by external actors. The PBOC accelerated disclosed purchases from approximately one tonne per month through February 2026 to eight tonnes in April 2026, while Chinese net gold imports reached 317 tonnes in Q1 2026, nearly triple the prior quarter.
Why does official central bank gold data systematically understate actual buying?
There is no mandatory requirement for central banks to report gold purchases to the IMF. Reporting is voluntary by design, and sovereign buyers pursuing strategic reserve diversification have strong incentives to avoid disclosure that could move markets or signal geopolitical intent. The World Gold Council estimates total demand using London OTC settlement flows and Swiss refinery export data, both of which consistently reveal higher volumes than official figures. This methodology is specifically engineered to bridge the gap that voluntary disclosure creates. Consequently, the J.P. Morgan $6,000 gold forecast and central bank buying narrative relies heavily on this alternative data infrastructure to validate its structural thesis.
This article is intended for informational and educational purposes only. It does not constitute financial or investment advice. All forecasts and price targets referenced are those of third-party institutions and represent forward-looking projections subject to material uncertainty. Past performance is not indicative of future results. Readers should consult a qualified financial adviser before making any investment decisions.
Want to Capitalise on the Next Major Gold or Mineral Discovery Before the Broader Market?
Discovery Alert's proprietary Discovery IQ model delivers real-time alerts on significant ASX mineral discoveries, instantly transforming complex data into actionable investment insights — explore historic discoveries and their exceptional returns to understand what structural demand shifts can mean for early investors, then begin your 14-day free trial at Discovery Alert to position yourself ahead of the market.