July 23, 2026
When Monetary Policy Overrides Macro Fear: Understanding Gold's 2026 Repricing
Precious metals markets operate on a deceptively simple tension: the pull between fear-driven demand and the mathematics of opportunity cost. When inflation erodes purchasing power and geopolitical instability threatens financial systems, gold attracts capital as a monetary refuge. However, when central banks pivot toward higher interest rates, the calculus shifts dramatically. Suddenly, holding a non-yielding physical asset becomes measurably expensive relative to bonds, cash, and other yield-generating instruments. This is precisely the dynamic reshaping gold markets in mid-2026, and it forms the core of why the Goldman Sachs gold price forecast cut to $4,900 carries more analytical weight than a simple headline number suggests.
Understanding this revision requires looking beyond the price target itself and into the conditional architecture of what Goldman's analysts are actually saying about monetary regimes, central bank behaviour, and the structural versus tactical distinction that professional gold investors increasingly rely on to navigate volatile periods.
When big ASX news breaks, our subscribers know first
The Architecture of the Revision: From $5,400 to $4,900
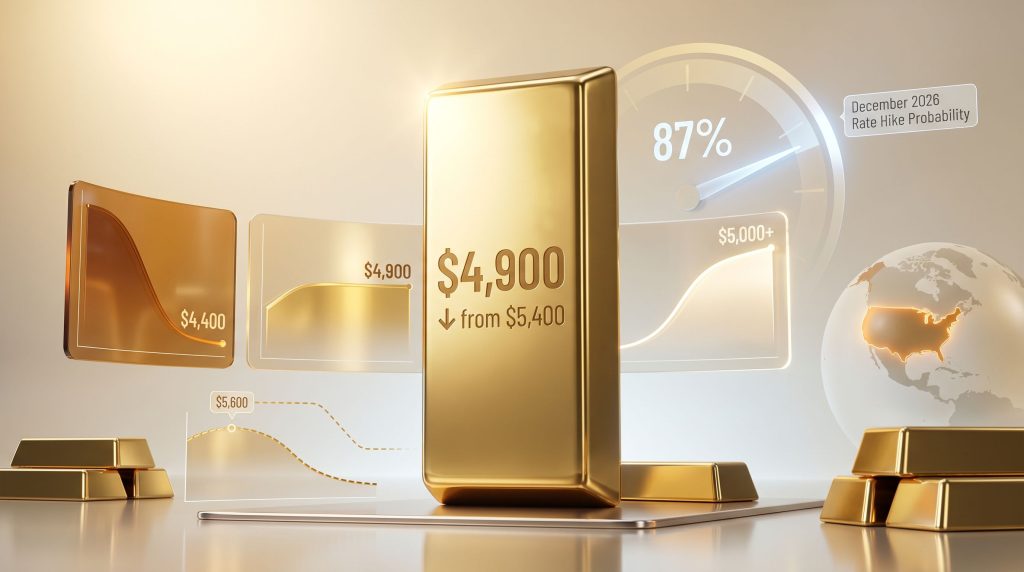
Goldman Sachs entered 2026 with considerable conviction on gold. The bank had set a year-end price target of $5,400 per ounce, anchored by two powerful demand drivers: surging private-sector appetite for bullion and a macroeconomic backdrop that appeared to favour monetary easing. At the time that target was published, gold was trading near $5,000/oz and was days away from establishing a historic record high of approximately $5,600/oz in January 2026.
That confidence held even as conditions deteriorated. When geopolitical tensions in the Middle East intensified during late March and gold began sliding sharply, Goldman's analysts maintained the $5,400 target, viewing the selloff as cyclical noise rather than structural deterioration. Furthermore, the Goldman Sachs gold outlook had previously signalled strong upside conviction, making this revision all the more notable.
What ultimately forced the revision was not market volatility but a fundamental repricing of Federal Reserve expectations.
| Forecast Checkpoint | Goldman Target | Key Driver |
|---|---|---|
| Early 2026 | $5,400/oz | Strong private-sector demand, gold near $5,000/oz |
| Late March 2026 | $5,400/oz maintained | Geopolitical volatility treated as temporary |
| June 19, 2026 | Cut to $4,900/oz | Fed hawkish shift, rate hike probability surge |
| Conditional downside | $4,400/oz | Confirmed Fed rate hike before year-end |
The revision was announced on June 19, 2026, two days after the Federal Reserve held its first policy meeting under newly appointed Chair Kevin Warsh. In his inaugural press conference, Warsh delivered a distinctly hawkish message, emphasising the central bank's commitment to restoring price stability. Markets interpreted this as a clear signal that rate hikes were no longer a tail risk but an active policy pathway.
The Rate Hike Probability Shock: What the CME FedWatch Data Reveals
Perhaps the most striking data point embedded in Goldman's revised outlook is the shift in rate hike probabilities tracked by the CME FedWatch Tool. Before the Fed's June 2026 meeting, markets were pricing a 61% probability of a US rate hike by December 2026. Following Warsh's press conference, that figure surged to 87% virtually overnight.
A 26-percentage-point swing in rate expectations within 48 hours is not a routine repricing. It represents a fundamental reassessment of the monetary policy trajectory, and its implications for gold are direct and measurable.
Gold is a non-yielding asset. It generates no coupon, no dividend, and no interest. Its investment case rests on the expectation that holding it preserves value better than alternatives, particularly in environments where real returns on bonds and cash are low or negative. When rate hike probabilities surge, real yields rise, and the opportunity cost of holding gold increases accordingly.
Capital that might otherwise have flowed into gold-backed exchange-traded funds begins redirecting toward instruments that now offer more attractive returns. Consequently, understanding gold and bond dynamics becomes essential for any investor attempting to navigate this shifting landscape.
This mechanism — the inverse relationship between real yields and gold prices — is one of the most consistently observed dynamics in precious metals markets. When the US 10-year Treasury Inflation-Protected Securities (TIPS) yield rises, gold typically faces headwinds. When it falls, gold tends to benefit. The mid-June 2026 repricing was essentially a TIPS-yield shock delivered through the vehicle of rate hike probability reassessment.
Kevin Warsh, Fed Independence, and the Collapse of a Key Gold Premium
One of the less-discussed but analytically important elements of Goldman's revised framework involves the concept of a macro policy hedge premium embedded in gold prices during the first half of 2026.
In the months leading up to Warsh's appointment, gold markets had absorbed a meaningful speculative premium rooted in concerns about Federal Reserve independence. The Trump administration's well-documented frustration with former Chair Jerome Powell's resistance to rate cuts had generated genuine uncertainty about whether the Fed would remain free from political pressure. For gold investors, political interference in monetary policy is a highly bullish signal because it raises the probability of inflation-tolerant policy, currency debasement, and general institutional unpredictability.
Warsh's decisively hawkish opening statement effectively eliminated that narrative. Rather than capitulating to political pressure for lower rates, the new Chair signalled the opposite direction. Goldman's analysts noted that concerns over Fed independence may now be considerably diminished given this stance, removing a layer of speculative premium that had been quietly supporting gold prices above what underlying demand fundamentals alone would justify.
This is an example of what professional traders sometimes describe as a narrative unwind rather than a fundamental unwind. The physical demand for gold had not collapsed. Central banks were still buying. ETF positions had not been aggressively liquidated. However, a story that investors had been pricing into gold — the story of a politically compromised Fed tolerating inflation — had been invalidated in a single press conference.
Three Scenario Pathways for Gold Prices Through Year-End 2026
Goldman's revised outlook implicitly contains a scenario framework rather than a single deterministic forecast. Parsing the bank's language reveals three distinct price pathways with different conditional requirements.
Scenario 1: Base Case Recovery to $4,900
This is Goldman's central projection and requires the following conditions to hold:
- The Federal Reserve delays any rate hike into 2027, with the first cut now expected in June 2027 and a second in December 2027
- Central bank gold purchases continue at approximately 50 tonnes per month through 2026
- ETF inflows into gold-backed products stabilise rather than reversing into net outflows
- Geopolitical risk factors provide at least partial support for gold safe-haven demand
Goldman analysts Lina Thomas and Daan Struyven described the bank's gold price view as structurally constructive but tactically cautious, with near-term downside risk balanced by medium-term upside potential. This framing is significant because it separates the near-term tactical picture from the longer-term strategic thesis, which the analysts explicitly indicated remains intact.
Scenario 2: Downside Case of $4,400
If the Federal Reserve proceeds with an actual rate hike before year-end, Goldman's analysts indicated their forecast could fall by a further $500/oz to $4,400/oz. The mechanism is relatively straightforward: a confirmed hike would accelerate real yield increases, pressure ETF outflows, and most importantly, signal that demand for gold as a hedge against macro policy uncertainty could unwind in a more persistent and disorderly fashion.
This scenario is not merely theoretical. Rob Kaplan, Vice Chairman at Goldman Sachs and a former president of the Dallas Federal Reserve, stated in a Bloomberg interview that a September rate hike remains a live possibility if inflation data continues to run hot. Kaplan's institutional credibility on monetary policy questions, given his years on the Federal Open Market Committee, lends weight to the downside scenario in a way that a generic analyst warning might not.
Scenario 3: Upside Recovery Above $5,000
This scenario requires a combination of factors working simultaneously in gold's favour:
- Inflation data softens materially, removing the case for further tightening
- Central bank demand accelerates beyond the current 50-tonne monthly pace
- A new geopolitical catalyst drives safe-haven flows back into gold
- ETF inflows re-accelerate as retail and institutional investors return to bullion exposure
Goldman characterises medium-term upside risk as intact, meaning this outcome is deferred rather than discarded. For long-term gold investors, this distinction matters considerably.
Central Bank Buying: The Structural Floor That Changes Everything
One of the most important features differentiating the current gold market from prior correction cycles is the scale and consistency of official sector gold purchases. Goldman's analysts incorporated central bank gold demand of approximately 50 tonnes per month in 2026 and around 40 tonnes per month in 2027 into their revised projections.
This is not incidental to the price outlook. It represents a structural demand baseline that did not exist during previous gold price corrections of comparable magnitude.
| Demand Category | 2026 Estimate | 2027 Estimate |
|---|---|---|
| Official sector (central banks) | ~50 tonnes/month | ~40 tonnes/month |
| ETF inflows | Slowing | Dependent on rate path |
| Private sector / bullion demand | Moderating | Uncertain |
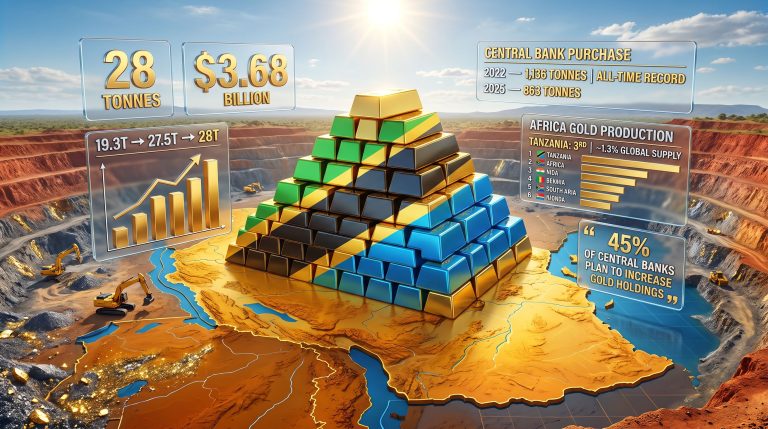
Central banks across emerging markets, BRICS-aligned economies, and even some developed-market institutions have accelerated gold reserve accumulation since 2022, driven by a structural desire to reduce exposure to dollar-denominated assets following the precedent set by the freezing of Russian sovereign reserves. This de-dollarisation motive is not sensitive to short-term interest rate movements in the same way that speculative or ETF-driven demand is.
Central banks buying gold for reserve diversification purposes do not exit their positions because the Fed raises rates by 25 basis points. This creates an asymmetry in the current downside scenario. Even in Goldman's most bearish case at $4,400/oz, central bank buying is not expected to reverse meaningfully, establishing a demand floor that limits how far prices can structurally decline.
The next major ASX story will hit our subscribers first
ETF Flows and the Opportunity Cost Problem
While central bank demand provides structural support, exchange-traded fund flows represent the swing variable in Goldman's near-term outlook. ETF-driven gold demand is highly sensitive to interest rate expectations because it is largely driven by investors making active portfolio allocation decisions rather than sovereign wealth preservation mandates. In addition, understanding the differences between physical gold vs ETFs helps clarify why these two demand sources respond so differently to monetary policy shifts.
Goldman's revised forecast incorporates a meaningful slowdown in gold ETF inflows relative to earlier projections. The logic is straightforward: with the Fed's first rate cut now pushed back to June 2027 (from a prior expectation of December 2026), and a second cut expected in December 2027 (from March 2027), the timeline for improved relative attractiveness of non-yielding gold has extended significantly.
Every month that rate cuts are delayed is another month in which investors holding gold ETFs bear an opportunity cost relative to holding short-duration Treasury instruments yielding materially positive real returns. At scale, this arithmetic tends to generate net ETF outflows rather than inflows, reducing one of the demand pillars that had underpinned the $5,400 target.
Interpreting the Forecast: What a $500 Cut Actually Signals
It is worth pausing on what a forecast cut of this magnitude does and does not communicate. In financial markets, a $500/oz reduction in a year-end price target from a bank with Goldman Sachs's institutional standing tends to generate headline risk and sentiment pressure. However, the analytical content of the revision is more nuanced than the number alone conveys.
Goldman is not predicting that gold will collapse or that the bull market is over. The revised $4,900 target still implies a recovery of approximately $800/oz from the mid-June 2026 spot level near $4,100. That is a projected gain of nearly 20% in roughly six months. The downgrade is a recalibration of magnitude and timing, not a strategic reversal.
Investors should treat institutional gold price forecasts as probabilistic scenario anchors rather than precise endpoints. Goldman's own track record on gold targets includes multiple revisions within single calendar years, reflecting the inherent difficulty of forecasting an asset class whose price is simultaneously determined by monetary policy, geopolitics, currency dynamics, and investor sentiment.
Gold has experienced comparable drawdown periods during prior tightening cycles, including the 2015–2018 period and the 2022–2023 rate hiking cycle, before resuming meaningful upward trends once monetary conditions stabilised. In both cases, investors who treated the interim drawdowns as structural failures of the gold investment thesis rather than cyclical adjustments missed substantial subsequent recoveries.
Key Variables to Monitor Through H2 2026
For investors tracking the Goldman Sachs gold price forecast cut to $4,900 and its implications, the following data points will determine which of the three scenarios materialises:
Bearish signals warranting caution:
- CME FedWatch rate hike probability for December 2026 rising above 87%
- Monthly US CPI or PCE inflation data coming in above expectations
- Gold ETF weekly outflows accelerating across major vehicles including GLD and IAU
- Fed Chair Warsh delivering additional hawkish commentary at subsequent press conferences
Bullish signals supporting recovery:
- Monthly central bank purchase data from the World Gold Council exceeding 50 tonnes
- US dollar index (DXY) weakening, as dollar depreciation historically supports gold in dollar terms
- TIPS real yields peaking and beginning to decline, reducing gold's opportunity cost
- New geopolitical escalation events triggering institutional safe-haven demand
The intersection of these signals, rather than any single data point, will determine whether gold finds a path back toward $4,900 by December or tests the $4,400 level that Goldman has identified as the downside scenario threshold.
What the Goldman Sachs Revision Means for Gold Market Positioning
The Goldman Sachs gold price forecast cut to $4,900 is best understood as a regime-change acknowledgment rather than a negative fundamental assessment. The bank is recognising that the monetary policy environment underpinning its prior $5,400 target has shifted materially, and that the timeline for gold's structural bull case to reassert itself has extended.
The structural pillars remain: central bank diversification away from dollar assets, long-term inflation uncertainty, geopolitical fragmentation, and the finite supply dynamics of physical gold. None of these have changed because Kevin Warsh gave a hawkish press conference.
What has changed is the near-term rate environment that determines how quickly and how directly those structural drivers translate into price appreciation. Goldman's revised framework suggests patience is now required where urgency was previously warranted. For investors with genuine long-term conviction in gold's macro role, that is a very different message from the one that the headline number alone might imply.
Disclaimer: This article is intended for informational and educational purposes only and does not constitute financial or investment advice. Gold price forecasts involve significant uncertainty, and past performance of commodity markets is not indicative of future results. Readers should consult qualified financial advisors before making any investment decisions.
Want to Invest Ahead of the Next Major Mineral Discovery?
Discovery Alert's proprietary Discovery IQ model delivers real-time alerts on significant ASX mineral discoveries, transforming complex data across 30+ commodities into clear, actionable insights for both short-term traders and long-term investors — explore historic discoveries and their exceptional returns to understand the opportunity, then begin your 14-day free trial at Discovery Alert to position yourself ahead of the broader market.