
July 9, 2026
When Processing Plants Outrun Their Own Design: What Kiniero Reveals About Modern Mine Restarts
In gold mining, the distance between a plant's nameplate capacity and its actual operating ceiling is rarely discussed openly. Engineers design processing facilities conservatively, building in margins for ore variability, mechanical downtime, and metallurgical unpredictability. When a restarted operation consistently punches through that ceiling, it signals something more significant than good fortune. It reflects a convergence of ore body characteristics, circuit optimisation decisions, and operational discipline that many newly commissioned mines never achieve, let alone in their first two quarters of commercial production.
The Guinea Kiniero gold mine production story in 2026 is precisely this kind of outlier. Understanding why it matters requires looking beneath the headline numbers into the engineering and geological realities that made such performance possible.
When big ASX news breaks, our subscribers know first
A Mine With Deep Roots: Kiniero's Operational History and Why It Matters
Kiniero is not a blank-slate development. The deposit in Guinea's Kouroussa Prefecture was originally brought into production under Semafo, generating approximately 418,000 ounces across a twelve-year operational lifespan before being placed on care and maintenance in 2014. That dormancy lasted roughly a decade, during which the gold price outlook and Guinea's regulatory landscape both evolved considerably.
Restarting a previously producing asset carries a fundamentally different risk profile than constructing a greenfield mine. On one hand, historical metallurgical data, existing infrastructure footprints, and established site access reduce upfront uncertainty. On the other hand, equipment rehabilitation, workforce reconstitution, and the potential for geological surprises in areas previously mined but not fully characterised create their own complications.
The Kiniero restart timeline unfolded as follows:
- First gold pour achieved in December 2025
- First commercial gold shipment of 6,336 troy ounces (approximately 197 kilograms) completed in February 2026
- Full production ramp-up continued through the first half of 2026
- Q2 2026 marked the first full quarter of optimised commercial operations
What distinguishes Kiniero's restart from many comparable projects is the speed at which throughput stabilised above design parameters. Most restarted operations spend twelve to eighteen months troubleshooting circuit bottlenecks before reaching nameplate capacity. Kiniero appeared to exceed nameplate throughput within its first full operational quarter.
How the Processing Circuit Actually Performs: Engineering Behind the Numbers
Nameplate Capacity vs. Demonstrated Throughput
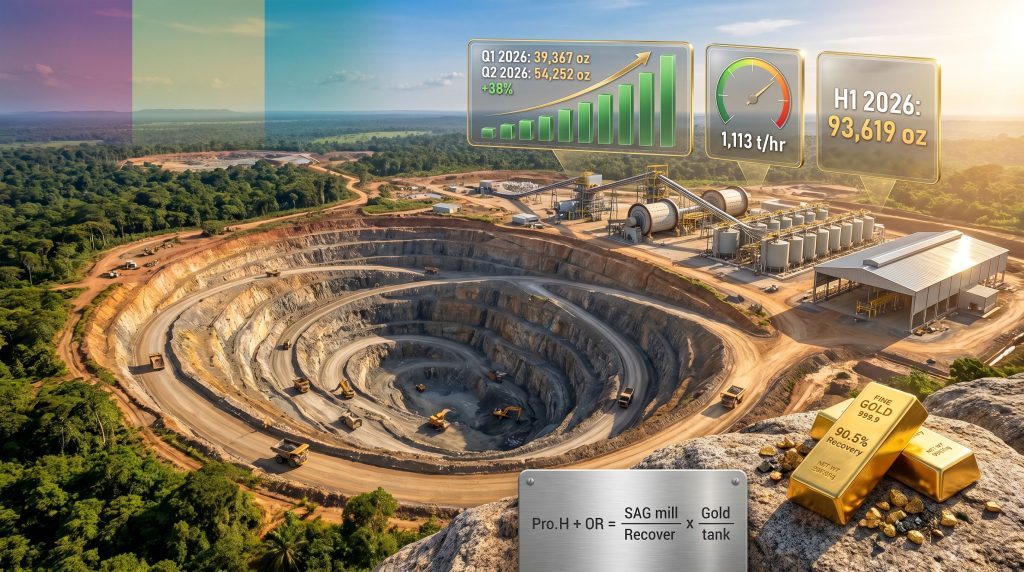
The plant at Kiniero carries a nameplate design capacity of 5 to 6 million tonnes per year, representing the throughput rate its engineers intended the circuit to sustain under standard ore hardness and feed conditions. What actually occurred during Q2 2026 was materially different.
| Operational Parameter | Design Specification | Q2 2026 Actual Performance |
|---|---|---|
| Annual Processing Capacity (Nameplate) | 5 to 6 million tonnes per year | ~9 million tonnes per year equivalent |
| Average Throughput Rate | Baseline design | 1,113 tonnes per hour |
| Ore Milled (Q2 2026) | Planned quarterly rate | 2.2 million tonnes |
| Average Head Grade (Q2 2026) | Variable by ore zone | 0.86 g/t Au |
| Gold Recovery Rate | ~87.9 to 88% (early ramp) | 90.5% |
Operating at an annualised throughput equivalent of roughly 9 million tonnes per year against a 6-million-tonne nameplate means the plant was running at approximately 150% of its design rate. This is not simply a matter of pushing more ore into a mill. Sustained above-nameplate throughput typically reflects softer-than-anticipated ore hardness, which reduces energy consumption per tonne and allows mills to process material faster without mechanical stress accumulation.
In the context of West African gold deposits, softer oxide and transitional ore zones — which are often the first material encountered in open-pit mining sequences — can be significantly easier to process than the fresh sulphide rock found at depth. This is one plausible explanation for Kiniero's early throughput performance, though the specific ore hardness data from the current campaign has not been publicly disclosed in full detail.
Understanding the Gold Production Formula
Gold output from any processing operation is determined by three interacting variables:
- Tonnes of ore milled (throughput volume)
- Head grade (grams of gold per tonne of ore fed to the plant)
- Metallurgical recovery rate (percentage of contained gold successfully extracted)
The relationship is straightforward: Tonnes Milled x Head Grade x Recovery Rate = Gold Produced
Applying Kiniero's Q2 2026 figures: 2,200,000 tonnes x 0.86 g/t x 90.5% recovery = approximately 54,252 ounces. This precisely matches the reported output, confirming internal consistency in the disclosed data.
How is gold mine production calculated? Gold production is determined by multiplying the total tonnes of ore processed by the average head grade (grams of gold per tonne) and the metallurgical recovery rate. At Kiniero, 2.2 million tonnes milled at 0.86 g/t with 90.5% recovery produced approximately 54,252 ounces in Q2 2026.
What the Recovery Rate Improvement Signals
The progression from approximately 87.9 to 88% recovery in early commercial production to 90.5% by Q2 2026 is meaningful in metallurgical terms. In carbon-in-leach (CIL) or carbon-in-pulp (CIP) gold processing circuits — the most common circuit configurations for West African heap oxide and fresh ore deposits — recovery improvements of this magnitude typically reflect one or more of the following:
- Optimisation of cyanide dosing rates relative to ore mineralogy
- Improved carbon activity and elution circuit performance
- Reduction in preg-robbing behaviour (where naturally occurring carbonaceous material in ore competes with activated carbon for dissolved gold)
- Better management of oxygen addition to the leach circuit
- Stabilisation of pulp density and residence time parameters
Each percentage point of recovery improvement on a throughput base of 2.2 million tonnes per quarter represents thousands of additional ounces captured. Furthermore, the move from 88% to 90.5% recovery across Kiniero's Q2 volume equates to approximately 1,500 to 1,800 additional ounces compared to early-ramp recovery levels — a material contribution to quarterly output.
Quarter-by-Quarter Production: Reading the Ramp-Up Trajectory
Q1 2026 vs. Q2 2026: A Structural Comparison
| Production Metric | Q1 2026 | Q2 2026 | Period Change |
|---|---|---|---|
| Gold Produced (oz) | 39,367 | 54,252 | +38% |
| Gold Sold / Provisionally Sold (oz) | 32,306 | Pending full disclosure | – |
| Average Realised Gold Price (per oz) | $4,804 | Elevated market environment | Favorable |
| Recovery Rate | ~87.9 to 88% | 90.5% | Improving trend |
| Ore Milled | Partial quarter | 2.2 million tonnes | Full quarter data |
The Q1 figure requires important context: commercial production was only declared in February 2026, meaning Q1 captured approximately six to seven weeks of full commercial operations rather than a complete thirteen-week quarter. Consequently, the 38% jump to 54,252 ounces in Q2 reflects both a full-quarter contribution and genuine operational improvement, not simply more calendar days.
H1 2026 Cumulative Performance and Annual Guidance Tracking
- H1 2026 total gold production: 93,619 ounces
- Full-year 2026 guidance range: 157,000 to 174,000 ounces
- H1 represents approximately 57 to 60% of the full-year guidance midpoint
- The mine's long-term steady-state profile is 139,000 ounces per year over nine years
- Kiniero's first-year guidance already exceeds its own long-term average by approximately 11 to 25%
This front-loading of production is a well-established feature of open-pit gold mine sequencing. Near-surface oxide ore, which is typically higher-grade and easier to process than the fresh sulphide rock encountered later in mine life, is prioritised in early years. As pit depth increases and ore transitions from oxide to sulphide, throughput rates may need to be recalibrated and recovery chemistry adjusted, potentially normalising output toward the long-term average profile.
Financial Architecture: What the Operating Margin Actually Looks Like
AISC Analysis and Revenue Generation Capacity
Kiniero's projected all-in sustaining cost sits in the range of approximately $980 to $1,066 per ounce. Against Q1 2026's average realised gold price of $4,804 per ounce, the implied operating margin is striking. The strong gold equities performance seen across West African producers has further amplified investor interest in operations like Kiniero.
| Parameter | Estimate |
|---|---|
| AISC (per oz) | ~$980 to $1,066 |
| Q1 2026 Average Realised Price (per oz) | $4,804 |
| Implied Operating Margin (per oz) | ~$3,738 to $3,824 |
| H1 2026 Total Production (oz) | 93,619 |
| Cash and Bullion (end of June 2026) | A$530 million (~USD $365 million) |
All-in sustaining cost is a standardised metric in the gold mining sector that encompasses direct mining and processing costs, site-level general and administrative expenses, sustaining capital expenditures required to maintain current production rates, and applicable royalties. It intentionally excludes growth capital and corporate overhead, making it the most useful benchmark for comparing operational efficiency across different mines.
At a margin of nearly $3,800 per ounce, Kiniero is generating substantial free cash flow at current gold prices. The company's treasury position of approximately A$530 million at the end of June 2026 reflects the pace of cash accumulation during the ramp-up phase, providing significant financial flexibility for what comes next.
It should be noted that gold prices and operating conditions can change materially. This analysis reflects conditions reported through mid-2026 and should not be interpreted as a forecast of future financial performance.
Guinea's Position in West Africa's Gold Hierarchy
Why Capital Is Rotating Toward Guinea
Guinea's mining identity has historically been defined by bauxite. The country holds some of the world's largest bauxite reserves and accounts for a dominant share of global bauxite exports — a position that has attracted substantial Chinese and international infrastructure investment over decades. This existing mining infrastructure, including port facilities, logistics networks, and regulatory familiarity with large-scale resource extraction, creates meaningful advantages for gold developers operating in the same jurisdiction.
The broader West African gold belt has faced a significant reallocation of investor capital in recent years, driven primarily by security deterioration in Burkina Faso and escalating resource nationalism tensions in Mali. However, Guinea has emerged as a relative beneficiary of this reorientation, attracting operators seeking scalable gold projects in a comparatively stable operating environment.
| Country | Key Gold Attributes | Risk Profile |
|---|---|---|
| Guinea | Emerging gold producer, bauxite infrastructure base, large undeveloped deposits | Moderate, improving regulatory clarity |
| Mali | Established major producer, recent government-operator tensions | Elevated, political and regulatory risk |
| Burkina Faso | Historically significant producer | High, security and political instability |
| Ghana | Mature jurisdiction, strong institutional framework | Lower, well-established mining code |
| Côte d'Ivoire | Growing mid-tier producer | Moderate, improving investment climate |
This reallocation dynamic is not simply about risk avoidance. Guinea's eastern gold corridor, including the Kouroussa Prefecture where Kiniero sits, hosts geological structures that are analogous to some of the most productive gold belts in West Africa. The Birimian greenstone belts that underpin gold mineralisation across the region extend into Guinea with relatively limited modern exploration coverage, suggesting the discovered resource base may represent only a fraction of the district's actual endowment. Reviewing the latest gold drill results from this corridor reinforces just how underexplored parts of Guinea's gold belt remain.
The next major ASX story will hit our subscribers first
The Corporate Architecture: How the Robex-Predictive Merger Assembled This Portfolio
Merger Rationale and Strategic Logic
The merger between Predictive Discovery and Robex Resources, valued at approximately $1.45 billion, was structured around a classic mine development logic: combining a near-term cash-generating operation with a large-scale development project to create self-funding growth. According to the Kiniero feasibility study, the project's technical parameters strongly supported this strategic rationale.
- Robex contributed: The operational Kiniero mine, an asset in active ramp-up with demonstrated production capacity and near-term cash flow
- Predictive contributed: The Bankan gold project, described as one of Africa's largest undeveloped gold assets, along with exploration pipeline exposure across Guinea
- Combined result: A Guinea-anchored gold platform with current cash flow, a major development project advancing toward construction, and a third operating asset at Nampala in Mali
This structure matters for capital allocation strategy. Kiniero's operating cash flow can theoretically fund a meaningful portion of Bankan's development capital requirements, reducing the dilutive equity issuance that typically burdens gold developers reliant on external financing. A robust definitive feasibility study for Bankan will ultimately determine how much external capital remains necessary. Whether operating cash flow alone will be sufficient to fund Bankan's full construction cost remains to be determined as detailed feasibility outputs become public.
The 400,000-Ounce Target: Scenario Analysis
The stated ambition of exceeding 400,000 ounces of annual production by 2029 from the Guinea-led portfolio implies a substantial contribution from Bankan once it reaches full production. If Kiniero sustains its long-term profile of approximately 139,000 to 155,000 ounces annually, Bankan would need to contribute roughly 250,000 or more ounces per year to achieve the combined target.
At current gold price levels, a 400,000-ounce-per-year operation generating margins in the range seen at Kiniero would represent annual operating cash flow in the multi-billion dollar range at the portfolio level. This scenario remains contingent on Bankan's construction timeline, capital availability, permitting outcomes, and sustained gold price strength. Investors should treat production targets beyond the current operational period as forward-looking projections subject to material uncertainty.
In addition, the ongoing wave of gold M&A activity across West Africa suggests that assets of this scale and quality attract significant corporate attention, potentially influencing the long-term trajectory of the combined portfolio.
Frequently Asked Questions: Guinea Kiniero Gold Mine Production
How much gold has the Kiniero mine produced in 2026?
As of the end of June 2026, the Guinea Kiniero gold mine production total reached 93,619 ounces, split between 39,367 ounces in Q1 and 54,252 ounces in Q2. This positions the mine at approximately 57 to 60% of its full-year guidance range of 157,000 to 174,000 ounces.
When did the Kiniero gold mine start commercial production?
Kiniero achieved its first gold pour in December 2025 and declared commercial production in February 2026, coinciding with its first shipment of 6,336 troy ounces. Robex Resources officially confirmed the commencement of commercial operations at Kiniero, marking Guinea's second new gold mine in three years.
What is Kiniero's nameplate processing capacity versus actual throughput?
The plant's nameplate capacity is 5 to 6 million tonnes per year. In Q2 2026, throughput averaged 1,113 tonnes per hour, equating to an annualised rate of approximately 9 million tonnes per year — roughly 50% above the upper end of nameplate design capacity.
What does AISC mean in gold mining?
All-in sustaining cost (AISC) is the gold mining industry's primary cost efficiency metric. It captures the full cost of maintaining production at current levels, including mining, processing, site administration, sustaining capital, and royalties, but excludes growth capital and corporate costs. Kiniero's projected AISC of approximately $980 to $1,066 per ounce compares favourably against most West African peers.
How long is Kiniero expected to operate?
Based on current mineral reserves, Kiniero's mine life is projected at approximately nine years from the start of commercial operations in early 2026, with average annual production of approximately 139,000 ounces across the full mine life.
Key Signals for Investors and Industry Observers
The Guinea Kiniero gold mine production trajectory through the first half of 2026 communicates several signals worth noting carefully:
- Throughput running at ~150% of nameplate capacity suggests ore hardness is materially softer than the design basis, which is typical of oxide-dominated early-pit ore but warrants monitoring as mining depth increases
- Recovery improvement from ~88% to 90.5% within two quarters of commercial production indicates the metallurgical team is successfully optimising the leach circuit — a process that typically takes longer at comparable operations
- The $4,804 per ounce average realised price in Q1 2026 against an AISC of approximately $980 to $1,066 per ounce creates a margin environment that is generating exceptional cash flow relative to the mine's development cost
- The A$530 million treasury position at end of June 2026 provides a substantial buffer against gold price volatility and creates optionality for Bankan's advancement without forced dilution
- Guinea's emergence as a preferred West African gold jurisdiction — driven partly by capital flight from higher-risk neighbours — is a structural tailwind for asset valuations in the region, though jurisdictional risk in Guinea itself remains a factor that investors should independently assess
This article is intended for informational purposes only and does not constitute financial advice. Mining production forecasts, cost estimates, and development timelines involve significant uncertainty. Readers should conduct independent research and consult qualified financial advisers before making investment decisions.
Want to Identify the Next Major ASX Gold Discovery Before the Market Does?
Discovery Alert's proprietary Discovery IQ model scans ASX announcements in real time, instantly alerting subscribers to significant mineral discoveries — the kind of early-stage opportunities that can generate substantial returns, as showcased on Discovery Alert's dedicated discoveries page. Begin your 14-day free trial today and position yourself ahead of the broader market.