August 13, 2026
When Safe Havens Stop Working: Understanding Why Gold Fell on Iran Strikes and the Oil Surge
There is a category of market event that exposes the gap between what investors believe and how markets actually function. These moments are rare, but when they arrive, they carry more analytical value than months of ordinary price action. The precious metals complex experienced exactly such a moment on July 8, 2026, and the lesson it delivered challenges one of the most deeply held assumptions in commodity investing.
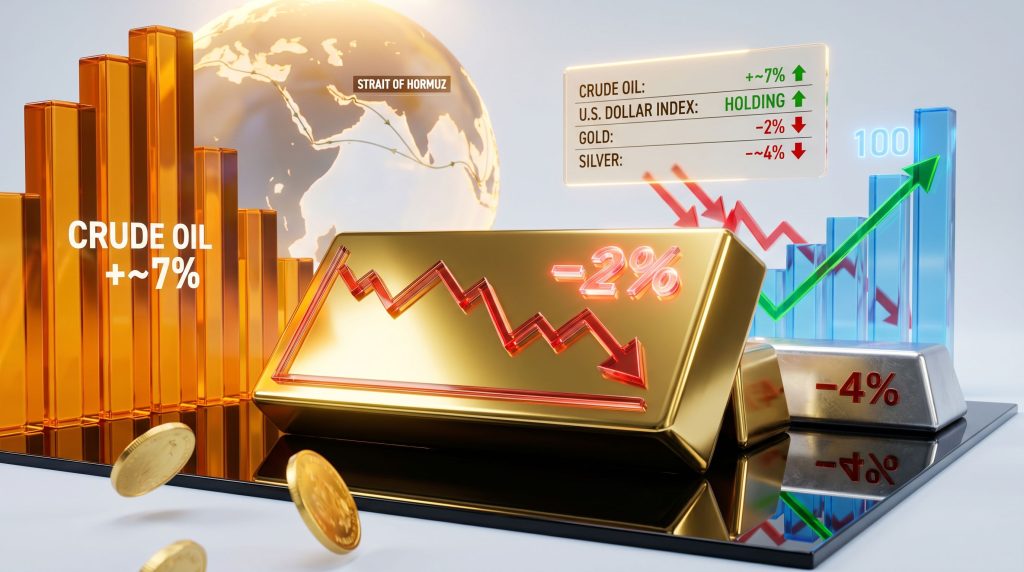
The conventional framework is straightforward: military conflict in oil-producing regions equals higher gold prices. Energy supply disruptions equal safe-haven demand. Geopolitical escalation equals a flight from risk assets and into the metals that have preserved wealth through centuries of instability. On July 8, 2026, every one of those triggers fired simultaneously — and gold fell on Iran strikes and oil surge conditions by more than 2%, while silver declined nearly 4%.
Understanding precisely why this happened requires dismantling the narrative-based approach to gold analysis and replacing it with a mechanistic one grounded in yield dynamics, currency flows, and the structural transformation of the U.S. energy economy.
When big ASX news breaks, our subscribers know first
The Three-Step Chain That Connects Oil Shocks to Gold Weakness
The relationship between crude prices and precious metals is not direct. It operates through a sequential transmission mechanism, and each step matters. Furthermore, the sequencing of these steps determines whether gold benefits or suffers during a geopolitical shock.
Step 1: Supply Disruption Reprices Energy Risk
The Strait of Hormuz carries roughly one-fifth of global oil supply. Military escalation in that corridor instantly introduces a physical supply-risk premium into crude futures. The approximately 7% single-session surge in crude prices on July 8, 2026 reflected both the immediate sanctions impact — specifically the revocation of Iran's oil export licence — and forward pricing for potential further disruption. Reporting from The Australian confirmed how swiftly markets priced in these fears across both oil and gold simultaneously.
Step 2: Energy Prices Feed Inflation Expectations
Transportation costs, manufacturing inputs, and household energy bills all respond to crude price movements. When oil spikes sharply, near-term inflation projections rise across major economies, and central bank policy models register the change almost immediately. Consequently, crude oil price analysis frameworks consistently highlight this inflationary transmission as a key risk factor for broader commodity markets.
Step 3: Inflation Expectations Shift Federal Reserve Policy
Here is where the mechanism turns counterintuitive for gold investors. When inflation expectations rise, the probability of Federal Reserve rate cuts decreases, and the probability of additional tightening or prolonged restrictive policy increases. Higher nominal rates, combined with elevated inflation expectations, can push real yields upward. Real yields — the inflation-adjusted return available on U.S. Treasuries — represent the single most important structural driver of gold pricing. The relationship between gold bonds dynamics and economic cycles makes this transmission particularly consequential.
Gold produces no income. When the real yield available from holding government bonds rises, the opportunity cost of holding gold rises proportionally. Capital rationally rotates toward yielding assets, and gold bears the consequence.
This is the mechanism that governed July 8, 2026. The oil shock did not trigger a gold rally. It triggered an inflation expectation adjustment, which triggered a rate-hawkishness repricing, which strengthened the dollar and pushed gold lower.
Why the Dollar Captured the Safe-Haven Bid Instead of Gold
A structural shift in the U.S. economy over the past decade fundamentally altered how oil price shocks transmit to the dollar. The United States transitioned from being a net energy importer — a status that made crude price surges economically damaging — to becoming a major global energy exporter. This transformation means the relationship between oil prices and the dollar has partially reversed.
When crude prices surge today, U.S. energy export revenues increase. That improvement in the trade balance generates dollar demand. Simultaneously, foreign economies facing imported inflation from higher oil prices come under pressure to tighten their own monetary policy, which reduces the relative attractiveness of capital flight away from U.S. assets. Both dynamics support the dollar during oil shocks.
The U.S. Dollar Index breaking above the psychologically significant 100 level and holding that breakout under maximum geopolitical stress is analytically important. In technical analysis terms, a breakout level that holds during the most extreme stress test available — in this case, a Middle East military escalation combined with a 7% crude surge — represents one of the strongest confirmatory signals a chart can produce. Each session in which gold fails to rally while the dollar holds above 100 adds weight to the interpretation that this is a structural trend, not a temporary positioning shift. As noted by The Guardian's coverage of similar prior events, the gold-safe-haven narrative often breaks down precisely when it seems most relevant.
July 8, 2026: Cross-Asset Performance Summary
| Asset | Session Move | Market Interpretation |
|---|---|---|
| Crude Oil (WTI) | +~7% | Supply shock, sanctions, risk premium |
| U.S. Dollar Index | Held above 100 | Safe-haven inflow, rate hawkishness |
| Gold | -2%+ | Dollar strength, real yield pressure |
| Silver | -~4% | High-beta sector confirmation |
| Gold Mining Equities | -~5% (prior session) | Leading indicator, margin compression |
Silver's Decline as a Sector-Level Signal
Silver's dual nature as both a monetary metal and an industrial commodity makes its behaviour during stress events particularly revealing. It functions with historical parallels to gold, and simultaneously carries significant manufacturing demand in electronics, solar panels, and medical devices.
During genuine safe-haven demand episodes, silver tends to underperform gold because its industrial sensitivity introduces economic risk that partially offsets its monetary appeal. During broad precious metals sector weakness, however, silver tends to outperform to the downside, falling faster and further than gold due to its elevated beta.
A nearly 4% single-session decline in silver on a day that featured a geopolitical oil shock — specifically one that should theoretically drive inflation hedge demand — is a high-conviction bearish signal. The behaviour is inconsistent with a sector that is consolidating before a move higher. It is consistent with a sector in which institutional positioning is net short or actively reducing long exposure.
When the metal most associated with outperforming during inflation surges leads the entire complex lower on a day defined by an energy supply shock, the market is communicating something precise: the dominant trend is not supportive of precious metals under the current macro regime.
How Mining Equities Acted as a Leading Indicator
One of the analytically significant details from July 8, 2026 is the sequencing of declines across related asset classes. Gold and silver mining equities fell approximately 5% in the session prior to the gold price decline. This lead-lag relationship is not coincidental. Understanding how gold price movement affects mining equities helps explain why equity markets priced the margin pressure immediately.
Mining stocks discount future earnings and cash flows. When oil prices surge, mining companies face a direct and immediate margin compression problem: energy is one of the largest operating costs in open-pit and underground mining operations. Even if gold prices hold steady, a 7% spike in diesel and electricity-linked energy inputs reduces projected earnings.
Beyond operating cost sensitivity, mining equity declines ahead of spot metal moves can reflect:
- Institutional funds reducing sector exposure ahead of anticipated spot price weakness
- Forward earnings discounting as higher real rates reduce the present value of future metal revenues
- Cross-commodity positioning adjustments as large multi-asset funds rebalance
- Information flows that precede publicly visible spot market movements
The Freeport-McMoRan (FCX) situation during this period reinforces the point. FCX, a major copper producer, declined substantially in the prior session while copper spot prices had not yet moved. This equity-leads-spot sequencing across both the gold complex and the copper complex suggests sophisticated market participants were repositioning across the entire commodity sector in advance of the broader price moves.
The Stagflation Threshold: When the Mechanism Reverses
The transmission chain described above — from oil shock to inflation to dollar strength to gold weakness — does not operate identically at every magnitude of crude price increase. Scale and duration matter enormously, and historical precedent provides a useful framework.
Oil Shock Magnitude and Precious Metals Response
| Shock Magnitude | Primary Economic Effect | Gold Response | Dollar Response |
|---|---|---|---|
| Moderate (+5-10%) | Inflationary; rate hike expectations rise | Bearish | Bullish |
| Severe (+30-50%) | Stagflationary; growth begins deteriorating | Neutral to Bullish | Mixed |
| Extreme (Strait closure; crude well above $100) | Recessionary shock; financial system stress | Strongly Bullish | Bearish |
The 1970s oil shocks provide the historical template for the extreme scenario. When crude prices rose dramatically enough to simultaneously crush economic growth and sustain elevated inflation, central banks eventually faced an impossible policy dilemma: fight inflation or prevent recession. In that environment, gold surged because the dollar came under fundamental pressure and real assets became the preferred store of value.
The July 8, 2026 event sits firmly in the first row of the table above. No Strait closure occurred. Crude rose sharply but not catastrophically. The Fed showed no indication of pivoting away from its restrictive stance. All arrows pointed toward the inflationary transmission, not the stagflationary one.
The key scenario to monitor is a complete Strait of Hormuz closure removing roughly 20% of global oil supply. That magnitude of disruption would represent a qualitatively different shock — one capable of forcing central banks to abandon rate hawkishness to address financial system stress. Consequently, that remains the single scenario most capable of reversing the current gold-negative transmission mechanism.
The next major ASX story will hit our subscribers first
The Federal Reserve Hawkish Overlay
The June FOMC meeting minutes, released on the same day as the Iran strikes, added a compounding headwind to the already negative gold setup. A hawkish tone in those minutes, emphasising the Fed's prioritisation of inflation containment, reinforced the rate-expectations channel operating through the oil shock transmission. In addition, the gold safe-haven trade was undermined by the simultaneous tightening signals emerging from this Fed communication.
The feedback loop this creates is self-reinforcing:
- Higher oil prices elevate near-term CPI expectations
- Elevated CPI reduces the probability of Fed rate cuts
- Higher expected rates increase real yields on U.S. Treasuries
- Higher real yields raise the opportunity cost of holding gold
- Capital rotates from gold into yielding dollar-denominated assets
- Dollar strengthens further, creating additional headwinds for gold
Each link in this chain was active and reinforcing on July 8, 2026. The combination of an oil-driven inflation shock and hawkish Fed documentation created a compounding negative environment for precious metals that fundamentally overwhelmed any safe-haven narrative.
FAQ: Gold, Iran Strikes, and the Oil Price Transmission
Does Geopolitical Conflict Always Push Gold Higher?
No. The direction of gold's response to geopolitical events depends on the macroeconomic transmission mechanism involved. When conflict generates inflationary pressure that supports central bank tightening, the resulting dollar strength and real yield increases can more than offset traditional safe-haven demand.
Why Did the Dollar Benefit More Than Gold From the Iran Escalation?
The U.S. position as a major energy exporter means crude price surges improve U.S. trade dynamics. Combined with inflation expectations that support Fed hawkishness and make dollar-denominated yielding assets more attractive, the dollar captured the safe-haven flows that would historically have flowed into gold.
What Would Need to Happen for Gold to Rally Strongly on Middle East Tensions?
Either a shock large enough to trigger genuine recession fears and force a Fed policy pivot toward easing — specifically a Strait of Hormuz closure with crude prices well above $100 — or a breakdown in dollar confidence driven by fiscal or monetary policy concerns rather than geopolitical risk.
Why Did Silver Fall More Than Gold?
Silver's elevated beta relative to gold amplifies the underlying sector trend in both directions. When institutional sentiment is bearish on precious metals, silver declines faster. A nearly 4% decline on a day that should theoretically support inflation hedges confirms that the dominant sector trend is downward.
What Do Mining Stock Declines Tell Us About Future Gold Prices?
Mining equities discount future earnings and are sensitive to input cost increases, including energy costs. When they lead spot metal prices lower — particularly when combined with cross-commodity equity signals like FCX declining before copper spot moves — it suggests institutional repositioning ahead of anticipated broader commodity weakness.
Disclaimer: This article is for informational and educational purposes only and does not constitute financial advice. Precious metals markets involve substantial risk, and past performance is not indicative of future results. All price movements, dates, and market scenarios referenced relate to specific market conditions and may not persist. Investors should conduct their own due diligence and consult qualified financial professionals before making investment decisions.
Want to Stay Ahead of the Next Major ASX Mineral Discovery?
While macro forces like oil shocks and Fed policy shape gold's direction, the real wealth-creation moments in resources come from being first to act on significant mineral discoveries — and Discovery Alert's proprietary Discovery IQ model scans ASX announcements in real time, delivering instant, actionable alerts across more than 30 commodities so subscribers are never caught off guard. Explore historic discoveries and the exceptional returns they generated, then start your 14-day free trial at Discovery Alert to position yourself ahead of the broader market.