August 24, 2026
The Strait of Hormuz and the Repricing Logic That Doesn't Wait for Peace
Oil markets have a well-documented habit of moving before the facts fully arrive. Futures curves shift on the weight of expectation, not confirmed delivery. Supply premiums unwind when traders begin to believe scarcity is easing, not when port authority data formally confirms it. This front-running tendency is especially pronounced around geopolitical chokepoints, where the gap between physical reality and market perception can be wide and volatile. Nowhere is this dynamic more consequential right now than the Strait of Hormuz, where Hormuz oil supply recovery and Brent prices are already beginning to reprice significantly before any formal Iran settlement is signed.
Understanding why requires unpacking how the market embeds geopolitical risk, what partial flow recovery actually means for supply expectations, and why the crude and diesel markets are responding to the same underlying event in fundamentally different ways.
When big ASX news breaks, our subscribers know first
Why the Strait of Hormuz Remains the Defining Variable in Global Oil Supply
Roughly 20% of all globally traded oil passes through the Strait of Hormuz, making it the single most consequential maritime chokepoint in the energy world. The strait connects the Persian Gulf export terminals of Saudi Arabia, the UAE, Iraq, Kuwait, and Iran to the broader global market. There is no complete alternative routing. The East-West Pipeline across Saudi Arabia offers partial relief for crude, but refined products and LNG have no comparable bypass. When flows through Hormuz are disrupted, the entire downstream chain from Asian refinery inputs to European diesel benchmarks tightens.
The pricing transmission mechanism works in both directions. Restrictions on Hormuz transit push Brent higher as traders price in reduced forward supply. Conversely, credible evidence that flows are recovering compresses the war-risk premium embedded in spot and near-dated futures prices. This compression does not require a peace treaty. It requires only that the market's probability-weighted expectation of near-term supply shifts from scarcity to adequacy. As noted by Al Jazeera, attacks on shipping have repeatedly dented hopes for reopening, reinforcing just how sensitive this dynamic remains.
Understanding the War-Risk Premium and What Contango Signals
War-risk premiums in oil futures are not a single, fixed number. They are a continuous, real-time recalculation of the probability distribution of future supply outcomes, weighted by trader positioning and hedging behaviour. When geopolitical tension is high, near-term futures prices carry a premium over longer-dated contracts, a structure known as backwardation. This reflects the market's fear that immediate supply is tighter than future supply will be once the disruption resolves.
When that fear begins to abate, and when traders start believing that near-term supply is recovering faster than demand can absorb it, the curve can shift toward contango. In contango, near-term contracts trade below longer-dated ones, signalling that the market sees current supply as adequate or even surplus relative to immediate consumption.
Key Concept: A Brent futures curve shifting into contango does not require a signed peace agreement. It can form whenever the market perceives that near-term supply is recovering faster than demand can absorb it. This is precisely the dynamic that a partial Hormuz flow restoration creates.
As of late August 2026, Brent settled at $93.09 per barrel while WTI fell to $85.65, with both benchmarks declining as markets awaited details of a new US sanctions package. The pullback came despite both benchmarks gaining more than 6% the prior week, which illustrates exactly how sensitive current crude oil prices remain to shifts in the supply narrative rather than confirmed physical changes.
What Does a 50 to 60% Hormuz Flow Recovery Actually Mean for Brent Pricing?
The 50 to 60% flow recovery threshold is analytically significant because it represents the point at which transit volumes are sufficient to shift market expectations from supply-constrained to supply-adequate, even if the strait is not fully open. This is not an arbitrary midpoint. At this level of recovery, the aggregate barrel volumes passing through Hormuz approach a quantity large enough to visibly rebuild Asian refinery feedstock pipelines and reduce the urgency of rerouting and strategic reserve drawdowns.
Critically, it is the expectation of normalisation, not physical delivery confirmation, that moves prices first. Furthermore, futures markets price in the anticipated reality weeks before inventory data confirms it. Understanding crude oil price trends in this context helps clarify why the repricing mechanism is already underway despite the lack of a formal settlement.
The Commonwealth Bank of Australia's $70 to $100 Brent Framework
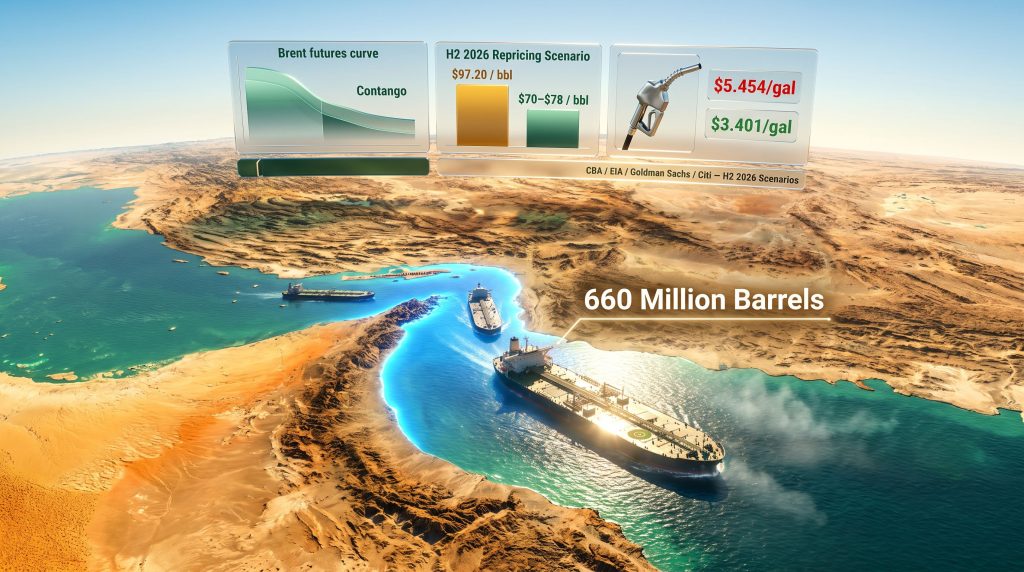
Commonwealth Bank of Australia published its second-half 2026 Brent target range of $70 to $100 per barrel on August 24, 2026, with the specific outcome within that range determined by the degree of Hormuz flow recovery and the structure of new sanctions. The bank's analysis estimated that restoring 50 to 60% of pre-conflict Hormuz transit volumes would be sufficient to revive oversupply expectations and move Brent toward the lower end of that range.
This framework aligns closely with the US Energy Information Administration's August 11, 2026 forecast of approximately $78 per barrel for Brent in the fourth quarter of 2026, suggesting a degree of institutional convergence around the $70 to $78 territory as the partial-recovery scenario outcome.
Divergent Forecasts Across Major Institutions
The spread of institutional forecasts reveals the breadth of uncertainty still embedded in oil price expectations for H2 2026 and into 2027.
| Institution | Brent Forecast | Timeframe | Key Assumption |
|---|---|---|---|
| Commonwealth Bank of Australia | $70–$100/bbl | H2 2026 | 50–60% Hormuz flow recovery |
| EIA | ~$78/bbl | Q4 2026 | Gradual transit resumption |
| Goldman Sachs | ~$80/bbl | Q4 2026 | Accelerated Gulf export normalisation |
| Citi | $60–$65/bbl | Q1 2027 | Full flow normalisation + market surplus |
The gap between Citi's most bearish scenario of $60 to $65 per barrel into Q1 2027 and the upper bound of CBA's range at $100 per barrel is extraordinary. A $40 per barrel spread between credible institutional forecasts does not reflect analytical incompetence. It reflects genuine uncertainty about two variables: the pace of Hormuz flow recovery and the architecture of the US sanctions package. Goldman Sachs' accelerated Gulf export normalisation timeline further suggests that some institutions believe the repricing timeline could compress faster than the base case assumes.
How 660 Million Barrels of Escorted Transit Changed the Supply Calculus
Since early May 2026, US military-escorted tanker operations have facilitated the movement of more than 660 million barrels of oil through the Strait of Hormuz. This is not a trivial figure. At roughly 20 million barrels per day approaching pre-conflict throughput levels, even temporarily sustained flows at this rate are sufficient to materially alter the market's forward supply model.
Escorted transit represents a structural middle ground that the market had not fully priced in before operations commenced. It is neither the catastrophic full closure scenario that war-risk premiums had partially embedded, nor is it the frictionless pre-conflict passage that would eliminate the geopolitical premium entirely. Instead, it creates a persistent, operationally complex partial recovery, with mine clearance delays, extended transit times, and navigational security constraints continuing to limit throughput below theoretical maximums.
US Crude Inventory Data Confirms Supply Normalisation
For the week ending August 14, 2026, US commercial crude inventories rose by 4.4 million barrels to 428.8 million barrels, aligning with the five-year seasonal average. Simultaneously, US crude production reached 13.83 million barrels per day, and exports climbed significantly from 3.06 million barrels per day to 4.07 million barrels per day.
The return of crude inventories to seasonal norms is a meaningful signal. It indicates that the upstream supply chain has largely absorbed the disruption to Hormuz transit, partly through strategic reserve drawdowns, rerouting, and increased non-Gulf production. This normalisation of crude inventories reduces the risk of an acute domestic shortage, even before the strait fully reopens.
Why Diesel Tells a Different Story Than Crude
The crude inventory recovery story and the diesel supply story are not the same story. Treating them as equivalent is one of the more consequential analytical errors that industrial operators can make when building fuel cost assumptions. In addition, the trade war impact on oil has compounded these divergent pressures across different parts of the energy complex.
US distillate inventories stood at 105.6 million barrels as of August 14, 2026, approximately 13% below the five-year seasonal average. This deficit persists despite refineries operating at 97.2% of operable capacity, which is effectively the industry ceiling for sustained throughput. There is no meaningful spare refinery capacity available to close the distillate gap through increased processing.
Critical Distinction: Crude oil and diesel do not move in lockstep. A recovery in Hormuz crude flows can normalise Brent without immediately resolving the distillate shortfall. This means fuel-intensive industries face a bifurcated cost environment where crude benchmarks ease while diesel costs remain structurally elevated.
The reason for this divergence lies in refinery configuration. Most US refineries are optimised around specific crude grades and processing configurations. A shift in crude input quality, a change in the regional grade mix arriving through alternative routing, or a reduction in the proportion of middle-distillate-rich Persian Gulf crude can all reduce the distillate yield per barrel processed, even at maximum throughput.
The Mining Sector's Structural Diesel Exposure
Open-cut mining operations with large haul truck fleets are among the most diesel-intensive industrial activities in the economy. Unlike manufacturing facilities that can partially substitute energy inputs, diesel consumption in haulage is largely inelastic. A large haul truck does not run on natural gas or grid electricity at scale.
As of August 2026, the numbers illustrate the severity of the exposure:
- National retail diesel reached $5.454 per gallon, approximately $1.741 above year-ago levels
- New York Harbor ultra-low sulfur diesel (ULSD) stood at $4.332 per gallon, compared with $2.280 twelve months earlier
- This represents a year-on-year increase of more than 90% at the wholesale ULSD benchmark level
Mine fuel budgets anchored to Brent as the primary cost reference may systematically underestimate operating cost exposure because they conflate the crude market recovery story with the refined product reality. Consequently, strategies around commodity volatility hedging have become increasingly critical for operations with significant diesel exposure.
Can Partial De-Escalation Lower Diesel Costs Before a Peace Agreement Is Signed?
The June 2026 diesel price movement provides the clearest available evidence that partial geopolitical de-escalation can transmit into wholesale fuel costs without a formal settlement. New York Harbor ULSD fell from $3.969 per gallon in May 2026 to $3.401 per gallon in June, a decline of 57 cents per gallon, as diplomatic progress appeared to accelerate.
The subsequent rebound to $3.913 per gallon in July as uncertainty returned demonstrates the mechanism works symmetrically. Markets price in de-escalation when they believe it is credible, and they price it back out when credibility diminishes.
At industrial fuel consumption volumes, a 57-cent per gallon swing is not marginal. For a mining operation consuming several million litres of diesel per month, this magnitude of movement can represent tens of millions of dollars in quarterly cost variance.
Two Scenarios for Brent and Diesel Through Q4 2026
Scenario A: Sanctions Target Iranian Crude Buyers Without Restricting Gulf Transit
- Brent remains in the $85 to $100 upper band of CBA's forecast range
- Distillate inventories remain approximately 13% below the five-year average through Q4 2026
- Retail and wholesale diesel costs stay elevated; mining fuel budgets face continued pressure into 2027
Scenario B: Escorted Hormuz Transit Recovers to 50 to 60% of Pre-War Volumes
- Oversupply expectations re-emerge; Brent moves toward the $70 to $78 lower band
- Wholesale diesel tracks toward the $3.401 per gallon June reference level
- Mining fuel budgets that assumed sustained elevation may experience earlier-than-modelled cost relief
Analytical Note: The critical variable separating these scenarios is not whether an Iran nuclear settlement is signed. It is whether new sanctions restrict Gulf transit directly or target only Iranian crude buyers. Commerzbank commodity analysts assessed that US sanctions were likely to focus on buyers of Iranian oil, with China the most significant buyer, which would reduce Iranian export volumes without directly constraining Gulf shipping lanes. If that assessment is correct, Hormuz recovery remains structurally intact regardless of sanctions severity.
The next major ASX story will hit our subscribers first
Key Indicators to Monitor for Brent Repricing Signals
The Sanctions Architecture Question
The design of the US sanctions package will determine the supply outcome more than its headline severity. Treasury Secretary Scott Bessent described the measures as representing the most significant financial offensive mounted against an adversary. However, the critical distinction is not intensity, it is targeting. Sanctions aimed at Chinese buyers of Iranian crude reduce Iranian export revenues without physically constraining tanker movements through the Gulf.
Sanctions that restrict port access, shipping insurance, or transit permissions for Gulf vessels would have a materially different supply impact. Identifying which category the new measures fall into, as official details emerge, is the most time-sensitive analytical task for energy market participants. OPEC's market influence over production decisions will also interact with these sanctions dynamics in ways that could either amplify or dampen the pricing outcome.
The EIA Weekly Petroleum Status Report as a Leading Indicator
The weekly EIA distillate inventory figure, benchmarked against the 105.6 million barrel August 14 baseline, is the most actionable near-term data point for assessing whether diesel supply is rebuilding. A sustained inventory build above this baseline toward the five-year seasonal average would signal that distillate supply is recovering, which would place downward pressure on wholesale diesel prices independently of Brent's trajectory.
Investors and operators should monitor each weekly release against this specific baseline rather than focusing exclusively on the crude inventory headline figure.
The New York Harbor ULSD $3.401 Reference Level
The $3.401 per gallon June 2026 average for New York Harbor ULSD functions as a meaningful confirmation benchmark. A return toward this level would validate that the Hormuz oil supply recovery and Brent prices thesis is playing out in physical markets rather than just in futures pricing.
The gap between current ULSD pricing of $4.332 per gallon and this reference point, representing approximately 93 cents per gallon, is a reasonable proxy measure for the geopolitical premium currently embedded in wholesale diesel.
The Asymmetric Risk Profile of Supply Recovery Pricing
One of the less-discussed dynamics in energy market psychology is that markets are structurally faster to price in supply recovery than supply disruption. This asymmetry exists because the cost of being caught short on a covered position is more immediately damaging to trading books than the cost of unwinding a long position gradually. Traders hedge against the scenario they can quantify. When evidence of Hormuz flow recovery accumulates, position unwinding tends to be faster and more correlated than the original risk-building phase.
This has a practical implication for industrial operators: the window between the market's initial repricing of supply recovery expectations and the physical arrival of that supply in domestic inventories is the period of maximum forecasting opportunity. Operators who recognise the leading indicator framework described above, watching sanctions architecture, EIA distillate builds, and ULSD price relative to the $3.401 reference, are better positioned to capture cost relief signals before they are broadly reflected in contract pricing.
Building a monitoring framework around three variables, sanctions design, weekly distillate inventory builds relative to the 105.6 million barrel baseline, and New York Harbor ULSD price relative to the $3.401 June reference level, gives industrial operators and investors the earliest available signal of whether partial Hormuz recovery is transmitting into real fuel cost reduction.
The relationship between Hormuz oil supply recovery and Brent prices is ultimately a leading indicator story. The market prices the expectation of physical reality, not the physical reality itself. For those watching closely enough, the signal arrives before the certainty does.
This article contains forward-looking analysis, institutional forecasts, and scenario modelling based on publicly available information as of August 2026. All price forecasts are subject to significant uncertainty and should not be construed as financial advice. Readers should conduct their own due diligence before making investment or operational decisions based on energy price projections.
Want to Track the ASX Mineral Discoveries That Benefit From Shifting Commodity Markets?
When energy price volatility reshapes the cost environment for mining and resources companies, identifying the right ASX discoveries at the right moment becomes critical. Discovery Alert's proprietary Discovery IQ model delivers real-time alerts on significant ASX mineral discoveries, translating complex market conditions into actionable investment insights — start your 14-day free trial today, or explore historic discovery returns to understand just how transformative early positioning can be.