
August 5, 2026
The Governance Architecture Behind a Single Monthly Number
Every month, a number emerges from a federal statistical agency and cascades through financial markets, central bank meeting rooms, Social Security benefit calculations, and bond trading desks simultaneously. That number is the Consumer Price Index, and while most people treat it as a straightforward temperature reading of the economy, it is something considerably more complex: a living institutional instrument whose methodology has been deliberately redesigned multiple times, with measurable directional consequences each time.
Understanding how inflation is measured in the CPI is not merely an academic exercise. It is foundational to interpreting every rate decision, every real yield calculation, and every inflation-sensitive asset class with any analytical rigour.
When big ASX news breaks, our subscribers know first
What the CPI Is Actually Tracking
Price Change, Not Price Level
The Consumer Price Index for All Urban Consumers (CPI-U) does not tell you how expensive things are. It tells you how quickly prices are moving. That distinction is frequently lost in financial media coverage, where a declining CPI is misread as falling prices when it actually describes a decelerating rate of increase.
The CPI measures the average rate of price change across a representative basket of goods and services — not the absolute price level. A lower CPI print means prices are rising more slowly, not that they have become cheaper.
Published monthly by the Bureau of Labor Statistics (BLS), the CPI-U covers approximately 93% of the U.S. population and tracks expenditure across eight categories:
- Food and beverages
- Housing (shelter)
- Apparel
- Transportation
- Medical care
- Recreation
- Education and communication
- Other goods and services
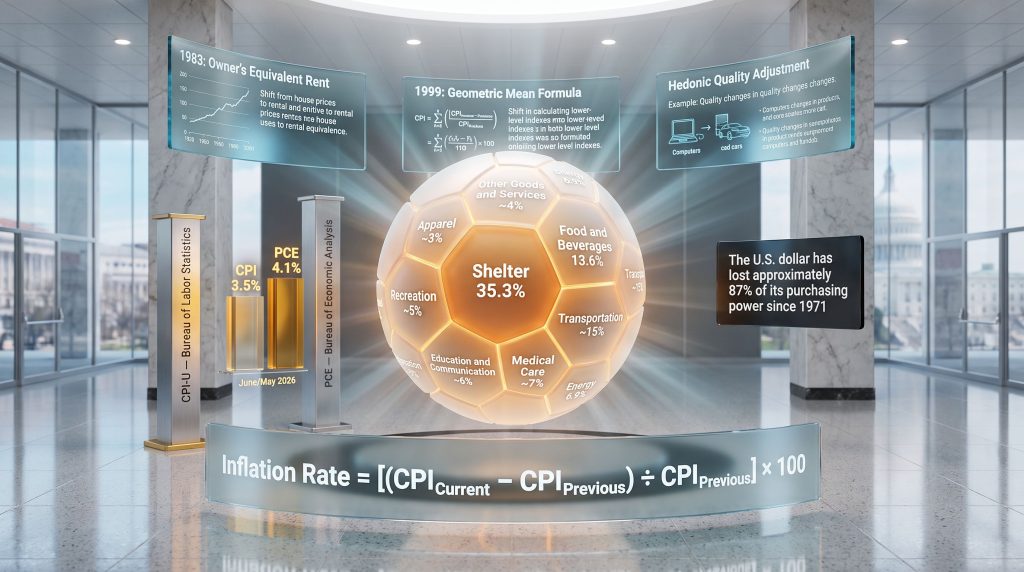
The single largest category by weight is shelter, which accounts for 35.3% of the entire index [BLS, CPI-U Table 1, April 2026]. Food and beverages add another 13.6%. The composition of these weights is not arbitrary — it flows from the Consumer Expenditure Survey (CEX), a separate BLS data collection programme that maps how households actually allocate spending.
How Inflation Is Calculated in the CPI: The Institutional Process
From 80,000 Prices to a Single Percentage
The construction of the CPI is a layered statistical operation that most inflation headlines completely obscure. The BLS deploys price collectors across 75 geographic sampling areas, gathering approximately 80,000 individual prices each month. Those raw price observations feed into 7,776 elementary index cells — the atomic building blocks from which the aggregate index is assembled.
The step-by-step calculation framework works as follows:
- Establish a base period index value (set to 100)
- Collect current-period transaction prices across all basket categories
- Apply expenditure weights derived from the Consumer Expenditure Survey to each category
- Construct the weighted aggregate index value for the current period
- Calculate the inflation rate using the standard percentage-change formula:
Inflation Rate = [(CPI Current – CPI Previous) / CPI Previous] x 100
The 12-month year-over-year comparison is the figure most widely cited in policy announcements and financial reporting. Furthermore, expenditure weights have been updated annually since January 2023, following a formal BLS regulatory change published in the Federal Register in August 2022. Before that change, weights were revised on a two-year cycle [BLS Federal Register, August 2022].
Expenditure Weights: The Hidden Architecture
How much any single category influences the headline number depends entirely on its assigned weight. The shelter component's outsized influence is particularly significant for measurement purposes:
| CPI-U Category | Approximate Weight (April 2026) |
|---|---|
| Shelter (total) | 35.3% |
| — Owner's Equivalent Rent (OER) | 25.9% |
| — Rent of Primary Residence | 7.7% |
| Food and Beverages | 13.6% |
| Transportation | ~15% |
| Medical Care | ~7% |
| All Other Categories | ~29% |
Source: BLS CPI-U Table 1, April 2026
With shelter alone constituting more than one-third of the index, the methodological choices governing how housing costs are measured carry disproportionate influence over every headline inflation figure published.
Three Institutional Reforms That Permanently Reshaped the Index
Why Methodology Is Policy
Each of the three most consequential changes to CPI construction was implemented through formal BLS administrative processes, with published rationales. Each produced a lower reported inflation rate than the prior methodology would have generated. Taken individually, each reform has defensible statistical justification. However, considered in aggregate, their combined directional effect deserves careful attention from any investor or policymaker working with the resulting figures.
Reform One: Owner's Equivalent Rent (1983)
Before 1983, homeownership costs entered the CPI through direct measurement: actual purchase prices, prevailing mortgage interest rates, property taxes, and insurance premiums. When the Federal Reserve's rate-tightening cycle drove mortgage rates toward 18% in the early 1980s, those costs flowed directly into the index.
In 1981, the BLS announced a structural change effective January 1983, replacing direct homeownership cost tracking with a conceptual measure called Owner's Equivalent Rent (OER) — an estimate of what homeowners would theoretically pay in rent if they leased their own properties on the open market [BLS, OER: 30 Years and Counting, 2013].
The consequences for index construction are substantial:
- OER now represents 25.9% of total CPI-U weight, making it the single largest sub-component in the entire index
- OER tracks rental market dynamics, not home purchase costs or mortgage rates
- Because rental markets adjust more slowly than home sales markets, OER characteristically lags actual property price movements by 12 to 18 months
- During periods of rapid home price appreciation, this lag creates a structural dampening effect on measured shelter inflation
Reform Two: The Geometric Mean Formula (1999)
In October 1998, the BLS published its intention to replace the arithmetic Laspeyres formula with a geometric mean formula for most basic CPI components, effective January 1999, covering approximately 61% of total consumer spending in the CPI-U [BLS Monthly Labor Review, October 1998].
The stated rationale was substitution bias. The arithmetic formula assumed consumers purchased fixed quantities regardless of relative price movements. If beef prices rose sharply, the fixed-basket methodology kept tracking beef at the original quantity, ignoring the empirically observable fact that many consumers would shift toward chicken or other protein sources. The geometric mean formula incorporates this substitution behaviour.
The practical effect: substituting toward relatively cheaper alternatives mechanically produces a lower measured price change. The BLS estimated the formula change would reduce the reported annual CPI rate by approximately 0.2 percentage points per year — an amount that accumulates to roughly 2 percentage points of cumulative index divergence over a decade.
Critics of this reform argue that assuming consumers perpetually trade down to cheaper alternatives effectively encodes a declining standard of living into the measurement framework itself, redefining what it means to maintain consistent purchasing power.
Reform Three: Hedonic Quality Adjustment (Ongoing)
Unlike the 1983 and 1999 changes, hedonic quality adjustment is not a discrete reform with a single implementation date. It is a continuous, model-dependent process applied across electronics, appliances, smartphones, and other technology-adjacent consumer goods [BLS, Hedonic Price Adjustment Techniques].
The underlying principle: when a product's nominal price holds steady year-over-year but its technical specifications improve materially, the BLS attributes a portion of that stability to quality enhancement rather than to pure price stability. A laptop priced identically to last year's model but with substantially greater processing capacity is treated as a price reduction in quality-adjusted terms.
Because hedonic adjustment is applied through evolving statistical models across multiple categories, its cumulative directional impact is genuinely difficult to isolate and audit independently — a transparency challenge that distinguishes it from the earlier, more cleanly bounded reforms.
The Boskin Commission: A Formal Policy Audit of CPI Accuracy
Congressional Origins and Scope
In 1995, the Senate Finance Committee commissioned an independent advisory panel chaired by Stanford economist Michael Boskin to assess whether the CPI accurately reflected changes in the true cost of living. The commission's mandate was directly policy-driven: Social Security outlays, federal income tax bracket indexing, and Treasury debt calculations all used the CPI as an input, making measurement accuracy a fiscal matter of the first order.
Findings, Bias Quantification, and Residual Error
The Boskin Commission's December 1996 final report concluded that the CPI overstated the true cost-of-living increase by approximately 1.1 percentage points per year [Boskin Commission Final Report, SSA.gov, 1996]. Four structural bias sources were identified:
| Bias Type | Description |
|---|---|
| Substitution Bias | Fixed-basket design ignores consumer shifts toward relatively cheaper goods |
| Outlet Substitution Bias | Fails to capture consumer migration to lower-cost retail channels |
| Quality Change Bias | Insufficient adjustment for product improvements over time |
| New Product Bias | Delayed incorporation of new goods into the representative basket |
Following seven BLS methodological reforms implemented by 2000, the U.S. Government Accountability Office conducted an independent reassessment. The GAO estimated that residual annual measurement bias remained at 0.73 to 0.9 percentage points [GAO GGD-00-50, February 2000]. The reforms narrowed the gap; they did not close it.
CPI vs. PCE: Why the Federal Reserve Looks at a Different Number
Two Agencies, Two Indexes, One Policy Target
Every Federal Open Market Committee rate decision is calibrated against the Personal Consumption Expenditures (PCE) price index published by the Bureau of Economic Analysis (BEA), not the CPI figure that dominates financial media coverage. This structural divergence has material consequences for how inflation headlines should be interpreted.
| Characteristic | CPI-U | PCE Price Index |
|---|---|---|
| Publishing Agency | Bureau of Labor Statistics (BLS) | Bureau of Economic Analysis (BEA) |
| Fed's 2% Policy Target | Not used | Official benchmark |
| Weight Update Frequency | Annually (since January 2023) | Monthly |
| Consumption Scope | Urban consumer out-of-pocket spending | Broader — includes employer/government healthcare |
| Historical Differential | Baseline | Typically 0.3-0.5 percentage points below CPI |
Sources: BLS; BEA; Federal Reserve Statement on Longer-Run Goals
The structural gap between the two measures is not static. As of mid-2026, the relationship between them inverted in a revealing way: CPI ran at 3.5% year-over-year as of June 2026 [BLS], while PCE headline ran at 4.1% for May 2026 [BEA]. When the Fed's preferred gauge runs above the headline CPI, policymakers are responding to greater inflationary pressure than the most widely cited figure implies.
When PCE exceeds CPI, investors and market participants interpreting only the headline CPI print are working from an incomplete picture of the inflationary environment the Federal Reserve is actually responding to.
The next major ASX story will hit our subscribers first
Real Yields, Asset Pricing, and the Measurement Gap
The Chain From CPI Methodology to Portfolio Outcomes
Understanding how inflation is measured in the CPI matters beyond academic interest because measured inflation feeds directly into real yield calculations, which in turn drive pricing across a wide range of asset classes. This is closely connected to gold and bonds dynamics, where methodology-driven shifts in reported inflation ripple through to real yield environments.
The relationship is straightforward:
Real Yield = Nominal Bond Yield – Measured Inflation Rate
When CPI methodology produces a lower reported inflation figure, the implied real yield is correspondingly higher, even if actual purchasing power erosion is outpacing the official number. This creates a structural gap between reported real yields and experienced real yields.
What This Means for Inflation-Sensitive Assets
Research from the World Gold Council indicates that changes in the CPI account for only approximately 16% of gold's price fluctuations since 1971 [World Gold Council, Gold and Inflation]. For an asset widely characterised as gold as an inflation hedge, that is a surprisingly weak direct correlation.
The more consequential driver of gold pricing is the real yield environment: when inflation-adjusted returns on bonds turn negative, the opportunity cost of holding a non-yielding asset diminishes, historically supporting gold price appreciation.
Since 1971, the U.S. dollar has lost approximately 87% of its purchasing power as measured by the BLS's own CPI-U methodology [BLS CPI-U historical data]. Over that same period, gold has risen from $35 per ounce to above $4,085 [LBMA; goldsilver.com/price-charts/], outpacing cumulative CPI-measured inflation by a factor of approximately 16.
The methodological choices embedded in the CPI, specifically OER, the geometric mean formula, and hedonic adjustment, each lowered the reported inflation rate. A lower reported rate implies a higher official real yield. However, if the GAO's residual bias estimate of 0.73 to 0.9 percentage points is incorporated, the adjusted inflation figure compresses real yields toward zero or below under many current market configurations, shifting the asset allocation logic materially.
Furthermore, gold safe-haven trends demonstrate that investors increasingly turn to gold precisely when confidence in official inflation metrics diminishes, reinforcing its role as a store of value beyond what CPI correlation alone suggests.
Disclaimer: The above analysis is for informational and educational purposes only and does not constitute financial or investment advice. Past performance of any asset class, including gold, is not indicative of future results. Always consult a qualified financial adviser before making investment decisions.
The Full Index Ecosystem: CPI Variants and Their Specific Functions
Beyond the Headline Number
The CPI is not a single index but a family of related measures, each designed for a distinct institutional purpose. Understanding which variant applies in any given policy or investment context is essential to interpreting the number correctly.
| Index | Published By | Primary Use | Population Scope |
|---|---|---|---|
| CPI-U | BLS | General inflation benchmark | ~93% of U.S. population |
| CPI-W | BLS | Social Security COLA calculations | Urban wage earners subset |
| Core CPI | BLS | Underlying trend analysis | Same as CPI-U |
| PCE | BEA | Fed's broader inflation reference | Wider than CPI |
| Core PCE | BEA | Fed's preferred policy gauge | Wider than CPI |
Sources: BLS; BEA; Federal Reserve
The CPI-W and Social Security: A Direct Policy Linkage
A dimension of CPI measurement that receives limited attention outside specialist policy circles is the CPI-W's role in Social Security cost-of-living adjustments (COLAs). The CPI-W is a sub-index tracking urban wage earners and clerical workers specifically, and every methodological decision embedded in it carries direct distributional consequences for tens of millions of benefit recipients.
The gap between measured cost-of-living changes and experienced cost-of-living changes in this context is not abstract; it translates to real purchasing power differences for retirees and beneficiaries over time. In addition, central bank gold demand has grown in part as sovereign institutions seek to preserve purchasing power against precisely these structural measurement uncertainties.
Core CPI: Stripping Out Volatility
Core CPI removes food and energy from the headline index on the basis that supply shocks, geopolitical disruptions, and seasonal patterns drive excessive short-term volatility in those categories, obscuring the underlying trend in persistent price pressures. The Federal Reserve's preferred core measure is core PCE rather than core CPI, reflecting the BEA index's broader consumption coverage and more frequently updated expenditure weights [BLS; BEA].
Consequently, central bank gold reserves have expanded significantly as institutions respond to the divergence between core and headline measures, seeking assets that respond to broad inflationary conditions rather than any single index variant.
Key Takeaways: What the CPI Framework Reveals
For investors and policymakers alike, understanding how inflation is measured in the CPI is best approached by treating it as an institutional product shaped by successive governance decisions, each with quantifiable directional effects. The RBA's explainer on inflation and its measurement provides a useful parallel framework for understanding how these methodological choices play out across different central banking contexts.
- The CPI-U measures the rate of price change, not the price level, across a basket covering approximately 93% of the U.S. population
- Shelter carries the single largest index weight at 35.3%, with Owner's Equivalent Rent alone representing 25.9% of total CPI weight
- Three structural reforms, OER adoption in 1983, the geometric mean formula in 1999, and ongoing hedonic quality adjustment, each lowered the reported inflation rate relative to predecessor methodologies
- The Boskin Commission estimated annual CPI overstatement at 1.1 percentage points; post-reform GAO analysis placed residual bias at 0.73 to 0.9 percentage points annually
- The Federal Reserve's 2% inflation target is expressed in PCE terms, not CPI, meaning every FOMC decision references a different index than the one dominating financial headlines
- Gold's correlation with headline CPI changes is weak at approximately 16% of price variation since 1971; real yields are the dominant driver of gold pricing dynamics
- Since 1971, the dollar has lost roughly 87% of its purchasing power on the BLS's own CPI-U methodology, while gold has appreciated from $35 to above $4,085 per ounce
Furthermore, the ABS FAQ on the Consumer Price Index offers a valuable comparative reference, illustrating how how inflation is measured in the CPI differs across national statistical frameworks and why methodological choices matter at an institutional level.
Reading every monthly inflation release through this methodological lens does not change the number. It changes what the number means.
Disclaimer: This article is for informational and educational purposes only and does not constitute financial or investment advice. Statistics, index values, and price data referenced reflect information available at time of writing and are subject to revision. Always consult a qualified financial adviser before making any investment decisions.
Want to Know Which ASX Mineral Discoveries Could Reshape Your Portfolio?
Discovery Alert's proprietary Discovery IQ model delivers real-time alerts the moment significant ASX mineral discoveries are announced, cutting through complex geological and market data to surface actionable investment opportunities ahead of the broader market — explore Discovery Alert's dedicated discoveries page to understand why historic discoveries have generated substantial returns, and begin your 14-day free trial today to position yourself at the forefront of the next major find.