June 5, 2026

Silver at the Center: Why the Hycroft Mining TRS Initial Assessment Reframes a Decades-Long Resource Story
Most large precious metals deposits are defined by their gold endowment. Investor narratives are built around ounces, grades, and gold price leverage. Yet a growing number of geologically distinctive systems challenge that framework entirely, hosting silver inventories so large that gold becomes the secondary revenue contributor rather than the headline number. Understanding how these deposits behave across metal price cycles, how their processing requirements shape capital intensity, and how their economics respond to commodity movements is essential context for evaluating what the Hycroft Mining TRS initial assessment actually communicates to the market.
When big ASX news breaks, our subscribers know first
What the S-K 1300 Regulatory Classification Actually Signals
When a mining company files a Technical Report Summary under the SEC's S-K 1300 framework, the market often treats the event as a valuation milestone. That instinct is partially correct but requires important qualification. An S-K 1300 Initial Assessment establishes that a mineral resource has economic potential under a defined set of assumptions. It does not establish economic viability, it does not convert resources into reserves, and it does not authorise or support a construction commitment.
The distinction between an Initial Assessment and a definitive feasibility study is not semantic. A feasibility study represents a substantially higher standard of technical and economic confidence, incorporating declared reserves, detailed engineering, and a capital cost estimate accurate to within approximately 15 to 20 percent. An Initial Assessment typically carries cost accuracy in the range of 35 to 45 percent. Investors interpreting the June 2, 2026 TRS filing with the SEC as a signal of imminent development are conflating two very different regulatory categories.
Regulatory Context: The S-K 1300 framework, introduced by the SEC in 2018 and effective from 2021, replaced the prior Industry Guide 7 standard and aligned US disclosure rules more closely with international codes such as NI 43-101 and JORC. One of its key features is the formal distinction between Initial Assessments, Pre-Feasibility Studies, and Feasibility Studies, each carrying progressively higher evidentiary standards.
The independent technical team responsible for the Hycroft TRS includes Ausenco Engineering USA South Inc., Independent Mining Consultants Inc., and WestLand Engineering & Environmental Services Inc., covering process engineering, mining, and environmental disciplines respectively.
The Hycroft Mine: Scale, Geology, and Jurisdictional Positioning
Location, Land Position, and Prior Production History
The Hycroft Mine sits approximately 54 miles west of Winnemucca in Humboldt and Pershing Counties, northern Nevada. The asset occupies a 64,000-acre land package, a scale that places it among the larger land positions held by any undeveloped precious metals project in the United States. Nevada's established regulatory infrastructure, its history of large-scale open pit mining, and its water rights frameworks collectively reduce jurisdictional risk relative to many international development-stage projects.
Critically, Hycroft is not a true greenfield development. Prior production cycles have left behind substantial surface infrastructure including crushing facilities, heap leach pads, and a North Merrill-Crowe processing facility. This legacy infrastructure provides a meaningful capital offset against the cost of building an entirely new operation, though the TRS mine plan still requires significant new construction including the Northeast tailings management facility (TMF), expanded waste rock storage, a rail spur extension, and the primary sulfide process plant.
Why This Deposit Accumulates Silver at Anomalous Scale
The geological origin of the Hycroft deposit is a volcanic hydrothermal system. These systems, formed by the interaction of heated fluids with volcanic host rocks, are capable of transporting and depositing metals across broad, laterally extensive mineralised envelopes. The structural geometry at Hycroft, characterised by gently dipping, wide mineralisation, is particularly effective at concentrating silver at tonnage scales that more structurally constrained deposits cannot replicate.
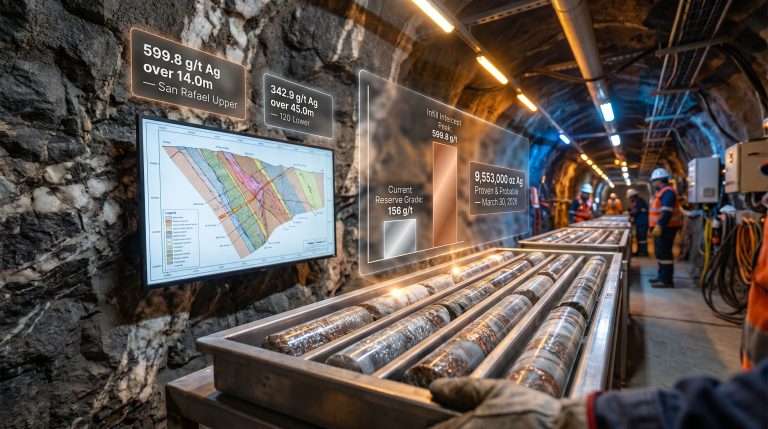
This geological characteristic explains the asymmetric silver-to-gold ratio in the resource. The 2026 Measured and Indicated mineral resource encompasses 16.4 million ounces of gold and 562.6 million ounces of silver, a ratio of approximately 34:1 silver to gold by ounce count. For context, the global average silver-to-gold production ratio runs closer to 8:1 to 10:1 across most primary mining operations. Hycroft's silver endowment is therefore structurally anomalous by any standard benchmark.
Compounding this, the current resource footprint covers less than 15% of the total 64,000-acre land package, implying that the defined deposit represents a fraction of the geological inventory available for future exploration.
| Resource Category | Gold (Moz) | Silver (Moz) |
|---|---|---|
| Measured & Indicated | 16.4 | 562.6 |
| Included in TRS Mine Plan | Yes | Yes |
| Brimstone & Vortex (2023) | Excluded | Excluded |
| Land Package Coverage | <15% | <15% |
Scenario-Based Economics: Base Case vs. Spot Price Analysis
Reading the NPV Spread Across Price Environments
The TRS presents two primary economic scenarios. At base case metal prices, the project delivers a post-tax NPV of $4.3 billion, a post-tax IRR of 16.9%, and a payback period of 4.7 years. At spot prices recorded on May 25, 2026, the post-tax NPV rises to $10.0 billion, the IRR advances to 30.1%, and payback compresses to 2.9 years.
The $5.7 billion spread between these two scenarios is one of the most instructive data points in the entire TRS. It communicates that Hycroft's project-level valuation is not a fixed figure but a dynamic output that tracks metal prices with considerable sensitivity. For precious metals bulls operating in an elevated gold and silver price environment, that spread represents leverage. For project financing counterparties evaluating debt serviceability, it represents a compounding variable that requires stress-testing across downside price scenarios.
| Economic Metric | Base Case | Spot Price (May 25, 2026) |
|---|---|---|
| Post-Tax NPV | $4.3 billion | $10.0 billion |
| Post-Tax IRR | 16.9% | 30.1% |
| Payback Period | 4.7 years | 2.9 years |
| LOM Gold Production | 10.4 Moz | 10.4 Moz |
| LOM Silver Production | 347.5 Moz | 347.5 Moz |
| Mine Life | 51 years | 51 years |
The 51-year mine life is itself an unusual characteristic among development-stage projects. Most project finance structures operate across 15 to 25 year asset lives. A 51-year life introduces long-dated closure liability, metal price forecasting uncertainty across multiple commodity cycles, and operational continuity requirements that go well beyond conventional project structures.
Investors should understand that the NPV calculation discounts these distant cash flows heavily, meaning the first decade of production contributes disproportionately to economic value, particularly given the TRS's front-loaded higher-grade sequencing strategy.
Analytical Note: At a standard 5% discount rate, cash flows generated in year 40 of a mine life are worth approximately 14 cents on the dollar relative to equivalent cash flows generated today. The practical valuation weight of years 30 through 51 is therefore modest, reinforcing the importance of early-year production intensity in driving NPV.
Silver as the Dominant Value Engine: Quantifying the Asymmetry
The $460 Million Per $5 Silver Move Sensitivity
Perhaps the most consequential technical detail in the Hycroft Mining TRS initial assessment is the metal price sensitivity framework. For every $5 per ounce increase in the silver price, post-tax NPV expands by $460 million. The comparable gold sensitivity generates $300 million of NPV per $100 per ounce move.
To translate this into a practical investor framework: a $25 per ounce upward movement in silver from the base case assumption would theoretically add approximately $2.3 billion to the post-tax NPV. That single scenario adds more NPV than the entire difference between the base case and a hypothetical gold-only improvement of $500 per ounce. Silver is not a secondary consideration at Hycroft. It is the primary valuation lever.
This positioning has implications for how investors should think about portfolio construction around this asset:
- Investors with a constructive view on silver's industrial demand trajectory (driven by solar photovoltaic expansion, electronics, and electrification) gain a quantifiable, large-scale US-based exposure through Hycroft's resource base.
- Investors seeking gold price leverage may find more efficient vehicles in conventional gold development projects with lower metallurgical complexity and capital requirements.
- Investors interested in silver supply concentration risk should note that relatively few undeveloped silver projects of this scale exist globally, let alone within Nevada's established permitting environment.
Silver Market Dynamics and the Hycroft Leverage Position
The silver market operates differently from gold in ways that matter to project-level economics. Silver's dual role as both a monetary metal and an industrial commodity creates demand dynamics that can diverge substantially from gold during technology-driven investment cycles. Solar panel manufacturing alone has become one of the fastest-growing sources of silver industrial consumption globally, with photovoltaic applications accounting for a rising share of total annual demand.
A project carrying 562.6 million ounces of silver in its Measured and Indicated resource is therefore positioned at the intersection of precious metals investment demand and structural industrial consumption growth. Furthermore, this combination could amplify price sensitivity beyond historical silver cycle norms. In addition, silver supply deficits in the global market reinforce the strategic significance of large undeveloped deposits like Hycroft.
Capital Structure: The $2.4 Billion Question Without an Answer
Breaking Down Initial and Sustaining Capital
The TRS estimates initial capital at $2.4 billion and life-of-mine sustaining capital at $3.1 billion, producing a total capital commitment across the 51-year mine life of approximately $5.5 billion. The sulfide process plant accounts for the single largest component of initial capital, a direct consequence of the pressure oxidation (POX) flowsheet required to process Hycroft's refractory mineralisation.
| Capital Component | Estimated Amount |
|---|---|
| Initial Capital | $2.4 billion |
| LOM Sustaining Capital | $3.1 billion |
| Total LOM Capital | ~$5.5 billion |
| Financing Plan Disclosed | No |
| Mineral Reserves Declared | No |
Why the Absence of a Financing Pathway Is the Most Critical Near-Term Risk
No financing plan, debt structure, royalty arrangement, or strategic partnership has been disclosed as of the TRS filing date. This is not unusual at the Initial Assessment stage, but it is the central risk variable separating the published economics from any construction reality. Project financing for a $2.4 billion initial capital requirement in the precious metals sector typically involves a combination of:
- Project debt from bank syndicates or development finance institutions, typically structured against declared reserves and supported by offtake arrangements.
- Streaming and royalty financing from specialised capital providers, exchanging upfront capital for a percentage of future metal production at below-market prices.
- Strategic joint ventures with larger mining companies seeking resource exposure without full project ownership.
- Equity markets through follow-on share issuances, which carry dilution implications for existing shareholders.
Each pathway carries distinct trade-offs in terms of cost of capital, dilution, operational control, and timeline. The absence of any disclosed arrangement means the project's development timeline remains open-ended, and investors are currently pricing both the resource and the capital sourcing uncertainty simultaneously.
Risk Framework: The sequence from Initial Assessment to funded construction is not a single step. Reserve declaration must precede feasibility-level engineering. Feasibility-level engineering is typically required to support project debt. BLM permitting completion reduces regulatory risk for financing counterparties. All three are prerequisites, not parallel processes.
The next major ASX story will hit our subscribers first
The Processing Flowsheet: Why POX Defines Both Recovery and Cost
Understanding Refractory Mineralisation and Why It Matters
The fundamental metallurgical challenge at Hycroft is that the majority of gold and silver is locked within sulfide mineral matrices, primarily pyrite and arsenopyrite. Conventional cyanide heap leaching, which is far less capital intensive than milling, cannot liberate these metals at commercially viable recovery rates because the cyanide solution cannot access the encapsulated precious metal particles without first destroying the sulfide host.
Pressure oxidation (POX) resolves this problem through a high-temperature, high-pressure autoclave process. Crushed and milled sulfide ore is combined with water and oxygen under pressures typically exceeding 2,000 kilopascals and temperatures around 190 to 230 degrees Celsius. Under these conditions, the sulfide minerals oxidise rapidly, exposing the gold and silver to subsequent cyanide leaching. The chemistry is well-established at commercial scale, with operating POX facilities in Nevada at Barrick's Goldstrike operation and Newmont's Twin Creeks providing regional technical precedent.
Recovery Rates and Processing Circuit Design
The TRS evaluates a combined processing operation throughput of 57,100 tons per day, incorporating both heap leach and POX milling circuits. Recovery performance differs materially between the two circuits:
| Processing Circuit | Gold Recovery | Silver Recovery |
|---|---|---|
| POX Milling | 82.8% | 77.5% |
| Heap Leach | 40.0% | 12.0% |
The full POX flowsheet moves material through crushing, ball milling, flotation concentration, pressure oxidation, cyanide leach, and Merrill-Crowe precipitation, each stage adding operating cost but also adding recovery. The relatively low heap leach silver recovery of 12.0% reflects the characteristic challenge of leaching silver from oxidised material at scale, where reagent contact efficiency and solution management become limiting factors.
Cost Competitiveness: Where Hycroft Sits Against Global Benchmarks
AISC Analysis in a Global Precious Metals Context
Life-of-mine cash costs are estimated at $1,924 per ounce of gold equivalent (AuEq), with all-in sustaining costs (AISC) at $2,147 per ounce of AuEq. The strip ratio of 1.55 waste tons per ore ton is favourable for an open pit of this scale and reflects the broad, low-dip geometry of the mineralised envelope, a structural characteristic that allows bulk mining with relatively limited waste movement per unit of ore.
At $2,147 per ounce AuEq AISC, Hycroft's cost profile sits above the global median for operating gold mines, which has historically ranged between $1,200 and $1,500 per ounce depending on the cycle and methodology. The premium cost structure reflects the capital intensity of POX processing: energy consumption in autoclave circuits is substantially higher than heap leach operations, and reagent costs, particularly lime for pH control and oxygen for the autoclave circuit, add meaningful per-ounce operating cost. This is not a design flaw but an inherent feature of refractory deposit economics.
The implication for investors is straightforward: Hycroft's economic viability is structurally more dependent on elevated metal price floors than a conventional oxide operation. At gold prices below $2,000 per ounce and silver below $20 per ounce, the project's cost structure would compress margins significantly. At current precious metals prices, however, the margin buffer is substantial, though it remains price-dependent rather than cost-structural.
Brimstone and Vortex: The Upside That Isn't in the Numbers
Two High-Grade Silver Systems Absent From the Base Case
In 2023, Hycroft announced the identification of two distinct high-grade silver mineralisation systems, designated Brimstone and Vortex. Neither discovery has been incorporated into the current TRS mine plan, the economic analysis, or the NPV calculations. The $4.3 billion base case NPV and the $10.0 billion spot price NPV are derived entirely from the 2026 Measured and Indicated resource, which predates the full characterisation of these targets.
As of the TRS filing date, four core drill rigs are actively operating across both targets. The significance for investors is additive: any successful resource conversion at Brimstone or Vortex represents incremental NPV upside beyond the figures already published, not a reconfiguration of existing economics. Careful drilling results interpretation from these active programmes will consequently be a key near-term catalyst to monitor.
The company is also evaluating an underground mining component that could complement the open pit operation, alongside an accelerated access strategy designed to bring higher-grade ounces into earlier years of the mine plan. Earlier access to high-grade material would improve the project's NPV by pulling forward cash flows that would otherwise be discounted over a longer period, a meaningful structural improvement to the economics independent of metal price movements.
Catalyst Identification: Among all near-term variables capable of driving a resource-level re-rating independent of commodity price movements, Brimstone and Vortex drill results carry the most immediate potential. A material resource estimate upgrade at either target would expand the mine plan inventory, potentially improve the financing case, and provide a fresh catalyst for market revaluation.
Permitting: Navigating the BLM Review Process
Existing Regulatory Foundation and New Requirements
Hycroft operates under an existing Bureau of Land Management Plan of Operations, with prior Records of Decision issued in 2012 and 2014. The revised TRS mine plan introduces new surface disturbance elements, primarily the Northeast tailings management facility and expanded waste rock storage, that require amendments to the existing Plan of Operations.
These amendments will trigger a federal environmental review under the National Environmental Policy Act (NEPA), which proceeds through one of two pathways: an Environmental Assessment (EA), which is the less intensive option, or a full Environmental Impact Statement (EIS), which involves a more extensive public comment process and agency review timeline. The determination of which pathway applies typically depends on the scale of new disturbance and the complexity of potential environmental impacts. No target permitting timeline has been publicly disclosed.
| Permitting Element | Status |
|---|---|
| Existing BLM Plan of Operations | Active |
| Prior Records of Decision | 2012 and 2014 |
| POO Revision Required | Yes |
| EA or EIS Determination | Pending |
| Target Permitting Timeline | Not disclosed |
| Primary Royalty Obligation | 1.5% NSR (Sprott) |
Nevada's established permitting infrastructure provides a jurisdictional advantage over many international alternatives. The state's mining regulatory agencies have decades of experience processing large-scale open pit applications, and the existence of prior RODs provides a regulatory foundation that a genuine greenfield project would lack. Furthermore, the current regulatory environment around mining permits at a federal level may also shape the timeline and character of the BLM review process. The 1.5% net smelter return royalty held by Sprott represents the primary royalty obligation across the mine life, a relatively modest imposition given the project's scale.
The Staged Development Pathway: Five Sequential Prerequisites
The distance between a published TRS and a funded mine construction decision is not a single milestone. It is a structured sequence of prerequisites, each requiring time, capital expenditure, and successful execution before the next can begin:
- Reserve Declaration – Converting Measured and Indicated resources to Proven and Probable reserves through formal reserve estimation under S-K 1300 standards. This requires a higher level of geological confidence, economic demonstration, and legal entitlement analysis than the current resource classification provides.
- Pre-Feasibility or Feasibility Study – Advancing the project to a study level that supports a construction decision and provides the bankable economic model required by project debt providers. Capital cost accuracy must improve from Initial Assessment levels to within 15 to 25 percent.
- Environmental Permitting – Completing the BLM Plan of Operations revision process, including NEPA review, public comment periods, and obtaining all required federal and state approvals for new surface disturbance.
- Project Financing Arrangement – Structuring and securing the capital package required to fund the $2.4 billion initial capital estimate, across whatever combination of debt, streaming, joint venture, and equity instruments the company ultimately pursues.
- Construction Decision – A formal board-level commitment to proceed, supported by declared reserves, a bankable study, completed permitting, and a fully committed capital structure.
These five stages are largely sequential rather than fully parallel. Investors modelling a construction timeline should therefore treat each as a distinct milestone with its own probability-weighted timeline.
Frequently Asked Questions: Hycroft Mining TRS Initial Assessment
What exactly separates an S-K 1300 Initial Assessment from a feasibility study?
An Initial Assessment under S-K 1300 is a preliminary technical and economic evaluation indicating that a mineral resource has economic potential under a defined set of price and cost assumptions. It does not establish economic viability at a bankable standard, it does not convert resources to reserves, and it does not provide the technical foundation for a construction decision. A feasibility study involves declared reserves, detailed engineering to within 15 to 25 percent capital cost accuracy, and a level of economic confidence that satisfies institutional project finance requirements.
Why does Hycroft carry such a disproportionately large silver endowment relative to gold?
The deposit's volcanic hydrothermal origin, combined with the broad, laterally extensive geometry of the mineralised envelope, creates conditions that are particularly efficient at accumulating silver at scale. The resulting Measured and Indicated silver resource of 562.6 million ounces against 16.4 million ounces of gold reflects this geological characteristic, producing a silver-to-gold ratio approximately three to four times higher than the global average across producing mines.
What makes pressure oxidation necessary rather than simply heap leaching all the ore?
The majority of Hycroft's mineralisation is refractory, meaning gold and silver particles are physically encapsulated within sulfide minerals such as pyrite. Conventional cyanide solutions applied through heap leaching cannot penetrate the sulfide matrix to dissolve the precious metals at acceptable recovery rates. Pressure oxidation destroys the sulfide host minerals in a high-temperature, high-pressure autoclave environment, physically exposing the gold and silver to subsequent cyanide leaching and enabling the recovery rates reflected in the TRS.
Are the Brimstone and Vortex discoveries factored into any of the published NPV figures?
No. Both Brimstone and Vortex are entirely excluded from the TRS mine plan and all associated economic calculations. Any future resource definition at these targets would represent incremental upside to the published base case and spot price NPV figures, not a redistribution of existing value within the current model. You can review the full technical report summary directly for the complete resource and economic data underpinning the 2026 assessment.
Synthesising the Risk-Reward Framework
Four Variables That Will Determine the Timeline to Value Realisation
The Hycroft Mining TRS initial assessment establishes a compelling economic argument at current metal prices. A spot price post-tax NPV of $10.0 billion, anchored to 16.4 million ounces of gold and 562.6 million ounces of silver in Measured and Indicated resources, positions this as one of the most price-leveraged undeveloped precious metals projects in the United States. The silver sensitivity of $460 million per $5 per ounce move provides investors with a quantifiable framework for scenario analysis across multiple commodity price environments. For a detailed market reaction to these figures, the initial assessment announcement coverage provides further context on how analysts have interpreted the NPV spread.
The execution risk is equally clear. A $2.4 billion initial capital requirement with no disclosed financing pathway, no declared mineral reserves, an unscheduled federal permitting process, and a multi-year feasibility study requirement collectively define the gap between published economics and development reality. Four variables will consequently determine how quickly that gap closes:
- Brimstone and Vortex drill results from the active four-rig programme, representing the most immediate catalyst for a resource-driven re-rating independent of metal prices.
- Reserve conversion progress, which is the technical prerequisite for advancing to a bankable feasibility study and the primary driver of project financing eligibility.
- BLM permitting trajectory, particularly the EA versus EIS determination, which will define the regulatory timeline and its interaction with the financing process.
- Capital markets conditions and strategic interest from potential financing partners, streaming companies, or joint venture counterparties who may engage as reserve conversion and permitting progress advances.
Investor Perspective: The Hycroft story is not binary. It is a staged sequence of de-risking events, each incrementally closing the gap between a world-scale resource and a funded mine. Investors who understand which stage the project currently occupies, and what specific milestones would advance it to the next, are better positioned to assess the risk-adjusted value of the current investment case.
This article is intended for informational purposes only and does not constitute financial or investment advice. All economic figures, NPV calculations, and operational metrics referenced are drawn from the company's Technical Report Summary filed with the SEC on June 2, 2026. Future performance of the project, metal prices, and development timelines are inherently uncertain and subject to material change. Investors should conduct their own due diligence and consult a qualified financial adviser before making investment decisions.
Want to Catch the Next Major Precious Metals Discovery the Moment It Hits the ASX?
Discovery Alert's proprietary Discovery IQ model scans ASX announcements in real time, instantly identifying high-potential mineral discoveries across gold, silver, and more than 30 other commodities — turning complex data into clear, actionable opportunities for investors at every experience level. Explore historic discoveries and the returns they generated, then start your 14-day free trial to ensure you're positioned ahead of the broader market.