June 19, 2026
When the World's Most Critical Waterway Goes Dark
Energy markets operate on the assumption that certain physical arteries will remain open. Pipelines, shipping lanes, and transit chokepoints are rarely factored into risk models as potential total-loss scenarios. They are treated as infrastructure certainties rather than vulnerabilities. The 2026 Middle East conflict has shattered that assumption entirely, forcing energy analysts, policymakers, and market participants to confront what happens when the most consequential oil transit corridor in human history is effectively removed from the global supply equation.
The scale of what the International Energy Agency has documented in its May 2026 Oil Market Report goes beyond a typical supply disruption. Understanding the IEA oil market deficit amid Mideast disruption requires examining not just the headline figures, but the cascading mechanisms that connect a chokepoint closure in the Persian Gulf to refinery shutdowns in East Asia, fuel cost spirals in European aviation, and monetary policy dilemmas in emerging market capitals across three continents. Furthermore, current crude oil price trends indicate that these dynamics are reshaping long-held assumptions about global energy security.
When big ASX news breaks, our subscribers know first
The Strait of Hormuz: Anatomy of a Chokepoint Failure
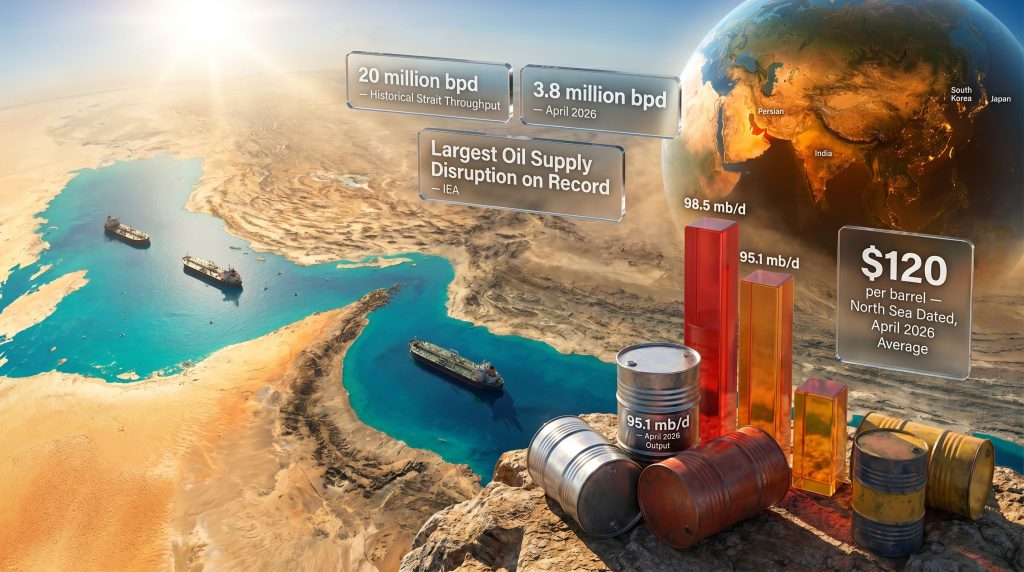
Few geographic features carry as much economic weight per square kilometre as the Strait of Hormuz. At its narrowest point, the Strait spans roughly 33 kilometres of navigable water, yet this corridor historically handled the transit of more than 20 million barrels of crude oil per day, accounting for approximately one-fifth of global petroleum consumption. No pipeline system, no overland route, and no combination of alternative maritime corridors comes close to replicating that throughput capacity.
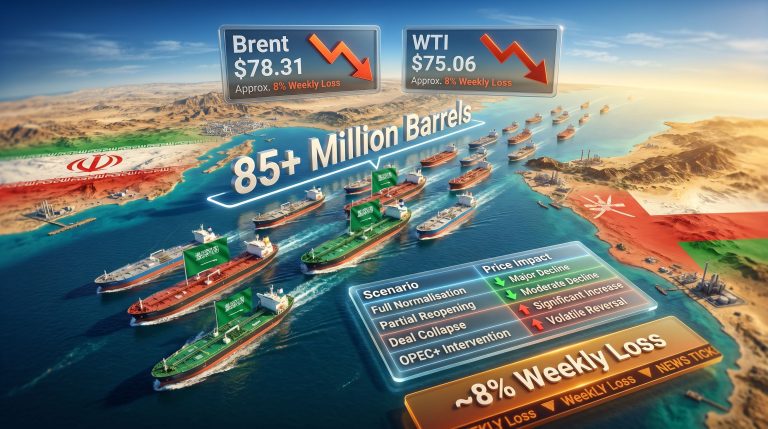
When conflict-related disruptions began restricting Strait access in early 2026, the consequences were immediate and structural. By early April, throughput through the waterway had collapsed to approximately 3.8 million barrels per day, representing an effective utilisation rate of less than 20% of pre-crisis levels. This was not a seasonal fluctuation, a temporary maintenance shutdown, or a brief market disruption. It was the functional closure of the world's most important single-point energy transit node.
The nations most dependent on Strait access for export revenue include several of the world's largest producers. Saudi Arabia, Iraq, Kuwait, the UAE, Qatar, and Iran all route the vast majority of their crude exports and LNG shipments through this corridor. While Saudi Arabia operates the East-West Pipeline connecting its Eastern Province fields to the Red Sea port of Yanbu, and the UAE has developed the Habshan-Fujairah pipeline providing an Indian Ocean bypass route, neither alternative can absorb anything close to the volumes previously handled by the Strait.
Aggregate bypass capacity across all alternative infrastructure covers only a fraction of pre-disruption Strait throughput, meaning the gap between physical supply availability and global demand requirements became, almost overnight, the defining variable in global energy markets. Broad oil geopolitics analysis confirms that this level of chokepoint vulnerability had long been anticipated but never adequately addressed at a policy level.
"The closure of the Strait of Hormuz is not analogous to a refinery fire or a production field outage. Those disruptions remove a source of supply. A chokepoint closure removes the mechanism by which supply reaches consumers, which is a fundamentally different and more intractable problem."
Supply Destruction at a Scale the IEA Has Never Previously Recorded
The quantitative dimensions of the 2026 supply shock are, by any historical measure, extraordinary. According to the IEA's May Oil Market Report, global oil output fell by 1.8 million barrels per day in April alone, bringing total production to 95.1 mb/d. The cumulative losses recorded across February, March, and April 2026 reached 12.8 million barrels per day, a figure the agency characterises as the largest oil supply disruption in its recorded history.
To contextualise the magnitude, consider the comparison table below:
| Disruption Event | Approximate Supply Loss | Duration | Primary Mechanism |
|---|---|---|---|
| 1973 Arab Oil Embargo | ~5 mb/d | ~6 months | Political export embargo |
| 1990 Gulf War (Kuwait) | ~4–4.5 mb/d | ~3 months | Field damage and occupation |
| 2003 Iraq War | ~2.3 mb/d | Weeks to months | Field shutdown |
| 2011 Libyan Civil War | ~1.4 mb/d | Several months | Infrastructure damage |
| 2020 COVID Pandemic | ~20 mb/d (demand-led) | ~3 months | Demand collapse, not supply failure |
| 2026 Hormuz Disruption | 12.8 mb/d cumulative | Ongoing | Chokepoint closure and infrastructure damage |
The 2026 event differs from each historical precedent in a critical way. Prior disruptions involved either demand destruction events masking supply, or supply reductions from specific producing nations. The 2026 disruption combines infrastructure damage, chokepoint restriction, and simultaneous economic deterioration into a single compounding event.
OPEC+ output data underscores the severity. The group's collective March production fell to 42.4 mb/d, a decline of 9.4 mb/d from the prior month, as Gulf member nations were directly impacted by conflict-related operational constraints. This was not a voluntary production management decision. It was involuntary capacity loss at a scale that overwhelmed any compensatory response from Atlantic Basin producers.
OPEC's market influence, which typically functions as a stabilising mechanism through coordinated output adjustments, has consequently been rendered ineffective when the core problem is physical infrastructure access rather than production policy. Assuming a partial reopening of the Strait from June 2026, the IEA projects that full-year global supply will average 3.9 mb/d below pre-crisis forecast levels. Under a scenario where the Strait remains restricted beyond June, this figure would be considerably worse.
Demand Destruction: Why Falling Consumption Does Not Solve the Problem
A counterintuitive feature of severe supply shocks is that they generate their own demand destruction. When crude prices spike sharply and product availability tightens, consumers reduce consumption, industries throttle back production, and economic activity contracts. In theory, this should partly close the supply-demand gap. In practice, the 2026 data reveals why demand destruction is an inadequate corrective mechanism.
The IEA projects global oil demand to contract by 420,000 barrels per day year-on-year in 2026, reaching approximately 104 mb/d for the full year. This would represent a reversal from earlier forecasts that anticipated growth of roughly 640,000 bpd, an effective swing of more than a million barrels per day in demand expectations.
| Demand Metric | Earlier 2026 Forecast | Revised May 2026 Forecast |
|---|---|---|
| Year-on-year change | +640,000 bpd growth | -420,000 bpd contraction |
| Full-year level | ~104.5 mb/d | ~104 mb/d |
| Q2 2026 quarterly change | Growth expected | -1.5 mb/d (sharpest since pandemic) |
| Regions contracting | Partial | Both OECD and non-OECD |
The sectors absorbing the heaviest demand losses include:
- Petrochemicals: naphtha and LPG price spikes have compressed feedstock economics, forcing production curtailments across plastics and chemical manufacturing
- Aviation: elevated jet fuel costs are squeezing airline operating margins and reducing scheduled capacity
- Heavy industry: energy-intensive industrial processes across Asia-Pacific and European markets have reduced output in response to higher input costs
- Consumer transport: elevated retail fuel prices are moderating vehicle fuel consumption across price-sensitive markets
The critical analytical point is this: a 420,000 bpd demand contraction does not begin to offset a 12.8 mb/d cumulative supply loss. The demand destruction dampens price escalation marginally and reduces the rate of inventory depletion slightly, but it cannot bridge a physical supply gap of this magnitude. However, what it does accomplish is introduce additional economic damage, as production curtailments and consumption reductions translate directly into lower GDP growth, higher unemployment, and reduced government revenues across energy-importing economies.
"When both supply and demand are contracting simultaneously, the headline deficit figures may appear less severe than the physical reality. The demand reduction masks just how tight actual crude availability has become in specific regional markets."
Inventory Drawdowns: The Speed and Duration of Buffer Depletion
Global strategic and commercial oil inventories serve as the primary buffer mechanism during supply disruptions. They absorb the gap between what producers can deliver and what consumers require, buying time for supply chains to adjust, alternative sources to ramp up, and diplomatic resolutions to take hold. The pace at which these buffers are being consumed in 2026 has no precedent outside the pandemic period.
According to IEA data, global observed oil stocks fell by 85 million barrels in March 2026, followed by drawdowns of 129 million barrels and 117 million barrels in successive months. These figures span commercial onshore inventories, floating storage, and to a lesser extent strategic petroleum reserves held by IEA member governments.
What Limits the Effectiveness of Strategic Reserve Releases?
Several structural limitations constrain the effectiveness of SPR releases as a remedy:
- Volume ceilings: Total SPR capacity across IEA member nations is finite. Continuous drawdown at the rates implied by current consumption gaps would exhaust meaningful buffer capacity within months.
- Logistics constraints: Releasing crude from strategic reserves requires transportation, refinery processing, and distribution infrastructure, all of which take time and add cost.
- Refinery feedstock compatibility: Strategic reserves often hold crude grades that do not match the configuration of refineries urgently requiring supply substitutions.
- Political coordination delays: Coordinated SPR releases across multiple nations require intergovernmental agreement, which historically takes weeks to negotiate and implement.
The refinery sector has responded to supply constraints through throughput reductions rather than feedstock substitution. Middle Eastern and Asian processing facilities cut crude runs by approximately 6 million barrels per day in April 2026. The IEA projects Q2 2026 global refinery run cuts of 4.5 mb/d, the sharpest quarterly reduction since the pandemic, with the full-year average decline reaching 1 to 1.6 mb/d.
An important and somewhat counterintuitive feature of this environment is what industry participants refer to as the refining margin paradox. Despite running significantly lower volumes of crude, refiners in regions with continued feedstock access are capturing elevated margins on the products they do process. Middle distillate products, particularly diesel and gasoil, remain in strong demand from logistics and heating sectors even as overall consumption contracts.
India's experience illustrates the adaptive behaviour occurring across the refinery sector. Shipping data reported by Zawya indicates that Indian processors have pivoted toward Omani naphtha as a feedstock substitute following supply disruptions from traditional sources, reflecting a broader pattern of refinery operators sourcing from non-Strait-dependent origins wherever possible, even at premium cost.
Price Behaviour Under Geopolitical Shock: $120 Crude and What It Signals
North Sea Dated crude averaged approximately $120 per barrel in April 2026, operating within what the IEA describes as an unusually wide intra-month trading range. The $120 average, however, tells only part of the story. In a functioning market, price levels reflect supply-demand balances. In a disrupted market, price volatility reveals the degree of underlying dysfunction.
Wide intraday and intramonth price ranges indicate that traders cannot accurately price physical availability, that risk premiums are being applied inconsistently, and that forward curves lack the stability required for industrial hedging. Airlines, shipping companies, and petrochemical producers depend on forward price visibility to manage input costs. When volatility is extreme, hedging becomes expensive and unreliable, which in turn discourages the capital investment needed to expand supply alternatives.
What Is Driving Price Volatility at This Level?
The $120 average also reflects the superposition of multiple competing price forces:
- Physical scarcity premium: representing the genuine tightness in crude availability
- Geopolitical risk premium: reflecting uncertainty about the duration and escalation trajectory of the conflict
- Speculative positioning: financial market participants adding length or expressing directional views
- Demand destruction discount: partially offsetting the above as consumption contracts
These forces do not move uniformly, which is precisely why volatility has been so elevated. On days when diplomatic signals suggest potential Strait reopening, demand destruction discounts overwhelm scarcity premiums and prices fall sharply. On days when military escalation fears intensify, the reverse occurs. The $120 average obscures a trading range that has likely extended well above and below that figure within single weeks. Understanding these oil volatility trends is essential for any market participant attempting to navigate forward planning in this environment.
The next major ASX story will hit our subscribers first
Regional Vulnerability: Who Carries the Greatest Exposure?
The economic burden of the IEA oil market deficit amid Mideast disruption is not distributed evenly. Geography, refinery configuration, trade dependency, and fiscal capacity all determine which nations and sectors absorb the heaviest losses.
Asia-Pacific importing nations carry the highest structural exposure. Japan, South Korea, India, and China collectively represent the largest volume of Gulf crude imports globally. Their refinery systems have been optimised over decades for the specific quality characteristics of Middle Eastern crude, which tends toward heavier, higher-sulphur grades. Atlantic Basin alternatives, predominantly light sweet crude from the United States, Brazil, and Norway, require different processing configurations to yield equivalent product slates.
European refiners face a different but equally challenging set of pressures. Feedstock rerouting from non-Gulf sources adds weeks to delivery schedules and raises procurement costs. Competition for middle distillate products has intensified as supply from traditional Eastern sources tightens, pushing gasoil and diesel crack spreads to elevated levels.
The petrochemical sector globally faces a particularly acute feedstock problem. Naphtha and LPG, the primary building blocks for plastics, resins, and chemical intermediates, are predominantly sourced from Middle Eastern gas processing operations. Price spikes in these feedstocks compress margins across the entire plastics and chemicals manufacturing supply chain, with downstream effects on packaging, construction materials, and consumer goods production.
Aviation confronts jet fuel scarcity compounded by price escalation. The sector was only recently emerging from post-pandemic recovery trajectories when the 2026 disruption struck. Elevated kerosene prices directly compress airline operating margins and, in the absence of adequate hedging coverage, force capacity reductions or fare increases that further suppress travel demand.
The secondary transmission channels extend well beyond direct energy exposure. Energy import cost inflation feeds into broader consumer price indices across importing economies, creating inflationary pressure that central banks must weigh against the simultaneous economic slowdown driven by the same supply shock. This monetary policy dilemma, tightening to contain inflation whilst the economy is already contracting due to an energy shock, is among the most challenging positions for economic policymakers to navigate.
Can Atlantic Basin Producers Fill the Gap?
The supply response from non-Middle East producers has been real but structurally limited. US shale operators, Norwegian Continental Shelf platforms, and Brazilian deepwater fields have increased output to capture the elevated price environment. However, several factors prevent this production growth from substituting for lost Gulf volumes in any meaningful near-term sense.
Crude quality mismatch is the most fundamental constraint. Gulf producers export primarily medium-sour to heavy-sour grades, characterised by higher sulphur content and greater density. US shale production, by contrast, is predominantly light and sweet. Asian and European refineries built around Middle Eastern crude specifications require physical hardware modifications to process Atlantic Basin light grades efficiently. These are not software updates. They are multi-year capital investment programmes.
Logistics and lead times compound the quality problem. Rerouting crude supply from the US Gulf Coast or Brazilian offshore fields to Japanese or South Korean refineries adds two to four weeks to delivery schedules compared to Gulf shipments, increases freight costs materially, and absorbs significant tanker capacity already stretched by the rerouting of existing trade flows.
Surge capacity limitations also constrain the response. US shale production operates with shorter lead times than conventional fields, but rig counts, completion crews, and pipeline infrastructure all have finite expansion rates. Producing meaningfully more crude within a three-to-six-month window requires pre-positioned resources that the market did not anticipate needing. These oil market disruptions are consequently proving far more difficult to offset than initial market commentary suggested.
Three Scenarios for the Remainder of 2026
| Scenario | Hormuz Status | Supply Recovery | Price Trajectory |
|---|---|---|---|
| Base Case | Partial reopening from June | Gradual, below pre-crisis levels | Elevated, slowly declining from $120+ |
| Optimistic | Full reopening by Q3 | Rapid recovery toward 98 mb/d | Normalisation toward $90-100/bbl |
| Pessimistic | Continued restriction into H2 | Sustained 3-4 mb/d deficit | Prices above $130/bbl; recession risk escalates |
Under the base case, the market remains in deficit through late 2026. Even partial Strait reopening does not immediately restore production to pre-crisis levels. Wells that have been shut in, infrastructure that has sustained damage, and tanker routing disruptions all take time to normalise. The IEA's full-year projection of a 3.9 mb/d average supply shortfall already embeds this graduated recovery assumption.
Under the pessimistic scenario, sustained restrictions would push observable inventory levels toward critically low thresholds in major consuming nations, potentially triggering emergency rationing mechanisms and further economic contraction in the most exposed economies. Recession risk in energy-intensive economies would escalate materially above current baseline projections. The IEA's energy market outlook for the Middle East provides further context on the structural forces underpinning these scenarios.
Structural Lessons: What the 2026 Crisis Reveals About Energy Security Architecture
Beyond the immediate market dynamics, the 2026 disruption is forcing a fundamental reassessment of how importing nations think about energy security architecture. Several structural vulnerabilities, long acknowledged in academic and policy literature but rarely translated into tangible action, have been exposed simultaneously.
Single-point chokepoint dependency is the most obvious. Decades of cost optimisation in global energy logistics concentrated an extraordinary share of global oil trade through a 33-kilometre waterway. The economic logic was sound under stable geopolitical conditions. Under disrupted conditions, it created a systemic vulnerability with no adequate short-term remedy.
SPR coordination mechanisms have proven to be a time-limited buffer rather than a crisis resolution tool. Coordinated releases from IEA member nation reserves can temporarily reduce the rate of inventory depletion, but they cannot restore the physical supply volumes lost when a major producing region is cut off from export markets.
The OPEC+ coordination framework has also revealed a structural limitation that is rarely discussed. The group's production management mechanisms assume that member nations have operational access to export infrastructure. When that infrastructure is physically compromised or access routes are closed, the framework cannot function as a market stabilisation mechanism regardless of collective production decisions. The March OPEC+ output figure of 42.4 mb/d reflects not a policy choice but an operational reality.
Looking further ahead, the 2026 crisis is accelerating investment discussions around bypass pipeline infrastructure, expanded LNG liquefaction capacity on non-Gulf coastlines, and diversified crude procurement strategies across the most exposed importing nations. These investments take years to complete and cannot address the current deficit. Their long-term effect, however, may be to structurally reduce the leverage that any single chokepoint can exert over the global economy.
Key Takeaways: The IEA Oil Market Deficit at a Glance
- Global oil supply fell by 1.8 mb/d in April alone, reaching 95.1 mb/d, with 12.8 mb/d in cumulative losses since February
- The Strait of Hormuz, which historically carried over 20 mb/d, saw throughput collapse to approximately 3.8 mb/d in early April
- Full-year 2026 global supply is projected to average 3.9 mb/d below pre-crisis levels, assuming partial Strait reopening from June
- Global demand is forecast to contract by 420,000 bpd year-on-year, reaching approximately 104 mb/d, a complete reversal from earlier growth forecasts
- Q2 2026 refinery throughput cuts of 4.5 mb/d represent the sharpest quarterly reduction outside the pandemic era
- Global inventories fell by 129 million barrels in March and a further 117 million barrels in April, drawing down buffers at an unprecedented pace
- North Sea Dated crude averaged approximately $120 per barrel in April, with extreme intramonth volatility reflecting deep market dysfunction
- The IEA oil market deficit amid Mideast disruption is expected to persist through late 2026, with ongoing price volatility and inventory pressure likely, as confirmed by IEA forecasts on the crisis
This article is based on data published in the IEA May 2026 Oil Market Report as reported by TradeArabia via Zawya. All forecasts and projections are subject to change as geopolitical and market conditions evolve. Nothing in this article constitutes financial or investment advice. Readers should consult qualified professionals before making investment decisions based on energy market conditions.
Want to Identify ASX Opportunities Emerging From Global Energy Market Disruptions?
Discovery Alert's proprietary Discovery IQ model delivers real-time alerts on significant ASX mineral discoveries, instantly translating complex market data into actionable investment insights — whether you're a short-term trader or a long-term investor seeking to capitalise on shifting commodity dynamics. Explore how historic mineral discoveries have generated substantial returns on Discovery Alert's dedicated discoveries page, and begin your 14-day free trial today to secure a market-leading advantage.