July 31, 2026
Breaking a Two-Year Plateau: How Implats' FY2026 Refined Output Signals a Structural Shift in PGM Production
The platinum group metals sector operates within a complex web of geological constraints, currency dynamics, and global demand cycles that rarely move in the same direction simultaneously. When they do align, the results can be transformative for producers. Implats full-year refined output and sales data for the financial year ended June 30, 2026, represents precisely such a convergence, where operational improvements, processing efficiency, and an exceptionally favourable pricing environment combined to deliver results that meaningfully diverged from the prior two years of near-stagnant output.
When big ASX news breaks, our subscribers know first
Understanding the 6E Basket: What the Metric Actually Measures
Before examining production trajectories, it is worth clarifying what the 6E designation actually represents in PGM reporting. The term refers to six metals measured collectively across a producer's output: platinum, palladium, rhodium, ruthenium, iridium, and gold. This composite metric is used industry-wide to capture total precious metal production in a single comparable figure, regardless of the varying proportions of each metal recovered from different ore bodies.
This distinction matters for investors because the 6E basket price fluctuates based on the relative weighting of each component. Rhodium, for example, has historically contributed outsized value despite representing a small share of total ounces, while palladium has experienced dramatic price cycles tied to automotive catalytic converter demand. Furthermore, understanding platinum and palladium market dynamics is essential context when interpreting these basket price movements. Gold, though included, is a minor contributor at most South African PGM operations.
When the industry references 6E revenue per ounce, it is effectively measuring the blended value of this basket, making it highly sensitive to individual metal price movements within the composite.
A Three-Year Production Arc: From Plateau to Recovery
The strategic significance of Implats' FY2026 performance only becomes apparent when viewed against the preceding two financial years. The table below illustrates the production trajectory that makes FY2026 notable:
| Financial Year | Gross Refined 6E Production | 6E Sales Volumes |
|---|---|---|
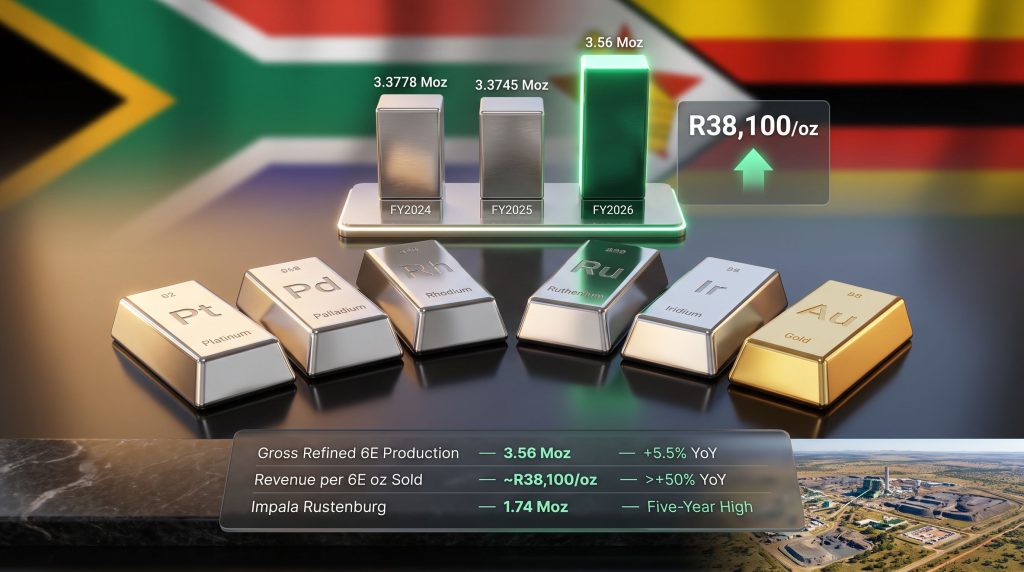
| FY2024 | 3.3778 million oz | ~3.37 million oz |
| FY2025 | 3.3745 million oz | ~3.37 million oz |
| FY2026 | 3.56 million oz | 3.51 million oz |
What this data reveals is not simply a year-on-year improvement but the breaking of a production ceiling that had effectively held for two consecutive years. FY2024 and FY2025 produced virtually identical refined output, a pattern that typically signals structural constraints rather than temporary disruption. The 5.5% year-on-year increase in gross refined 6E production to 3.56 million ounces in FY2026 therefore carries more weight than the percentage alone implies.
A critical technical observation here is the divergence between concentrate production growth and refined output growth. Concentrate volumes rose marginally from 3.48 million ounces in FY2025 to 3.5 million ounces in FY2026, a gain of roughly 0.6%. Yet gross refined output expanded by 5.5% over the same period. This gap points directly to processing efficiency gains within the South African smelting and refining infrastructure, rather than purely mine-volume-driven improvement. In other words, more value was extracted from the ore already in the system.
Why Did Production Stall for Two Consecutive Years?
PGM supply constraints across the South African mining sector played a significant role in this prolonged plateau. Broader South Africa mining trends — including electricity instability, rising input costs, and ageing shaft infrastructure — created structural headwinds that limited throughput improvements. Consequently, breaking through that ceiling in FY2026 represents a more meaningful achievement than a single-year percentage improvement might suggest.
Impala Rustenburg's Shaft-Level Recovery: The Styldrift Effect
Impala Rustenburg contributed 1.74 million ounces of 6E in FY2026, a 4% increase year-on-year, and the operational granularity behind this figure is instructive.
| Shaft Grouping | FY2026 Output | YoY Change | Key Driver |
|---|---|---|---|
| South and Central Shafts | Included in 1.74 Moz total | +3% | Operational continuity |
| North Shafts (incl. Styldrift) | 435,000 oz 6E | +6% | Styldrift ramp-up maturation |
| Total Rustenburg | 1.74 million oz 6E | +4% | Broad-based shaft improvement |
| Stock-Adjusted Volumes | 1.31 million oz 6E | Five-year high | Processing and inventory optimisation |
The 6% improvement in North Shaft saleable production is directly linked to Styldrift's sustained operational ramp-up. Styldrift is a deep-level platinum mine on the Bushveld Igneous Complex, the geological formation that hosts the majority of the world's known PGM reserves. Deep-level mining in this context involves accessing the Merensky Reef and UG2 reef horizons, which require significant upfront capital for shaft sinking, ventilation, and infrastructure before reaching steady-state production.
What Does Styldrift's Maturation Mean for Long-Term Output?
What the FY2026 North Shaft result suggests is that Styldrift has transitioned from a capital-intensive growth phase into a steady-state contributor. This is a meaningful shift in the asset's risk profile. During ramp-up phases, production is inherently variable and cost-per-ounce metrics are elevated due to fixed cost absorption over lower volumes.
As the operation matures, both unit economics and output predictability improve, providing a structurally higher production floor for Rustenburg overall. The stock-adjusted volume of 1.31 million ounces at a five-year high further reinforces that Rustenburg's output ceiling has been reset higher, not merely temporarily lifted. Platinum investment opportunities within the South African context are consequently being reappraised by analysts monitoring this operational shift.
Zimplats and Impala Canada: Diverging Asset Life-Cycle Positions
The Zimbabwe and Canadian operations tell two very different stories about where assets sit in their respective life cycles.
Zimplats delivered stable matte production of 606,300 oz of 6E while growing concentrate volumes by 5% year-on-year to 660,400 oz. The operation absorbed a scheduled furnace maintenance period during which approximately 24,000 oz of 6E concentrate inventory was accumulated rather than processed. The fact that concentrate volumes still grew by 5% despite this maintenance interruption points to genuine underlying operational momentum in both mined and milled volumes.
"The ability to grow concentrate output while absorbing a planned processing interruption is a meaningful indicator of operational buffer management at Zimplats. This type of inventory accumulation during maintenance windows is a deliberate strategy to smooth throughput, not a demand constraint."
Impala Canada, by contrast, recorded a 10% year-on-year decline in 6E concentrate volumes to 212,800 oz. This reduction was planned and disclosed in advance, consistent with the operation's position in its life-of-mine trajectory. It is important to distinguish between unplanned production shortfalls, which carry negative operational signals, and deliberate production tapering aligned with reserve depletion, which is a capital allocation decision. Impala Canada falls into the latter category.
| Operation | FY2026 6E Output | YoY Change | Context |
|---|---|---|---|
| Impala Rustenburg (SA) | 1.74 million oz | +4% | Five-year high in stock-adjusted volumes |
| Zimplats (Zimbabwe) | 606,300 oz matte / 660,400 oz concentrate | Stable / +5% | Furnace maintenance absorbed |
| Impala Canada | 212,800 oz concentrate | -10% | Planned operational tapering |
The Revenue Surge: Unpacking a 50%+ Increase in Rand PGM Pricing
Perhaps the most striking single metric in Implats full-year refined output and sales update is the more than 50% increase in sales revenue per 6E ounce sold, rising to approximately R38,100/oz. Understanding what drove this requires examining the interplay between dollar metal prices and the rand exchange rate. According to Implats' production report for the period ended March 2025, the foundation for this pricing uplift was being established well before year-end.
South African PGM producers operate within a natural currency hedge structure. Their revenues are generated in US dollars, based on the international pricing of platinum, palladium, rhodium, and associated metals, while their primary cost base is denominated in South African rand. When the rand depreciates against the dollar, rand-denominated revenues rise even if dollar metal prices hold flat.
In FY2026, rand appreciation provided only a marginal offset to pricing gains, meaning the rand did strengthen but not sufficiently to materially erode the dollar price tailwind. The primary driver of the revenue surge was broad-based appreciation in US dollar pricing for both precious and base metals. This is notable because base metals, including nickel and copper recovered as co-products in PGM processing, contributed to the basket price uplift alongside the precious metal components. The relationship between metal prices and mining equities in this environment has consequently attracted considerable investor attention.
"For investors, the FY2026 pricing outcome represents an unusually favourable combination. In most PGM cycles, either metal prices are strong but the rand strengthens enough to compress margins, or the rand weakens to support revenues while dollar prices soften. Having both factors align in the producer's favour simultaneously is historically uncommon and raises legitimate questions about sustainability into FY2027."
Working backwards from the disclosed figures, if FY2026 achieved approximately R38,100/oz and this represented a greater than 50% increase, the implied FY2025 revenue per ounce was in the range of R25,000 to R26,000/oz. The combination of 4% volume growth and 50%+ pricing uplift creates a compounding revenue effect whose full magnitude will only become apparent in the audited financial results scheduled for September 3, 2026.
The next major ASX story will hit our subscribers first
Processing Asset Performance: The Underappreciated Competitive Variable
One dimension of Implats full-year refined output and sales that warrants closer examination is the specific mention of South African processing assets delivering particularly strong performance. In PGM production, the value chain runs from underground mining through milling, flotation concentration, smelting, and finally base metals refining, with each stage representing both a cost centre and a potential throughput constraint.
The divergence between the marginal concentrate production growth of 0.6% and the 5.5% growth in gross refined output suggests that efficiency improvements were concentrated in the smelting and refining stages. This could reflect:
- Improved furnace availability and throughput rates at Rustenburg's smelting complex
- Better recovery of individual metals during the base metals refinery process
- Reduced in-process inventory or work-in-progress, converting previously held material into saleable ounces
- Optimisation of the toll refining arrangements that govern how third-party concentrate is processed through the group's infrastructure
This processing efficiency dynamic is less visible in headline production numbers but has direct implications for unit cost economics. When more refined ounces are produced from a similar concentrate input, the fixed cost of smelting and refining is spread across a larger output base, improving margin capture at the processing stage.
Safety Performance: Statistical Progress Against a Persistent Human Cost
The injury frequency rate improvements recorded in FY2026 represent genuine operational progress. The Lost-Time Injury Frequency Rate (LTIFR) improved 9% to 3.13, while the Total Injury Frequency Rate (TIFR) improved 17% to 6.72. These metrics are measured per million hours worked and serve as the primary quantitative benchmarks for workforce safety management in the South African mining regulatory framework.
However, four fatalities occurred at Implats' managed operations during FY2026. This reality sits alongside the statistical improvements and cannot be reconciled by frequency rate progress alone. The South African mining industry operates under the Mine Health and Safety Act, which imposes stringent obligations on producers and makes fatality reduction a primary regulatory and social licence requirement.
The gap between improving frequency metrics and the ongoing occurrence of fatalities reflects the persistent challenge of achieving zero-harm outcomes in deep-level mining environments where ground conditions, equipment interactions, and human factors create irreducible risk profiles. Peer comparisons against other major South African PGM producers will provide useful context when the full annual results are published, though the fatality data will appropriately feature in stakeholder engagement well before then.
Portfolio Rebalancing and FY2027 Outlook: Three Scenarios
The deliberate wind-down of Impala Canada's production rates creates a long-term portfolio rebalancing dynamic. As Canadian volumes taper, the group's production centre of gravity shifts further toward South Africa and Zimbabwe, concentrating jurisdictional exposure within the African operations. This has implications for cost structure, given South Africa's electricity and labour cost environment, as well as for ESG reporting frameworks that assess operational context differently across jurisdictions.
Looking forward, three broad scenarios frame the FY2027 outlook:
-
Bull Case: Dollar PGM prices remain at or near FY2026 levels, Rustenburg's operational improvements sustain the higher production run-rate, and Styldrift continues its steady-state contribution, delivering a second consecutive year of revenue expansion.
-
Base Case: Metal prices moderate from FY2026 peaks, but volume gains at Rustenburg and Zimplats partially offset pricing normalisation, maintaining revenues comfortably above FY2025 levels.
-
Bear Case: A meaningful rand strengthening coincides with a correction in dollar PGM prices, compressing the rand-per-ounce revenue metric back toward FY2025 levels despite operational volume gains holding.
The full audited results on September 3, 2026 will provide the detailed cost, margin, and cash flow data needed to assess which of these trajectories is most plausible. What the Implats full-year refined output and sales update has already confirmed is that FY2026 represented a genuine operational and commercial step-change from the FY2024 to FY2025 plateau, with both volume and pricing dynamics moving in the same direction for the first time in several years.
This article is intended for informational purposes only and does not constitute financial advice. Forward-looking statements regarding production, pricing, and revenue outcomes involve significant uncertainty and actual results may differ materially from those projected. Investors should conduct their own due diligence before making investment decisions.
Want to Track the Next Major PGM Discovery Before the Market Does?
Discovery Alert's proprietary Discovery IQ model scans ASX announcements in real time, instantly identifying significant mineral discoveries across platinum, palladium, and more than 30 other commodities — converting complex data into clear, actionable insights for investors at every level. Explore how historic discoveries have generated substantial returns on Discovery Alert's dedicated discoveries page, and begin your 14-day free trial today to position yourself ahead of the broader market.