
June 12, 2026
When Physical Markets Speak, Gold Prices Listen
Across global commodity markets, the most sophisticated price signals rarely originate from futures exchanges or algorithmic trading desks. They emerge from the ground-level behaviour of jewellers restocking inventory, bullion merchants adjusting their bid-ask spreads, and central banks quietly accumulating metal month after month. The physical gold markets of Asia, and India and China in particular, function as real-time barometers of demand health that frequently anticipate broader price movements before they register in the paper market. Understanding india gold demand and china premiums is therefore essential for any serious market participant.
Understanding this dynamic requires moving beyond spot price charts and into the granular mechanics of how physical gold is priced, distributed, and absorbed across the two most populous nations on Earth. When these two consumption giants begin pulling gold in from global supply chains, or stepping back from purchases, the implications ripple outward across every gold market on the planet.
When big ASX news breaks, our subscribers know first
Why the Premium/Discount Framework Is the Smartest Tool in Physical Gold Analysis
Most retail investors track gold through spot price movements quoted in US dollars. However, physical market participants use a more revealing metric: the premium or discount at which local dealers buy and sell gold relative to the international benchmark, after accounting for taxes, duties, and import costs.
In practice, this spread acts as a live sentiment indicator. When demand is strong and buyers are competing for available supply, premiums widen as merchants charge above the official price. When demand is sluggish and metal is sitting unsold, dealers cut prices below the official rate to move inventory, creating a discount. The magnitude and direction of these spreads tell analysts far more about genuine consumption appetite than any survey or forecast could.
"The premium/discount framework is one of the most reliable short-term indicators of physical demand health in Asian gold markets. A narrowing discount signals improving absorption; a widening discount signals excess supply or weak appetite."
India and China represent two structurally different expressions of this dynamic. India's market is characterised by high price sensitivity at the retail and jewellery level, with demand fluctuating meaningfully in response to domestic price movements. China's market, by contrast, combines retail consumption with institutionalised central bank gold demand, creating a more durable floor under physical absorption.
India Gold Demand and China Premiums: Reading the Current Market Snapshot
The week ending June 12, 2026 delivered a textbook illustration of how india gold demand and china premiums interact with global price trends. Spot gold touched an over six-month low of $4,022.29 before recovering, placing the market in a position where physical buyers in both nations were forced to reassess their positioning.
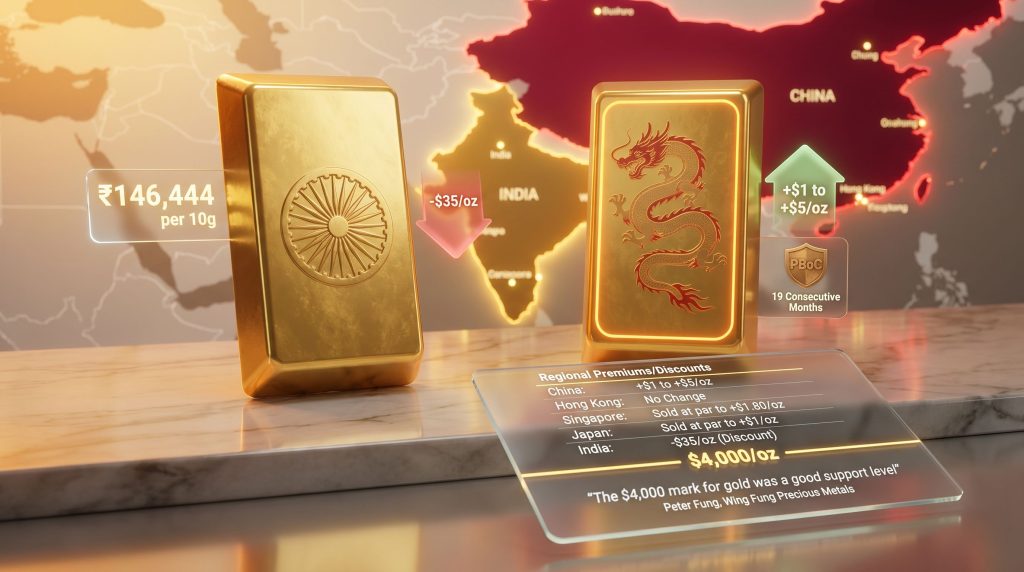
In India, domestic gold prices fell to 146,444 rupees per 10 grams, the lowest level since April 2, 2026, representing a weekly decline of approximately 1.5%. This correction immediately produced measurable demand responses.
Chanda Venkatesh, managing director at CapsGold, a Hyderabad-based bullion merchant, noted that demand improved as prices corrected, drawing jewellery purchasers back to the market following the recent decline in local prices.
The immediate quantitative evidence of this demand recovery was visible in the dealer discount structure. Discounts offered by Indian dealers narrowed dramatically from up to $87 per ounce the prior week to up to $35 per ounce over official domestic prices, inclusive of the 15% import duty and 3% sales levy. That 60% compression in discount levels within a single week is a powerful signal of returning buyer interest.
Meanwhile, a Mumbai-based bullion dealer with a private bank offered a more cautious interpretation, observing that whilst jewellers had begun restocking, purchases remained measured given that confidence in retail demand for coming months was still weak. This distinction matters enormously for understanding the quality of the demand recovery.
Two-Speed Recovery: Trade Restocking vs. Consumer Confidence
The current demand recovery in India is not uniform across all buyer segments. A clear divergence is emerging between trade-level restocking activity and genuine retail consumer confidence.
| Demand Segment | Current Status | Primary Driver |
|---|---|---|
| Jewellery Restocking | Cautiously improving | Price correction below recent highs |
| Retail Consumer Demand | Weak | Uncertainty around price trajectory |
| Investment/ETF Demand | Declining | Profit-taking after duty-driven price spike |
| Wedding Season Buying | Below seasonal norms | Elevated price levels versus prior years |
This two-speed dynamic is a recurring feature of Indian gold markets following policy-driven price shocks. Trade participants, who must maintain inventory to service ongoing orders, tend to restock opportunistically when prices correct. Retail consumers, however, respond more slowly as they require sustained confidence in price stability before committing to purchases, particularly for high-value items like wedding jewellery.
How India's 15% Import Tariff Restructured the Domestic Gold Market
To fully appreciate the current market conditions, it is essential to understand the policy shift that preceded them. India raised gold and silver import tariffs from 6% to 15% as part of a broader effort to reduce foreign exchange reserve pressure stemming from elevated global oil prices. Furthermore, gold and central banks play an increasingly interconnected role in shaping these policy decisions.
This tariff increase had several cascading effects on the domestic gold market:
- It created an immediate structural uplift in domestic gold prices, as the higher import cost was passed through to local market prices.
- The price increase dampened retail consumer demand, which had previously been building momentum.
- It triggered a wave of investor profit-booking among those who had accumulated gold-linked financial instruments before the tariff change.
- It widened the gap between Indian domestic prices and the international benchmark, making the premium/discount calculation more complex.
The most notable downstream consequence was the behaviour of India's physically-backed gold ETF market. These investment vehicles recorded their first net monthly outflow in over 12 months during May 2026, as domestic investors liquidated positions following the sharp price increase.
"Whilst higher import duties compress near-term demand by inflating local prices, India's structural relationship with gold, rooted in cultural, religious, and long-term savings behaviour, means demand suppression is typically temporary rather than permanent."
This historical pattern is important for investors interpreting current discount levels. The swing from a $6/oz premium during periods of strong demand to discounts as wide as $87/oz during weak periods illustrates the extraordinary range within which India's physical market can operate. A narrowing to $35/oz suggests the market is already moving back toward equilibrium following the tariff-driven disruption.
Why Indian Gold ETF Outflows Are Not a Structural Warning Signal
The ETF outflow deserves careful contextualisation. In most financial markets, a shift from net inflows to net outflows in a major asset class is interpreted as a bearish structural signal. In India's case, however, the interpretation is more nuanced.
Indian gold ETF investors tend to be relatively price-sensitive, particularly compared to their counterparts in Western markets where gold ETFs are more commonly used as long-duration portfolio hedges. The May 2026 outflows reflect profit realisation by investors who had accumulated positions at lower price levels before the duty increase inflated domestic prices. This is fundamentally different from a loss of long-term conviction in gold as an asset class.
The rupee dimension compounds this dynamic. A weaker rupee amplifies the impact of global gold price movements on Indian domestic prices, making gold more expensive in local currency terms even when international prices are flat or declining. Currency depreciation pressure, partly driven by elevated oil import costs, was itself a key factor behind the original decision to raise import duties, creating a policy feedback loop that continues to shape domestic gold pricing.
China's Gold Premiums: Structural Demand Meets Institutional Accumulation
China's physical gold market is operating from an entirely different structural foundation than India's, and the premium data from the week ending June 12, 2026 illustrates why. In addition, the broader gold safe-haven dynamics at play reinforce China's tendency to accumulate metal regardless of short-term price fluctuations.
Chinese bullion dealers quoted premiums of $1 to $5 per ounce over the international benchmark price, compressing from the prior week's range of $7 to $10 per ounce. The compression in premiums might initially appear bearish, but the critical detail is that premiums remained positive throughout the period. This means Chinese buyers were still willing to pay above the global benchmark to secure physical metal, a meaningful signal of continued absorption.
Peter Fung, head of dealing at Wing Fung Precious Metals, offered important context on the price level itself, noting that the $4,000 per ounce mark represented solid support and that fresh buying interest was visible at that level. This observation aligns with a well-documented pattern in Chinese gold consumption: dip-buying behaviour at key technical and psychological price levels.
The People's Bank of China: A 19-Month Accumulation Streak
Perhaps the most structurally significant data point in the current gold landscape is the People's Bank of China's continued reserve accumulation. The PBoC increased its official gold reserves for the 19th consecutive month in May 2026, according to its own published data. Consequently, this sustained institutional buying programme operates largely independently of short-term price movements.
Whilst retail gold demand in China responds to price signals in ways broadly similar to other markets, central bank accumulation reflects a longer-horizon strategic calculation focused on reserve diversification and reduced dependency on US dollar-denominated assets.
The dual-channel nature of Chinese demand, combining institutionalised central bank buying with consumer and wholesale physical market activity, creates a demand structure that is qualitatively different from almost any other major gold market. Both channels are active simultaneously, which is why Chinese premiums tend to persist even during periods of global price weakness.
Regional Premium Snapshot: The Asia-Pacific Physical Landscape
| Market | Premium/Discount vs. Benchmark | Market Signal |
|---|---|---|
| China (Mainland) | +$1 to +$5/oz | Moderate physical demand; easing but positive |
| Hong Kong | Par to +$1.90/oz | Thin but present physical interest |
| Singapore | -$0.50 to +$2.00/oz | Balanced; slight softness at the margin |
| Japan | -$0.50/oz | Mild oversupply or subdued local demand |
| India | -$35/oz discount | Demand improving but still price-sensitive |
The regional comparison reveals important gradations in demand intensity across Asia-Pacific. Japan's mild discount and Singapore's neutral-to-slightly-soft positioning suggest limited enthusiasm for physical accumulation in those markets at current price levels. The positive readings from China and Hong Kong stand in contrast, reflecting the structural demand dynamics unique to the Chinese gold ecosystem.
The $4,000/oz Level: Why This Number Matters More Than Most Price Targets
Technical price levels function differently in physical commodity markets than they do in equity markets. In gold specifically, round-number thresholds like $4,000/oz carry both algorithmic significance and psychological significance as reference points for discretionary buyers who have been waiting for a correction before entering the market.
Spot gold's intraday dip to $4,022.29 before recovering on June 12, 2026 suggests the market tested the level's demand-absorbing capacity and found it sufficient to prevent a deeper breakdown. The combination of China's sustained positive premiums and the compression of India's dealer discounts at this price level supports the interpretation that physical demand is providing a floor near $4,000. For a deeper perspective on this, the gold market technical analysis framework offers valuable context on how these support levels form and hold.
Two Scenarios for What Comes Next
Scenario A: Physical Demand Surge Below $4,000
If spot gold were to breach $4,000/oz to the downside, Indian jewellery buyers and Chinese physical investors would likely accelerate purchases meaningfully. India's discount would compress further or potentially flip to a premium in active buying periods, whilst China's premiums would likely widen as local demand outpaces constrained import supply. This demand response could function as a natural price floor with self-correcting properties.
Scenario B: Macro Deterioration Overwhelms Physical Support
If a break below $4,000 coincides with broader macroeconomic deterioration, including US dollar strengthening or rising real yields, the demand response from physical markets may prove insufficient to offset selling pressure from financial gold instruments. In this scenario, Chinese premiums would compress further and Indian discounts could re-widen, signalling that the physical demand floor has been overwhelmed by macro forces.
The next major ASX story will hit our subscribers first
India vs. China: How Structural Gold Demand Drivers Diverge
Understanding why these two markets behave so differently requires examining the underlying demand architecture of each.
| Demand Driver | India | China |
|---|---|---|
| Primary Demand Motivation | Jewellery, cultural/religious, savings | Investment, safe-haven, central bank |
| Price Sensitivity | High (retail-driven, income-constrained) | Moderate (institutional and retail mix) |
| Policy Impact | High (import duties directly inflate local prices) | Moderate (capital controls affect access) |
| Central Bank Role | Limited direct market influence | Dominant, 19 consecutive months of buying |
| ETF Market Maturity | Developing; first major outflow in May 2026 | Larger and more institutionalised |
| Seasonal Demand Peaks | Wedding season, Diwali, Akshaya Tritiya | Lunar New Year, Golden Week |
India's demand is fundamentally retail and culturally driven, which makes it highly responsive to domestic price levels. Gold in India is not merely an investment vehicle; it is a store of value embedded in wedding traditions, religious festivals, and generational wealth transfer. This cultural bedrock means demand will return regardless of policy headwinds, but the timing and intensity of that return is acutely sensitive to price.
China's demand, particularly at the institutional level, is driven by a longer-horizon strategic logic. The PBoC's 19-month accumulation streak reflects a deliberate reserve diversification strategy that is largely insulated from quarter-to-quarter price movements. This makes China's gold demand considerably more reliable as a structural support mechanism for global prices.
Key Takeaways for Investors Tracking Physical Gold Market Signals
The current configuration of india gold demand and china premiums offers several actionable insights for investors monitoring global gold market direction:
- India's narrowing discounts are an early recovery signal, moving from $87/oz to $35/oz in a single week, reflecting rapid demand response to the price correction even without full retail confidence recovery.
- China's positive premiums confirm structural demand, as buyers continue paying above the global benchmark despite compression from higher levels, indicating persistent absorption rather than market saturation.
- The $4,000/oz level is functioning as demonstrated technical support, with physical buying from both markets providing measurable demand at current price levels.
- India's ETF outflow is a price-level response, not a structural shift, reflecting profit-taking by price-sensitive domestic investors rather than any fundamental change in India's long-term relationship with gold.
- China's dual-channel demand creates a uniquely durable support structure, with central bank and physical market buying operating simultaneously across different time horizons.
- Policy divergence between the two markets is creating demand asymmetry, with India's tariff environment actively compressing near-term demand whilst China's capital controls and reserve strategy are actively supporting it.
"Physical market signals in Asia frequently precede futures market moves. Narrowing discounts in India and compressing but positive premiums in China are early indicators that the current price correction may be approaching exhaustion."
For investors seeking to develop a more sophisticated framework for tracking gold price direction, monitoring the premium and discount series across major Asian physical markets offers a layer of analytical depth that spot price charts and futures positioning data simply cannot provide. The LBMA and COMEX gold markets provide complementary benchmark data that can further enrich this analytical picture. Furthermore, the World Gold Council's premium data publishes ongoing regional gold demand and premium/discount series that can serve as essential tools for tracking these dynamics as they evolve through 2026.
Disclaimer: This article is for informational purposes only and does not constitute financial advice. All references to price levels, market forecasts, and demand scenarios involve inherent uncertainty. Past patterns in physical gold market behaviour do not guarantee future outcomes. Investors should conduct their own due diligence before making any investment decisions.
Want to Track the Next Big Mineral Discovery Before the Market Does?
Discovery Alert's proprietary Discovery IQ model delivers real-time alerts on significant ASX mineral discoveries, transforming complex data across 30-plus commodities into clear, actionable insights for both short-term traders and long-term investors — start your 14-day free trial today, or explore historic discovery returns to understand just how significant the right alert at the right moment can be.