August 3, 2026
Why India's Wholesale Inflation Problem Is Bigger Than the Headlines Suggest
When energy markets shift, the first casualties are rarely consumers. They are manufacturers, processors, and industrial supply chains that absorb cost shocks long before retailers adjust their price tags. This upstream-to-downstream lag is central to understanding why India wholesale price inflation and global energy costs have become one of the most closely watched macroeconomic dynamics of 2026, even as retail prices appear relatively stable on the surface.
The widening gap between what wholesale markets are experiencing and what consumers are paying is not just a statistical curiosity. It reflects a structural tension building inside India's economy, one that carries significant implications for industrial margins, monetary policy credibility, and the medium-term inflation outlook.
When big ASX news breaks, our subscribers know first
The Structural Gap Between WPI and CPI: Understanding India's Dual Inflation Reality
India operates with two distinct inflation measurement frameworks, each capturing a different layer of economic activity. The Wholesale Price Index (WPI) tracks price movements at the producer and trader level, measuring costs before goods reach the final consumer. The Consumer Price Index (CPI), by contrast, captures what households actually pay for a defined basket of goods and services.
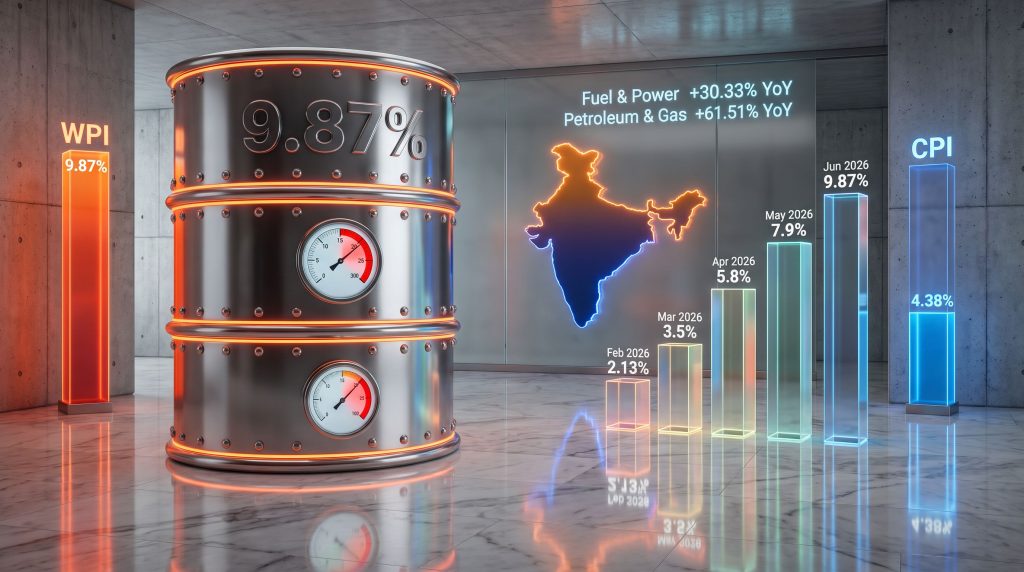
This distinction matters enormously right now. In June 2026, India's WPI-based inflation reached 9.87% year-on-year, while CPI inflation came in at 4.38% for the same period. That divergence of nearly 5.5 percentage points is not simply a measurement anomaly. It reveals that businesses across India's industrial supply chain are currently absorbing a substantial portion of global commodity cost pressures rather than passing them on to end consumers.
The near 5.5 percentage point gap between WPI and CPI in June 2026 signals that India's industrial sector is functioning as a cost buffer between volatile global commodity markets and domestic consumers. This margin compression, if sustained, raises serious questions about investment capacity, working capital requirements, and longer-term pricing behaviour across energy-intensive industries.
A Snapshot of India's Inflation Trajectory in FY2026-27
The speed of WPI acceleration through the current fiscal year has been striking. What began as a modest uptick in early 2026 has evolved into a sustained double-digit-adjacent surge concentrated in energy and commodity-linked sub-indices.
| Month | WPI (YoY %) | CPI (YoY %) | Key Driver |
|---|---|---|---|
| February 2026 | 2.13% | ~3.6% | Base effects, subdued energy |
| March 2026 | 3.88% | ~3.7% | Crude petroleum and natural gas spike |
| April 2026 | 8.30% | ~3.8% | Fuel and power surge (+24% YoY) |
| May 2026 | 9.68% | 3.93% | Fuel and power (+30.33%), petroleum and gas (+61.51%) |
| June 2026 | 9.87% | 4.38% | Mineral oils, food, basic metals, chemicals |
Sources: Government of India WPI releases, RBI data, Reuters
The trajectory from 2.13% in February to 9.87% in June represents a nearly fivefold acceleration in just four months, driven almost entirely by global energy market conditions transmitting into India's upstream pricing environment.
How Global Energy Markets Are Transmitting Inflation Into India's Wholesale Basket
The Energy Price Transmission Mechanism: From Global Crude to Domestic WPI
India's WPI architecture means that international energy price movements have a direct, relatively fast transmission pathway into domestic wholesale pricing. The fuel and power sub-index within WPI responds to global crude benchmarks, LNG pricing, and coal costs with a lag measured in weeks rather than months, unlike the slower consumer-facing CPI transmission.
This transmission speed explains why WPI can surge dramatically while CPI remains comparatively contained. Domestic retail fuel pricing in India involves administered components, cross-subsidies, and government interventions that slow the pass-through to consumers. Wholesale markets, however, operate closer to international price discovery, making WPI a more sensitive real-time gauge of global energy conditions. Furthermore, crude oil price trends globally have exerted sustained upward pressure on import-dependent economies throughout 2025 and into 2026.
The Petroleum and Natural Gas Shock: A 61.51% Year-on-Year Surge Explained
The most striking data point in India's recent inflation narrative is the 61.51% year-on-year increase in petroleum and natural gas prices within the WPI basket recorded in May 2026. To contextualise this figure, it represents one of the steepest annual price movements in this sub-category in recent memory, reflecting a confluence of global supply tightness, geopolitical risk premiums, and the base effect of relatively low energy prices in mid-2025.
Fuel and power prices within India's WPI rose 30.33% year-on-year in May 2026, accelerating from a 24% year-on-year surge recorded in April. This back-to-back monthly escalation represents one of the most compressed energy cost surges India's wholesale pricing system has absorbed in the current economic cycle.
The natural gas component deserves particular attention. India has significantly expanded its LNG import infrastructure in recent years, meaning shifts in global LNG supply now feed more directly into the WPI than they did half a decade ago. Consequently, European demand competition and Middle Eastern supply dynamics transmit rapidly into India's wholesale pricing environment.
Beyond Crude: The Multi-Commodity Cascade Driving WPI Higher
Energy is not the only transmission channel. The WPI surge in 2026 reflects a broader commodity cascade affecting multiple industrial categories simultaneously:
- Mineral oils and petroleum products: The primary channel, directly linked to global crude oil benchmarks and domestic refinery gate pricing
- Basic metals: Steel, aluminium, and copper production costs are heavily influenced by energy inputs to smelting and processing, creating a secondary inflation channel that persists even when crude prices stabilise
- Chemicals and chemical products: Petrochemical feedstock costs move in close correlation with crude and natural gas prices, transmitting energy inflation across the plastics, pharmaceuticals, and agrochemical sectors
- Food articles: An often-overlooked transmission pathway where higher fuel costs increase fertiliser input costs and logistics expenses across the agricultural supply chain, gradually pushing food-related WPI components upward
What Is the Government's Policy Response Framework?
India's Inflation Management Toolkit: Supply-Side Interventions
The Indian government has responded to the WPI acceleration primarily through supply-side tools designed to protect consumer prices rather than wholesale costs. The key interventions deployed in the current cycle include:
- Buffer stock augmentation for essential food commodities, building reserves that can be released into the market to suppress price spikes in staples like wheat, rice, and pulses
- Strategic open-market grain sales through the Food Corporation of India, using government-held stocks to limit speculative price movements in agricultural wholesale markets
- Trade policy calibration, including selective tariff adjustments on imported commodities where domestic supply constraints are contributing to price pressure
These instruments are effective at protecting CPI but have limited impact on WPI components driven by imported energy costs, since fuel pricing involves a different set of trade-offs between fiscal support, subsidy burden, and inflation management.
The RBI-Government Inflation Targeting Architecture
India operates a formal inflation targeting framework in which the CPI serves as the policy anchor. The government, in consultation with the Reserve Bank of India, sets the inflation target on a five-year cycle. On March 25, 2026, the government notified a CPI inflation target of 4%, with a lower tolerance band of 2% and an upper tolerance band of 6%, effective from April 1, 2026 through March 31, 2031.
This is a critical policy design feature with direct implications for how the current WPI surge is being interpreted at the monetary policy level. Because the RBI's formal mandate is anchored to CPI and not WPI, the wholesale inflation acceleration does not automatically trigger a monetary policy tightening response unless and until it begins transmitting materially into retail prices.
India's five-year inflation mandate, renewed in March 2026, anchors monetary policy credibility to the CPI framework. The current WPI surge, while economically significant for industrial sectors, does not in itself constitute a breach of the RBI's formal policy parameters, provided CPI remains within the 2-6% tolerance band.
CPI Performance Under the Inflation Target: A Two-Quarter Scorecard
| Quarter | CPI Average | Status vs. 4% Target |
|---|---|---|
| January-March FY26 (Q4 FY26) | 3.10% | Below target |
| April-June FY27 (Q1 FY27) | 3.90% | Below target |
Both quarters have delivered CPI outcomes below the 4% midpoint target, validating the government's supply-side intervention approach. However, the June 2026 reading of 4.38%, which exceeds the target midpoint for the first time in the current cycle, warrants attention as a potential early indicator of pass-through beginning to materialise.
Is India's Retail Inflation at Risk? Assessing the Pass-Through Probability
Understanding Cost Pass-Through: When WPI Pressure Reaches the Consumer
The concept of cost pass-through describes the process by which businesses that absorb upstream cost increases eventually recoup those costs by raising their own prices. In inflationary environments, the degree and timing of pass-through depends on several factors:
- Competitive market structure: More competitive industries have less pricing power and tend to absorb costs longer before passing them on
- Consumer demand elasticity: Goods with inelastic demand, such as fuel and food staples, see faster pass-through than discretionary categories
- Duration of the cost shock: Short-lived spikes are typically absorbed; structural or sustained increases eventually transmit
- Working capital constraints: Smaller businesses with limited liquidity buffers pass on costs faster than large corporates with financial flexibility
Historically, WPI-to-CPI transmission in India has operated with a lag of approximately three to six months for energy-related categories, though this varies considerably by sector and the nature of the underlying commodity shock. In addition, consumer price impacts from upstream cost pressures have demonstrated a pattern of gradual but persistent escalation across comparable emerging market economies.
The June 2026 CPI Reading: Early Warning Signs or Statistical Noise?
The retail inflation reading of 4.38% in June 2026, rising from 3.93% in May, is notable for two reasons. First, it marks the first time CPI has exceeded the 4% midpoint target in the current cycle. Second, the primary contributors — higher food prices and transport costs linked to fuel — are precisely the categories where WPI energy transmission is most direct and least filtered by government intervention.
While 4.38% remains well within the 6% upper tolerance band, the directional shift from below-target to above-target inflation in a single month, coinciding with the steepest WPI readings of the cycle, creates a monitoring imperative for policymakers and market participants alike.
Scenario Analysis: Three Possible Inflation Trajectories for H2 FY27
Scenario 1: Energy Stabilisation (Base Case)
Global crude and LNG prices moderate through Q3 2026 as supply-side pressures ease. The fuel and power WPI sub-index growth rate decelerates from its current 30%+ trajectory. CPI stabilises in the 4.0-4.5% range, the RBI maintains its current policy stance, and industrial margins begin recovering as input cost pressures ease.
Scenario 2: Sustained Energy Elevation (Risk Case)
Middle Eastern supply disruptions persist and global energy prices remain elevated through Q3 2026. WPI sustains above 9%, and the cumulative cost pressure on businesses reaches a threshold where pass-through to consumer prices accelerates. CPI trends toward 5.0-5.5%, and the RBI faces mounting pressure to signal a more cautious or hawkish policy posture.
Scenario 3: Commodity Supercycle Escalation (Tail Risk)
A synchronised global commodity shock across energy, metals, and food amplifies the current WPI trajectory. Wholesale inflation breaches 11-12%, and CPI approaches the 6% upper tolerance band. The government deploys emergency trade policy measures and potentially reintroduces fuel subsidy mechanisms to contain consumer price damage, creating additional fiscal pressure.
Which Sectors Are Most Exposed to India's WPI Energy Surge?
Industrial Sector Vulnerability: Energy-Intensive Manufacturing at the Frontline
A 30%+ fuel and power WPI surge creates disproportionate pressure on industries where energy represents a significant share of total production costs. The most exposed sectors include:
- Steel and primary metals: Energy accounts for 20-30% of steel production costs; sustained fuel inflation compresses margins and can delay capacity expansion decisions. The global steel outlook for 2025 and beyond already reflected these mounting cost pressures
- Cement: One of the most energy-intensive construction materials, with power and fuel costs representing approximately 25-30% of total production costs
- Fertilisers: Natural gas is both a fuel and a feedstock for urea production; a 61% year-on-year surge in the gas sub-index creates acute cost pressure in this strategically important sector
- Petrochemicals and chemicals: Directly exposed through naphtha, ethane, and other hydrocarbon feedstock pricing
The Agricultural Input Chain: Fertiliser and Logistics Cost Pressures
The energy-to-agriculture transmission pathway is less visible but potentially significant. Natural gas prices directly influence ammonia production economics, and ammonia is the foundational input for urea and other nitrogen-based fertilisers. When gas prices rise 61% on an annual basis, the cost structure of fertiliser production shifts dramatically, creating pressure that either flows through to farmers as higher input costs or is absorbed by government subsidy mechanisms.
India spends substantially on fertiliser subsidies annually precisely to break this transmission chain. However, sustained energy inflation of the current magnitude tests the fiscal capacity of subsidy programmes, particularly if global gas prices remain elevated into the agricultural planting seasons of 2026-27.
Export Competitiveness: The Hidden Cost of Wholesale Inflation
Sustained WPI elevation at current levels raises India's manufacturing cost base in ways that are not immediately visible in export price statistics but accumulate over time. Sectors where India competes globally on cost — including chemicals, specialty metals, textiles, and processed agricultural goods — face a gradual erosion of competitiveness when domestic energy and input costs rise significantly faster than those of competing exporters. Furthermore, Indian steel prices have already faced considerable structural headwinds that this energy cost surge further compounds.
The next major ASX story will hit our subscribers first
How Does India's WPI Energy Sensitivity Compare Globally?
The Structural Import Dependency Factor
A critical but underappreciated dimension of India's WPI vulnerability is the scale of its energy import dependency. India imports approximately 85-87% of its crude oil requirements, a structural characteristic that makes the WPI exceptionally sensitive to international price movements. Unlike energy-exporting economies, where higher commodity prices generate fiscal revenue that can buffer domestic impacts, India faces an almost direct transmission from global crude benchmarks to domestic wholesale costs.
India's energy import dependency ratio means that every sustained 10% increase in global crude oil prices has the potential to add approximately 0.5 to 1.0 percentage points to headline WPI, depending on domestic fuel pricing pass-through policies and the extent of government intervention.
The natural gas dimension adds a second structural vulnerability. India's LNG import volumes have grown substantially as the country pursues gas-based power generation and industrial applications. LNG spot prices, which are set in competitive global markets and influenced heavily by European demand and Asian premium pricing, now transmit directly into the natural gas component of India's WPI with limited buffering capacity.
Emerging Market Peers and the Global Energy Inflation Landscape
India is not alone in facing energy-driven wholesale inflation in 2026. Other major energy-importing emerging economies across Southeast Asia and South Asia have experienced similar WPI dynamics as global commodity cycles have synchronised upward through the first half of the year. What distinguishes India's situation is the scale of its industrial base, the breadth of sectors affected, and the formal inflation targeting architecture that constrains the monetary policy response to CPI rather than WPI outcomes. According to Forbes India, the May 2026 surge represented a defining escalation in this cycle.
Frequently Asked Questions: India Wholesale Price Inflation and Global Energy Costs
What is India's current wholesale price inflation rate?
India's WPI-based inflation reached 9.87% year-on-year in June 2026, continuing an acceleration that began in February 2026 when WPI stood at just 2.13%.
Why is WPI rising faster than CPI in India?
WPI captures upstream commodity and energy costs before government interventions and business decisions filter them through to consumers. Supply-side measures and corporate margin absorption have so far limited the full pass-through, creating the current 5.5 percentage point divergence.
What is India's official CPI inflation target for 2026-2031?
The Government of India notified a CPI inflation target of 4%, with a lower tolerance band of 2% and an upper tolerance band of 6%, effective April 1, 2026 through March 31, 2031.
Which commodity categories are driving India's WPI higher in 2026?
The primary contributors are mineral oils and petroleum products, fuel and power, basic metals, chemicals and chemical products, and food articles — all of which carry significant sensitivity to global energy and commodity price cycles.
How does global crude oil pricing affect India's WPI?
International crude oil prices directly influence the fuel and power sub-index within WPI. In May 2026, petroleum and natural gas prices within the WPI basket rose 61.51% year-on-year, reflecting rapid transmission of global energy market conditions into domestic wholesale pricing. This dynamic is central to understanding India wholesale price inflation and global energy costs in the current cycle.
Has India's retail inflation exceeded its 4% target in 2026?
CPI rose to 4.38% in June 2026, marginally above the 4% midpoint but well within the 6% upper tolerance band. The government has noted that CPI remained below the 4% target for the two preceding quarters.
Key Takeaways: What India's WPI Surge Means for the Economy in 2026
- WPI reached 9.87% in June 2026, representing a near-fivefold acceleration from 2.13% in February, driven almost entirely by global energy cost transmission through import-dependent commodity categories
- Petroleum and natural gas prices surged 61.51% year-on-year in May 2026, with the broader fuel and power sub-index rising 30.33%, marking some of the steepest sub-index movements in recent Indian economic history
- CPI has remained within the RBI's tolerance band, though the June reading of 4.38% above the 4% midpoint target signals that pass-through pressures may be beginning to materialise in food and transport categories
- India's 85-87% crude oil import dependency creates a structurally elevated WPI sensitivity to global energy market conditions that cannot be easily addressed through domestic policy alone
- The WPI-CPI divergence of nearly 5.5 percentage points in June 2026 indicates significant industrial margin compression, with downstream pass-through risk accumulating the longer global energy prices remain elevated
- The fertiliser and agricultural input chain represents a strategically important secondary transmission pathway where natural gas price surges can eventually translate into food inflation if government subsidy mechanisms face fiscal constraints
- Three distinct inflation scenarios for H2 FY27 range from energy market normalisation to commodity supercycle escalation, with Middle Eastern geopolitical dynamics remaining the critical swing variable for the outlook
This article contains forward-looking analysis, scenario projections, and economic assessments based on available data as of August 2026. These projections involve inherent uncertainty and should not be construed as investment advice or definitive economic forecasting. Readers are encouraged to consult primary data sources including official Government of India WPI releases, RBI publications, and independent economic research for investment or business decisions.
Want to Stay Ahead of Commodity-Driven Market Movements on the ASX?
When energy and commodity cost surges reshape industrial margins and drive volatility across resource-linked sectors, identifying the right ASX discoveries early becomes critical — and Discovery Alert's proprietary Discovery IQ model delivers real-time alerts the moment significant mineral discoveries hit the exchange, turning complex commodity data into actionable investment insights. Explore historic examples of major ASX mineral discoveries and their market returns, then begin your 14-day free trial at Discovery Alert to position yourself ahead of the broader market.