
May 19, 2026
How Investment Climate Shifts are Redefining Precious Metals Strategy
Institutional capital flows have fundamentally altered precious metals markets as central bank accumulation reaches record levels. Federal Reserve policy uncertainty creates multiple portfolio pathways while geopolitical tensions elevate safe-haven demand across traditional asset classes. This convergence of forces requires sophisticated investors to analyse the best gold investment in 2026 through four distinct exposure methods: direct ownership strategies, tax-advantaged retirement structures, operational leverage through mining equities, and liquid paper instruments.
Furthermore, understanding these evolving dynamics becomes crucial as investors seek to capitalise on the current gold price forecast while navigating market complexities.
The Evolving Investment Environment Driving Allocation Changes
Central bank buying patterns have reached unprecedented intensity, with quarterly accumulation averaging 585 tonnes according to recent institutional research. This represents a structural shift in global reserve management as monetary authorities diversify away from traditional currency holdings. Currency debasement concerns accelerate institutional adoption whilst supply chain disruptions affect physical delivery logistics and premium structures.
The monetary policy landscape creates rate-sensitive opportunities as traditional investment frameworks no longer apply to precious metals allocation. In addition, ETF investment guide methodologies reveal expense ratios compound differently during extended bull cycles whilst tax treatment variations create significant after-tax return disparities for different investor profiles.
Physical Ownership: Direct Exposure Without Intermediaries
Direct precious metals ownership eliminates intermediary risks whilst maximising investor control over asset custody. This approach delivers zero ongoing fees after initial acquisition, though liquidity considerations and storage requirements create operational complexity requiring strategic navigation.
Consequently, investors seeking safe haven insights recognise that physical ownership provides the most direct exposure to precious metals performance.
Premium Structure Analysis for Different Physical Products
| Product Category | Typical Premium | Liquidity Rating | Storage Complexity | Resale Efficiency |
|---|---|---|---|---|
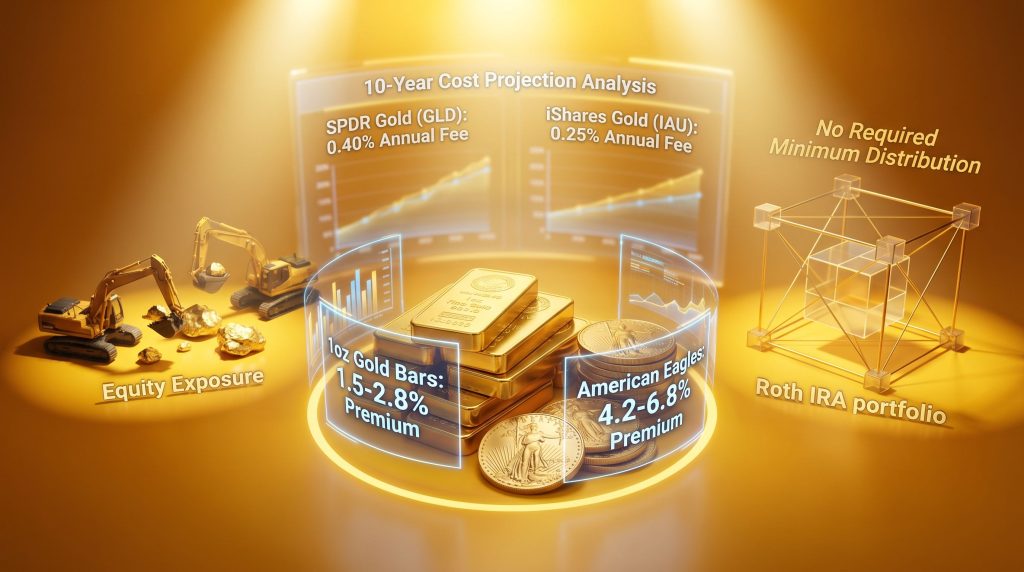
| Accredited Bars | 1-3% over spot | Medium | High security required | Moderate |
| American Eagles | 4-8% over spot | Excellent | Standard safe storage | Excellent |
| Canadian Maples | 4-7% over spot | Very Good | Standard safe storage | Very Good |
| Fractional Coins | 8-15% over spot | Good for small amounts | Minimal requirements | Good |
Bars from established refiners like PAMP Suisse, Valcambi, and Perth Mint typically carry the lowest premiums but create inflexibility challenges. Larger denominations offer tighter spreads but eliminate divisibility advantages that coins provide for gradual position building.
The Mathematical Reality of Premium Amortisation
Premium costs amortise over extended holding periods, with one-time acquisition costs often becoming cheaper than ETF cumulative fees between years five and six. This crossover point varies based on specific product selection and individual storage solutions, making premium analysis critical for long-term wealth preservation strategies.
Insurance calculations for different storage methodologies range from basic homeowner's policy riders to specialised precious metals coverage. For instance, geographic arbitrage opportunities exist in premium structures, particularly during market volatility periods when regional supply constraints create pricing inefficiencies.
When big ASX news breaks, our subscribers know first
Self-Directed Retirement Accounts: Tax-Optimised Physical Ownership
Self-directed retirement accounts containing IRS-approved precious metals create hybrid exposure combining physical asset backing with retirement account tax advantages. This structure maintains direct ownership benefits whilst providing tax-deferred or tax-free growth, though custodial requirements and contribution limitations constrain implementation approaches.
Roth versus Traditional Structure: Long-Term Performance Impact
Traditional Gold IRA Characteristics:
- Current tax deduction benefits on annual contributions
- Required minimum distributions beginning at age 73
- Ordinary income tax treatment on all withdrawals
- Estate planning complications for beneficiary inheritance
Roth Gold IRA Structure:
- After-tax contributions eliminating future tax liability
- No required minimum distribution requirements ever
- Completely tax-free inheritance for designated beneficiaries
- Effective higher contribution limits for high-income earners
Implementation Requirements and Fee Analysis
Annual custodial fees typically range from $200-$500, covering custodian services, depository storage, and administrative overhead. These fixed costs make smaller accounts less efficient whilst larger accumulations benefit increasingly from tax-advantaged compounding as fee burden becomes negligible relative to total assets.
The 2026 contribution limits stand at $7,500 annually ($8,600 for investors aged 50 and older), constraining accumulation pace but providing systematic wealth building opportunities. All gold must meet 99.5% minimum purity standards, with American Gold Eagles representing the sole exception at 91.67% fineness due to statutory provisions.
Home storage remains strictly prohibited – attempting self-custody triggers immediate taxable distribution penalties, requiring all IRA precious metals to remain at IRS-approved third-party depositories throughout the holding period.
Mining Equities: Amplified Exposure with Operational Considerations
Equity positions in precious metals producers provide leveraged exposure to gold price movements whilst introducing company-specific operational variables. This approach offers potential for outsized returns during bull markets but requires fundamental analysis capabilities and elevated risk tolerance compared to direct metal ownership.
Moreover, the mining industry evolution continues to shape investment opportunities within this sector.
Leverage Mathematics in Mining Operations
Historical correlation analysis shows gold price increases of 10% typically producing mining stock gains of 15-25%, though this leverage works in both directions during market declines. Operational leverage factors vary significantly by individual company cost structures, with lower-cost producers experiencing greater percentage gains when gold prices rise due to expanded profit margins on each ounce produced.
Currency exposure impacts affect international mining operations, where foreign exchange movements can amplify or reduce gold price gains depending on local currency strength relative to the US dollar. However, geopolitical risk premiums vary by geographic region, with operations in stable jurisdictions commanding different valuations than those in emerging markets.
Producer Categories: Risk-Return Relationship Analysis
Major Producers (Tier-1 Companies):
- Established production profiles delivering predictable cash flows
- Lower operational risk but limited exploration upside potential
- Dividend payment capabilities during profitable operating periods
- Enhanced liquidity and comprehensive institutional analyst coverage
Junior Exploration Companies:
- Higher potential returns from successful discovery programmes
- Elevated operational and financing risks throughout development
- Limited production revenue during exploration and development phases
- Greater price volatility and reduced liquidity constraints
This structural distinction creates an inverse risk-return relationship within mining equities, where established producers offer stability whilst juniors provide discovery leverage at significantly higher risk levels.
Exchange-Traded Funds: Liquid Access with Ongoing Costs
Exchange-traded funds deliver immediate market access and portfolio integration whilst introducing counterparty risks and perpetual fee structures. Understanding total ownership costs over extended periods reveals when paper gold becomes economically disadvantageous compared to physical alternatives.
Fee Impact Analysis Over Extended Holding Periods
Current ETF Expense Structure (2026):
| ETF Product | Annual Fee | 10-Year Cumulative Cost | Physical Premium Comparison |
|---|---|---|---|
| SPDR Gold (GLD) | 0.40% | ~4.07% total drag | Exceeds typical coin premiums |
| iShares Gold (IAU) | 0.25% | ~2.53% cumulative | Competitive with bar premiums |
| SPDR Mini (GLDM) | 0.10% | ~1.00% total | Below most physical premiums |
Fee mechanics operate through gradual share dilution rather than visible cash withdrawals, making cumulative cost impact less apparent to investors who don't calculate percentage drag over multi-year holding periods. At GLD's 0.40% annual fee, total costs approach 8% over twenty years through this slow dilution process.
Liquidity Advantages versus Ownership Limitations
ETFs provide instant execution during market hours without storage requirements, insurance considerations, or delivery logistics. Tax treatment remains identical to physical gold at the 28% collectibles rate, eliminating any tax advantage for paper ownership over direct metal possession.
However, ETF shareholders hold no claim to underlying physical metal during fund liquidation scenarios, creating counterparty risk that physical ownership completely eliminates. This trade-off between convenience and direct ownership represents the fundamental decision point for long-term investors.
Performance Analysis: Determining Optimal Risk-Adjusted Returns
No single gold investment method dominates across all scenarios, suggesting diversified approaches may deliver superior outcomes. Mathematical modelling reveals optimal strategies depend on individual circumstances including investment timeline, tax situation, storage capabilities, and risk tolerance preferences.
Furthermore, effective gold market strategies require understanding how different investment vehicles perform under varying market conditions.
Market Scenario Performance Analysis
Extended Bull Market Conditions (5+ Years):
- Physical ownership minimises fee drag on compound returns
- Mining stocks provide maximum upside participation potential
- ETFs offer tactical trading opportunities for active management
- Gold IRAs maximise after-tax wealth accumulation regardless of structure
Market Consolidation Periods (2-3 Years):
- ETFs provide cost-effective exposure without storage overhead
- Physical ownership maintains purchasing power without decay
- Mining stocks may underperform due to operational leverage working against investors
- Gold IRAs continue systematic tax-advantaged accumulation independent of price movements
Strategic Allocation Framework by Investor Profile
Conservative Wealth Preservation (Age 50+):
- 60% physical gold combining bars and coins
- 30% gold IRA structure (Roth if income-eligible)
- 10% low-cost ETF providing liquidity buffer
Growth-Oriented Accumulation (Age 25-45):
- 40% gold IRA maximising annual contribution limits
- 30% mining stocks focused on tier-1 producers
- 20% physical gold as core holding foundation
- 10% ETF for tactical allocation flexibility
Active Trading Strategy (All Ages):
- 50% ETFs providing execution flexibility
- 25% mining stocks for leverage exposure
- 25% physical gold as permanent core position
Implementation Strategy: Building Positions Systematically
Current market conditions suggest systematic approach implementation rather than lump-sum deployment may optimise entry timing whilst managing volatility risks. Gold recently touched $5,589 per ounce in January 2026 before pulling back to approximately $4,720, representing a 15% decline from peak levels but maintaining 41% gains year-over-year.
Dollar-Cost Averaging versus Lump Sum: Strategic Considerations
Monthly purchase programmes reduce timing risk over 12-18 month implementation periods, particularly valuable given J.P. Morgan's insights on gold pricing and their revised year-end 2026 forecast to $6,300 per ounce. Premium volatility considerations affect physical purchases differently than ETF accumulation, where systematic buying smooths entry point distribution.
Market volatility benefits systematic ETF accumulation whilst IRA contribution timing optimisation requires coordination with tax year planning requirements. The current $7,500 annual contribution limit ($8,600 for those 50+) constrains IRA accumulation pace but enables consistent wealth building.
Portfolio Maintenance and Rebalancing Protocols
Rebalancing Trigger Options:
- Percentage-based thresholds at 5% or 10% deviation targets
- Time-based schedules quarterly or semi-annually
- Opportunistic rebalancing during extreme market movements
- Tax-loss harvesting opportunities in taxable account holdings
Successful rebalancing requires understanding which investment vehicles provide the most cost-effective adjustment mechanisms, with ETFs offering immediate execution whilst physical gold requires dealer transactions with bid-ask spreads.
The next major ASX story will hit our subscribers first
Strategic Questions and Implementation Answers
What percentage allocation optimises portfolio diversification?
Traditional portfolio theory suggests 5-10% precious metals allocation for diversification benefits, though current monetary conditions may justify higher allocations of 15-25% for wealth preservation focused strategies. Optimal percentage depends on individual risk tolerance, investment timeline, and overall portfolio construction methodology.
How do tax implications affect investment method selection?
All gold investments face the 28% collectibles tax rate on gains, whether physical or paper instruments. Roth IRAs eliminate taxation entirely whilst traditional IRAs defer taxes until withdrawal at ordinary income rates. Mining stocks receive standard capital gains treatment, potentially offering tax advantages for qualified long-term holders.
Which format provides superior liquidity characteristics?
ETFs deliver highest liquidity with instant execution during market hours, whilst American Gold Eagles offer excellent physical market liquidity through universal dealer recognition. Mining stock liquidity varies by company size and average trading volume. Gold IRAs provide lowest liquidity due to custodial requirements and potential withdrawal penalties.
How much gold can retirement accounts accommodate?
IRA contribution limits constrain annual additions but no restrictions limit total account value through appreciation. All gold must meet IRS purity requirements with approved depository storage, creating custodial overhead but enabling substantial tax-advantaged accumulation over decades.
The Framework for 2026 Investment Decisions
Gold investment success requires matching implementation method to individual circumstances rather than following standardised advice. Current market conditions favour precious metals exposure given central bank accumulation rates of 585 tonnes quarterly and institutional price targets reaching $6,300 by year-end.
However, format selection determines how much of gold's performance reaches portfolios after fees, taxes, and operational costs. Physical ownership eliminates annual fee drag whilst gold IRAs capture gains within tax-efficient structures. ETFs provide convenience but gradually erode returns through expense ratios over extended periods.
Additionally, investors can gain valuable perspective from Forbes' analysis of gold stocks when considering mining equity exposures.
Critical Investment Insight: The best gold investment in 2026 combines formats rather than concentrating in single methods, with physical core holdings providing direct ownership whilst IRAs maximise tax efficiency and ETFs enable tactical flexibility.
Market conditions of monetary uncertainty, geopolitical tensions, and unprecedented institutional demand suggest gold allocation remains strategically sound. Consequently, the format selection process determines whether investors capture gold's full performance potential or surrender significant returns to intermediaries, taxes, and operational inefficiencies.
Disclaimer: This analysis provides educational information only and does not constitute investment advice. Precious metals investing involves risks including potential loss of principal. Past performance does not guarantee future results. Consult qualified financial advisors before making investment decisions. All data and forecasts are subject to change without notice.
Ready to Capitalise on the Next Major Gold Discovery?
Discovery Alert's proprietary Discovery IQ model delivers real-time alerts on significant ASX mineral discoveries, instantly empowering subscribers to identify actionable opportunities ahead of the broader market. Begin your 14-day free trial today and secure your market-leading advantage whilst understanding why historic discoveries can generate substantial returns.