
June 24, 2026
The Geography of Global Energy Vulnerability: Why Hormuz Has No Equal
Few infrastructure chokepoints in human history have concentrated so much economic consequence into so little physical space. The global oil trading system, worth trillions of dollars annually, funnels a disproportionate share of its volume through a single waterway measuring just 21 miles at its narrowest navigable point. Understanding why the Strait of Hormuz oil disruption unfolding in May 2026 carries such extraordinary systemic weight requires grasping both the physical geography of the passage and the infrastructure deficit that makes meaningful substitution functionally impossible.
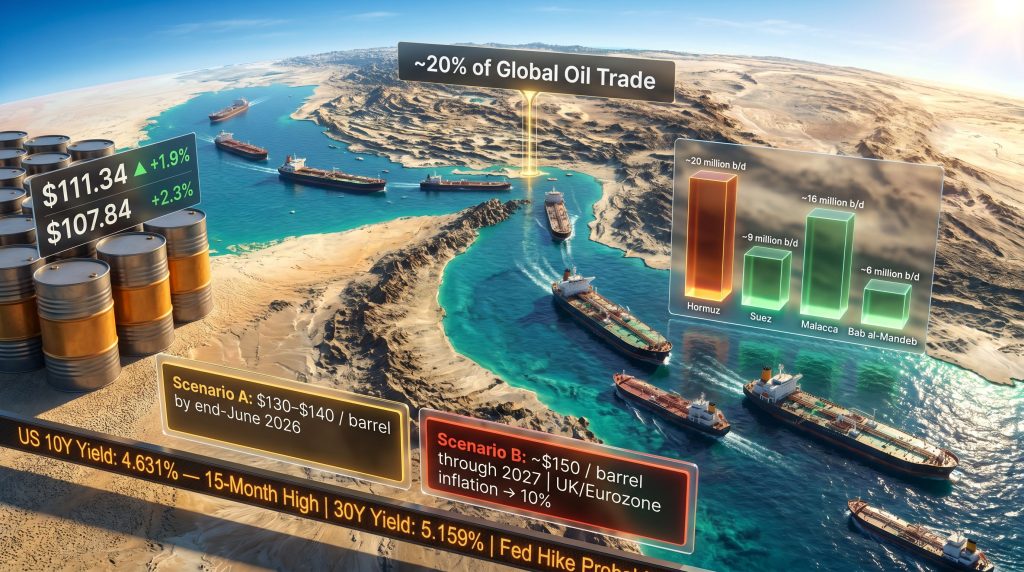
Under normal operating conditions, approximately 20 million barrels per day of crude oil, condensate, and petroleum products transit the Strait of Hormuz, representing close to one-fifth of total global seaborne oil trade. This figure is not merely large in absolute terms; it is structurally concentrated in a way that creates an unavoidable vulnerability. The actual shipping lanes within the strait consist of two 2-mile-wide corridors, one inbound and one outbound, separated by a 2-mile buffer zone.
The depth profile through these corridors averages around 60 metres in most sections but becomes shallower in certain areas, restricting access for fully laden ultra-large crude carriers and constraining overall throughput flexibility.
The Persian Gulf coastline concentrates the maritime export terminals of Saudi Arabia, Iraq, Kuwait, the UAE, Qatar, and Iran within a single enclosed basin. Every barrel exported by sea from this region must exit through the Strait before reaching the open ocean. That geographical reality is the source of Hormuz's irreplaceable status, and it is a reality that no policy decision or infrastructure investment can quickly alter.
How Hormuz Compares to Other Critical Maritime Chokepoints
The contrast with other major maritime passages clarifies why the current Strait of Hormuz oil disruption is categorically different from prior supply shocks involving other waterways.
| Chokepoint | Estimated Daily Oil Flow | Alternative Route Available | Bypass Capacity |
|---|---|---|---|
| Strait of Hormuz | ~20 million b/d | Limited | Partial only (Saudi East-West Pipeline) |
| Suez Canal | ~9 million b/d | Yes (Cape of Good Hope) | Full, though costly |
| Bab al-Mandeb | ~6 million b/d | Partial | Limited |
| Strait of Malacca | ~16 million b/d | Yes (Lombok Strait) | Partial |
Unlike the Suez Canal, which has a viable if expensive maritime detour, the Strait of Hormuz has no full substitute. Saudi Arabia's East-West Pipeline can reroute some Gulf volumes directly to Red Sea export terminals, but its maximum capacity of approximately 5 million barrels per day represents less than one-quarter of normal Hormuz throughput.
The asymmetry problem is critical. Disrupting Hormuz traffic requires minimal resources compared to the massive capital investment and years of construction that would be needed to develop meaningful alternative export infrastructure for Gulf producers. That asymmetry is precisely what makes the current situation so consequential for global financial market risks and energy supply chains simultaneously.
When big ASX news breaks, our subscribers know first
What Is Actually Happening Inside the Strait of Hormuz Right Now?
The Sequence of Events Driving the Current Supply Shock
The disruption that has sent Brent crude to $111.34 per barrel as of May 18, 2026 was triggered by drone strikes targeting UAE and Saudi Arabian energy infrastructure, including a fire at a UAE nuclear facility and the interception of three drones reported by Saudi Arabian authorities, according to Reuters reporting on May 18, 2026. The immediate operational consequence was a dramatic reduction in tanker traffic through the Strait, with Reuters describing flows as reduced to a fraction of their normal volume.
Insurance markets reacted swiftly. War risk premiums on vessels willing to transit the corridor surged, forcing major shipping operators to suspend or significantly reduce Hormuz transits pending security assessments. The combined effect of vessel withdrawals and premium escalation produced the physical supply constraint now reverberating across global energy markets. Bloomberg's analysis of the Hormuz closure oil shock provides further context on how markets are pricing this unprecedented event.
The International Energy Agency has formally classified this disruption as the largest coordinated supply emergency in oil market history, a designation that reflects both the volume affected and the absence of readily deployable replacement supply.
The Physical Supply Shortage Mechanism: From Trickle to Crisis
The critical distinction between this event and typical geopolitical oil price spikes is the shift from a risk premium dynamic to a genuine physical supply shortage. That distinction matters enormously for how long elevated prices persist and how markets eventually rebalance.
Capital Economics issued a formal assessment on May 18, 2026 warning that limited shipping access through the Strait is depleting global oil inventories at a rate that could push stockpiles to critical levels by the end of June 2026 if disruptions continue. The mechanism works through several sequential steps:
- Reduced tanker movements lower crude deliveries into downstream refining systems globally.
- Energy buyers draw down stored inventories to maintain fuel supply continuity for power generation, transportation, and industrial processes.
- Inventory depletion removes the buffer that historically absorbs supply disruptions of shorter duration.
- As stockpiles approach critical thresholds, physical scarcity rather than sentiment begins to set prices.
- Alternative export routes cannot scale fast enough to offset the deficit due to infrastructure capacity ceilings.
Capital Economics confirmed directly that replacement exports cannot scale fast enough because alternative routes lack comparable transport capacity and infrastructure, reinforcing the structural nature of the current constraint.
EIA Historical Data: What the Pre-Disruption Trend Reveals
Data from the U.S. Energy Information Administration reveals that between 2022 and 2024, crude and condensate flows through the Strait of Hormuz had already declined by 1.6 million barrels per day due to prior regional tensions and shipping disruptions. Crucially, alternative routes only partially offset that reduction during this period, demonstrating that the substitution ceiling is real and was already being tested before the current crisis began. Saudi Arabia's increased reliance on its East-West Pipeline during prior Red Sea and Bab al-Mandeb disruptions provides a precedent, but one that illustrated the ceiling rather than the solution.
How Does a Hormuz Disruption Transmit Into Global Inflation?
The Five Economic Transmission Channels
The connection between a maritime shipping disruption in the Persian Gulf and consumer price indices in Europe, Asia, and North America operates through five distinct but interconnected mechanisms:
- Crude price escalation – Brent crude rose 1.9% to $111.34 per barrel on May 18, 2026, while US crude gained 2.3% to $107.84. These are not risk premium movements; they reflect tightening physical availability.
- Freight and insurance cost surge – Tanker operators pricing security risk into shipping rates transmit cost increases across global commodity trade far beyond oil itself.
- Refinery input cost pressure – Regions dependent on Gulf crude, including large parts of Asia and Europe, face both delayed deliveries and higher feedstock costs simultaneously.
- Consumer fuel price pass-through – Elevated crude translates into higher petrol, diesel, and aviation fuel prices at the consumer level, compressing household disposable income.
- Broader inflation expectations repricing – Energy costs feeding into CPI forecasts force central banks to reassess the trajectory of rate policy, creating second-order financial market effects.
Furthermore, the trade war impact on oil prices compounds these transmission channels, adding yet another layer of complexity to an already strained global supply picture.
Two Escalation Scenarios Modelled for 2026-2027
Capital Economics outlined two distinct forward scenarios in its May 18, 2026 assessment, each with materially different implications for monetary policy and equity valuations:
Scenario A – Moderate Escalation: Brent reaches $130-$140 per barrel by end-June 2026 if inventory drawdowns continue at the current rate without supply-side relief. This scenario assumes partial normalisation of shipping volumes before full depletion occurs.
Scenario B – Prolonged Disruption: Oil stabilises near $150 per barrel through 2027, driving inflation toward 10% in the UK and eurozone and forcing central bank policy rates back toward prior cycle highs. This scenario assumes that the physical shipping constraint persists well beyond the near term.
Why Bond Markets Are Treating This as a Rate Cycle Event, Not Just an Energy Shock
The bond market response to the current Strait of Hormuz oil disruption has been unusually severe, suggesting that institutional investors are pricing not just near-term inflation but a potential reopening of the rate tightening cycle.
US 10-year Treasury yields climbed to 4.631%, a 15-month high, as of May 18, 2026. US 30-year Treasury yields reached 5.159% following an 18-basis-point weekly increase. CME Group FedWatch data now implies a 50% probability of a Federal Reserve rate increase before year-end 2026.
The logical chain connecting oil prices to equity valuations runs as follows:
- Oil above $110 per barrel sustains inflationary pressure across multiple CPI components.
- Sustained inflation forces central banks to delay or reverse planned rate cuts.
- Higher-for-longer policy rates increase corporate borrowing costs at refinancing events.
- Rising discount rates compress the present value of future corporate earnings.
- Compressed equity valuations coincide with weakening consumer demand, creating a dual headwind.
Citi strategist Scott Chronert noted on May 18, 2026 that meaningful index upside is contingent on investors gaining clearer visibility into the resolution of the Iran conflict, underscoring that recent equity market gains concentrated in AI infrastructure spending remain vulnerable until geopolitical conditions stabilise.
Which Economies and Regions Face the Greatest Exposure?
Asia: The Highest-Dependency Import Region
Asian economies represent the primary destination markets for Gulf crude transiting the Strait of Hormuz, making the region disproportionately exposed to the current disruption. Japan, South Korea, India, and China together account for the majority of Gulf oil export volumes, and their import infrastructure is built around receiving crude from Persian Gulf terminals with transit times calibrated for normal Hormuz operations.
Asian equity markets declined sharply on May 18, 2026 as investors immediately recognised the supply chain exposure embedded in regional economic activity. For energy-intensive manufacturing economies like South Korea and Japan, which import virtually all of their crude oil requirements, even a moderate sustained increase in landed crude costs creates compounding pressure across multiple industrial sectors simultaneously.
Extended rerouting timelines compound the physical cost problem. Rerouting cargoes around the Cape of Good Hope adds approximately 15-20 days to delivery schedules for Asia-bound shipments, creating inventory management challenges for refiners operating with lean buffer stocks.
Europe: The Inflation Amplification Risk
European energy systems are operating with reduced buffer capacity following prior supply disruptions that have progressively eroded strategic inventory levels. Capital Economics modelling suggests UK and eurozone inflation could approach 10% under the prolonged disruption scenario, a level that would create severe pressure on central bank credibility and force policy responses that simultaneously suppress economic growth.
The stagflationary feedback loop presents a particularly difficult policy environment: higher rates required to contain energy-driven inflation would simultaneously weaken credit availability, depress housing markets, and compress corporate investment, amplifying economic contraction risk precisely when energy cost pressures are already reducing real household income.
United States: The Dual Pressure of Energy Costs and Rate Expectations
Nasdaq futures fell 0.8% as US markets processed the combined impact of oil price increases and Treasury yield movements on May 18, 2026. The United States faces a dual pressure dynamic distinct from Asian and European exposures: domestic energy production provides partial insulation against physical supply shortages, but financial market transmission through rising Treasury yields affects housing affordability, corporate borrowing costs, and equity valuations regardless of domestic production levels.
Strategic Petroleum Reserve deployment and coordinated releases with IEA member nations represent the primary near-term policy lever available to the US administration for bridging physical supply gaps during the disruption period.
What Are the Strategic Responses from Governments and Industry?
IEA Coordinated Emergency Response
The IEA's formal classification of the current Hormuz disruption as the largest supply interruption in oil market history triggered activation of emergency coordination mechanisms among member nations. Strategic petroleum reserve releases have been authorised to buffer near-term physical supply gaps while diplomatic and logistical solutions are pursued. Historical precedent from prior SPR releases during supply shocks suggests that coordinated IEA releases can provide approximately 30-90 days of inventory buffer before market rebalancing mechanisms must carry the adjustment.
Coordination with non-OPEC producers to assess incremental supply capacity is underway, though OPEC's market influence remains a central variable in how quickly alternative supply can be mobilised at scale.
Shipping Industry Adaptation Measures
The shipping industry's response has concentrated around three operational adjustments:
- Major tanker operators have suspended or reduced Strait of Hormuz transits pending updated security assessments from flag state authorities and P&I insurance clubs.
- War risk insurance premiums have escalated to levels that make economically marginal voyages through the corridor financially unviable for smaller operators.
- Rerouting decisions are being made on a cargo-by-cargo basis, with the Cape of Good Hope option adding 15-20 days and significant additional fuel costs to Asia-bound voyages.
The Critical Minerals Dimension: Supply Chain Nationalism Accelerates
A parallel development on May 18, 2026 illustrates how geopolitical risk is reshaping investment frameworks beyond the energy sector. Australian Treasurer Jim Chalmers announced that six investors with Chinese-linked shareholdings must divest their stakes in Northern Minerals, a company developing the Browns Range heavy rare earths project in Western Australia. Northern Minerals shares fell more than 8% to A$0.022 following the announcement.
The investment implication extends well beyond a single company. Consequently, the broader geopolitical mining landscape is shifting, with Western governments demonstrating increasing willingness to treat critical mineral access as a national security priority. For investors in the mining sector, this trend means that ownership structures, shareholder nationality, and end-market orientation are becoming underwriting criteria rather than peripheral considerations. In addition, critical minerals demand is accelerating as supply chain nationalism drives governments to secure domestic access to strategic resources.
How Should Investors Think About Portfolio Positioning During a Hormuz Disruption?
The Binary Event Risk Problem: Why Predicting Escalation Timelines Fails
Retail and institutional investors face a structurally identical problem when attempting to position portfolios around geopolitical disruptions of this type: the timeline of military escalation and shipping normalisation cannot be forecast with sufficient precision to generate reliable trading signals.
Portfolio strategies built on predicting ceasefire timing or diplomatic resolution outcomes introduce unhedgeable binary event risk. As Citi strategist Scott Chronert observed on May 18, 2026, meaningful equity index recovery requires clearer visibility into the Iran conflict wind-down, a precondition that is entirely outside investor control. Building a portfolio thesis around that variable is structurally different from evaluating the operational resilience of individual companies.
A Framework for Evaluating Corporate Resilience Under Sustained High Oil Prices
Three operational filters help identify companies better positioned to absorb $110+ per barrel oil environments without structural financial damage:
- Debt load – Companies with low leverage face reduced refinancing risk as Treasury yields rise, avoiding forced equity dilution or covenant pressure during a period of compressed valuations.
- Cash flow stability – Businesses generating consistent free cash flow can absorb higher input costs without accessing capital markets at unfavourable terms.
- Pricing power – Companies able to pass through fuel, freight, and financing cost increases to end customers preserve margin integrity while competitors absorb losses.
Sectors Facing the Sharpest Cost Pressure
| Sector | Primary Cost Exposure | Ability to Pass Through Costs |
|---|---|---|
| Airlines | Jet fuel (direct, typically 20-30% of operating costs) | Moderate (competitive pricing pressure) |
| Retail / Consumer Goods | Freight and logistics | Low to moderate |
| Transport / Logistics | Diesel and fuel surcharges | Moderate |
| Housing / Construction | Financing costs (rate-sensitive) | Low |
| Energy Producers | Minimal – they benefit from higher prices | High |
Three Data Points Institutional Investors Are Monitoring Daily
- Brent crude pricing relative to the $110 threshold that triggers inflation repricing in bond markets.
- Tanker traffic volumes through the Strait of Hormuz as the primary physical supply indicator.
- Federal Reserve meeting communications and forward guidance language on inflation tolerance.
Broader corporate resilience signals are also available this week through Nvidia earnings, which will indicate whether AI infrastructure demand remains insulated from macro cost pressures, and Walmart results, which will provide a direct read on consumer spending behaviour under rising energy costs.
The next major ASX story will hit our subscribers first
What Would Cause This Scenario to Reverse? Identifying the Key Falsification Triggers
Trigger 1: Hormuz Shipping Normalisation
Confirmation of resumed normal tanker traffic volumes through the Strait would remove the physical supply shortage dynamic that is driving price escalation beyond typical geopolitical risk premium levels. Inventory drawdown pressure would ease within weeks of normalisation, and Brent pricing would likely retreat from the $110+ range as market participants unwound scarcity positioning. This trigger is the most direct and would produce the fastest and most durable market reversal.
Trigger 2: Federal Reserve Signals Policy Tolerance
If the Federal Reserve communicates willingness to tolerate near-term inflation without further tightening, the bond market repricing embedded in current Treasury yields would partially reverse. Lower yield expectations would reduce discount rate pressure on equity valuations and ease housing market affordability stress. Critically, this trigger addresses the financial market transmission mechanism but leaves the underlying physical supply constraint intact, making any equity recovery contingent on that constraint eventually resolving.
Trigger 3: IEA Strategic Reserve Deployment at Scale
Coordinated release of strategic petroleum reserves across IEA member nations could temporarily bridge the inventory gap predicted to reach critical levels by end-June 2026. Historical precedent from prior SPR coordinations provides a 30-90 day buffer window during which diplomatic or operational solutions can be pursued without full market dislocation. This trigger buys time rather than resolving the structural supply constraint.
Frequently Asked Questions: Strait of Hormuz Oil Disruption
How much oil passes through the Strait of Hormuz?
Under normal operating conditions, approximately 20% of global oil trade, roughly 20 million barrels per day, transits the Strait of Hormuz. It is the single most important maritime oil chokepoint in the world, with no full alternative route capable of absorbing its total throughput.
What happens to oil prices if the Strait of Hormuz is blocked?
A complete blockage would represent an unprecedented supply shock. Partial disruptions have already pushed Brent crude above $111 per barrel as of May 18, 2026. Capital Economics modelling suggests sustained disruption could drive prices to $130-$140 per barrel in the near term and potentially toward $150 if the situation extends into 2027.
Why can't oil simply be rerouted around the Strait of Hormuz?
Saudi Arabia's East-West Pipeline provides a partial bypass, but its maximum capacity of approximately 5 million barrels per day is insufficient to replace total Hormuz volumes. Other alternative maritime routes add weeks to delivery timelines and significantly increase shipping costs. No existing infrastructure can fully substitute for the Strait's throughput capacity.
How does a Hormuz disruption affect inflation?
Higher crude prices feed directly into fuel, freight, and petrochemical costs across the global economy. These cost increases transmit into consumer prices through energy bills, transport costs, and manufactured goods pricing. Capital Economics has modelled scenarios where prolonged disruption drives UK and eurozone inflation toward 10%, with corresponding pressure on central bank rate policy.
What is the IEA's role during a Hormuz disruption?
The International Energy Agency coordinates strategic petroleum reserve releases among member nations during major supply emergencies. The IEA has classified the current Strait of Hormuz oil disruption as the largest supply interruption in oil market history and has activated emergency coordination mechanisms among member nations.
Which countries are most affected by a Strait of Hormuz disruption?
Asian economies, particularly Japan, South Korea, India, and China, face the greatest direct exposure as the primary importers of Gulf crude. European nations face amplified inflation risk and potential stagflationary policy dilemmas. The United States faces both energy cost pressure and financial market stress through rising Treasury yields and equity valuation compression.
Key Statistics Summary: Strait of Hormuz Disruption at a Glance
| Metric | Data Point |
|---|---|
| Brent crude price (May 18, 2026) | $111.34 per barrel (+1.9%) |
| US crude price (May 18, 2026) | $107.84 per barrel (+2.3%) |
| Share of global oil trade via Hormuz | ~20% |
| US 10-year Treasury yield | 4.631% (15-month high) |
| US 30-year Treasury yield | 5.159% |
| Fed rate hike probability (year-end) | 50% (CME FedWatch) |
| Hormuz flow decline (2022-2024) | 1.6 million b/d |
| Near-term Brent escalation scenario | $130-$140 per barrel by end-June 2026 |
| Prolonged disruption scenario | ~$150 per barrel through 2027 |
| Inflation risk (UK/Eurozone) | Approaching 10% under prolonged scenario |
| Northern Minerals share decline | More than 8% to A$0.022 |
This article contains forward-looking analysis, scenario modelling, and market projections based on information available as of May 18, 2026. Commodity prices, Treasury yields, and geopolitical conditions are subject to rapid change. Nothing in this article constitutes financial advice. Readers should conduct independent research and consult qualified financial advisers before making investment decisions. Past market behaviour during prior supply disruptions does not guarantee equivalent outcomes in the current scenario.
Want to Stay Ahead of the Next Major Mineral Discovery Amid Market Volatility?
While energy shocks and geopolitical disruptions reshape global markets, Discovery Alert's proprietary Discovery IQ model scans ASX announcements in real time, instantly identifying significant mineral discoveries and delivering actionable insights directly to subscribers — explore historic discoveries and their returns to understand the opportunity, then begin your 14-day free trial to position yourself ahead of the broader market.