
July 24, 2026
When Diplomatic Signals Become the Market's Most Traded Asset
In energy markets, geopolitical uncertainty has always functioned as an invisible tax on every barrel of crude. But there are rare moments when that tax becomes the primary pricing mechanism itself, eclipsing fundamentals like inventory levels, seasonal demand, and production quotas. The Iran ceasefire and oil markets dynamic in 2026 represents exactly such a moment. Traders are no longer simply pricing oil based on supply and demand arithmetic. They are pricing probability distributions across diplomatic scenarios, assigning real dollar values to outcomes that remain deeply uncertain.
This distinction matters enormously. A market repricing around the likelihood of resolution behaves very differently from one responding to an actual resolution. The volatility is larger, the reversals are sharper, and the gap between short-term price signals and long-term structural fundamentals widens to a degree that creates genuine opportunity and genuine danger for investors navigating these conditions. Furthermore, understanding how trade and geopolitics interact with crude pricing has never been more critical for market participants.
When big ASX news breaks, our subscribers know first
What the Iran Ceasefire Actually Means for Crude Benchmarks
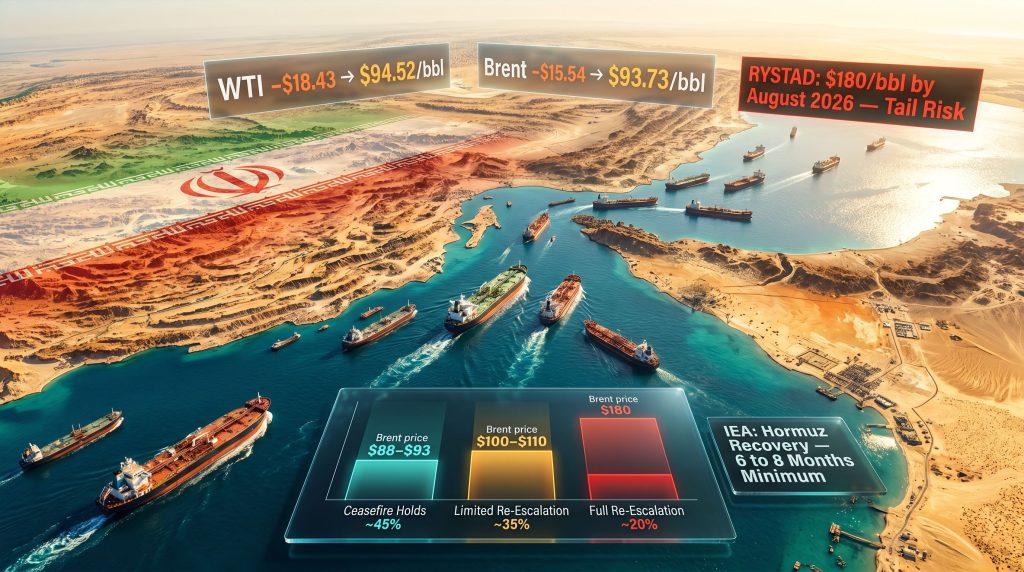
The price action surrounding the Iran ceasefire and oil markets relationship has been striking in both scale and speed. When ceasefire reports circulated, WTI crude dropped approximately $18.43 per barrel, settling near $94.52/bbl, while Brent fell $15.54 to trade around $93.73/bbl. That kind of single-session move reflects the scale of the geopolitical risk premium that had been embedded in crude prices during the period of active Hormuz disruption.
Yet within hours, when Tehran signalled it was merely reviewing the U.S. proposal rather than accepting it, Brent futures found a ceiling near $95 per barrel. The oscillation captures the core challenge: markets are not responding to facts, but to the shifting probability of facts. For a broader crude market overview, these diplomatic swings underscore just how structurally exposed benchmark prices have become.
The Crucial Distinction: Reprieve vs. Resolution
Analysts across the spectrum have been consistent on one critical framing point. A ceasefire announcement reduces the immediate risk premium. A durable diplomatic settlement would structurally alter supply expectations, shipping assumptions through the Strait of Hormuz, and Iran's export volumes. These are fundamentally different market conditions, and the price spread between them is measured in multiple dollars per barrel.
The table below illustrates how different diplomatic outcomes have mapped to benchmark price responses:
| Market Event | WTI Impact | Brent Impact | Directional Signal |
|---|---|---|---|
| Ceasefire announcement | -$18.43 to ~$94.52/bbl | -$15.54 to ~$93.73/bbl | Bearish short-term |
| Iran halts U.S. talks | +7% surge | Parallel move | Bullish spike |
| Ceasefire review confirmed | Capped near $95/bbl | Moderate softening | Neutral-to-bearish |
| Full re-escalation (Rystad model) | Potential $180/bbl by August | Correlated upside | Extreme tail risk |
Why the Strait of Hormuz Cannot Be Treated as a Binary Risk
Most coverage of the Strait of Hormuz frames it as an on/off switch. Either it is open or it is closed. The reality of how this critical waterway functions, and what its partial disruption actually costs the global economy, is far more nuanced.
Under normal conditions, roughly 20% of the world's oil supply transits through this narrow passage. However, the consequences of even partial disruption compound across the supply chain in ways that are not immediately visible in the headline price. Japan's crude imports collapsed by 66% in April alone, providing a concrete illustration of how quickly downstream demand destruction accelerates when Hormuz flows are constrained. The oil market impacts of such disruptions extend far beyond the immediate price shock.
The 6-to-8-Month Recovery Problem
Perhaps the most underappreciated analytical insight to emerge from the current situation comes from the IEA's oil analysis chief, Toril Bosoni, who has stated publicly that restoring full Hormuz shipping flows would take at least 6 to 8 months from the point a ceasefire takes hold, according to Reuters reporting. This timeline creates a structural lag that markets have not yet fully priced.
Even if diplomacy succeeds today, the physical supply-side relief will not arrive for the better part of a year. That means the floor on oil prices remains elevated well into late 2026 regardless of the diplomatic outcome.
The recovery constraints are structural, not merely logistical:
- Shipping insurance and re-routing inertia – Operators require sustained, verifiable security guarantees before reverting to Hormuz transit lanes. Underwriters are not quick to reprice marine war risk premiums.
- Port and terminal congestion – Diverted cargo flows have created backlogs at alternative routing hubs that take time to clear.
- Iranian export infrastructure degradation – Years of sanctions-era underinvestment mean Iranian export capacity cannot surge immediately, even if sanctions relief is granted.
- Buyer confidence windows – Asian refiners typically need 60 to 90 days of forward purchase visibility to meaningfully re-integrate Iranian barrels into their feedstock planning.
Meanwhile, Iran's newly established Persian Gulf Strait Authority has processed more than 300 transit requests from non-Iranian vessels since late April, with China-bound tankers accounting for 28% of total requests. This partial restoration of flow is significant, but it is not normalisation.
Three Scenarios and Their Price Implications
Rather than treating the ceasefire as a simple binary outcome, sophisticated market participants are running probability-weighted scenario analysis across at least three distinct pathways. Understanding these scenarios is central to positioning around the Iran ceasefire and oil markets nexus.
Scenario 1: Ceasefire Holds and Deepens (Base Case, approximately 45% probability)
- Brent gravitates toward $88 to $93/bbl as risk premium gradually deflates
- Hormuz flows normalise over a 3 to 6 month window
- OPEC+ continues its planned monthly production increase of 188,000 b/d as part of a broader unwinding of 1.65 million b/d in prior cuts
- Goldman Sachs' demand destruction thesis provides a partial offset to supply recovery, capping price upside
Scenario 2: Ceasefire Collapses, Limited Re-escalation (Hybrid, approximately 35% probability)
- Brent re-tests the $100 to $110/bbl band
- Hormuz disruptions persist, sustaining the embedded risk premium
- IEA warnings about critically low global inventory levels ahead of peak summer demand become a live market concern
- The Kansas Federal Reserve's position that the oil price shock may not be transitory gains broader credibility
Scenario 3: Full Re-escalation and Hormuz Closure (Tail Risk, approximately 20% probability)
- Rystad Energy's modelled scenario of oil reaching $180 per barrel by August 2026 enters genuine consideration
- Global refining capacity faces acute feedstock shortages
- Demand destruction accelerates sharply across price-sensitive emerging markets
Goldman Sachs has argued that demand destruction mechanisms will act as a natural ceiling on oil prices even in a supply shock environment. Rystad Energy's modelling takes the opposite view, projecting extreme upside if re-escalation unfolds. The gap between these two analytical positions represents the actual uncertainty band that traders are navigating.
Russia's Refinery War Paradox: When Destruction Generates Exports
One of the least discussed but most consequential supply-side dynamics currently reshaping oil markets involves Russia and Ukraine. Ukraine has conducted strikes on 15 Russian refineries between January and May 2026, according to statements attributed to Ukrainian President Volodymyr Zelenskyy. The most recent target was the 138,000 b/d Ilsky refinery in Russia's Krasnodar region.
The intended effect of these strikes is to reduce Russia's oil revenue by crippling its domestic refining capacity. The paradox is that by disabling downstream processing, the strikes are inadvertently redirecting crude that would otherwise be processed domestically into export markets instead. Consequently, the effects of Russian oil sanctions have been further complicated by this unintended export dynamic.
Russia's seaborne crude exports in 2026 have averaged 3.46 million b/d — the highest loading pace since the conflict began in 2022, and approximately 120,000 b/d above the same period one year earlier, according to Bloomberg. While refined product exports would yield superior margins, the elevated global oil price environment has lifted the overall value of Moscow's raw crude outflows regardless, with the 4-week average weekly export value climbing to approximately $2.2 to $2.3 billion.
Russia has also imposed a ban on jet fuel exports until November 30, restricting roughly 30,000 b/d of aviation fuel flows that had previously supplied Turkish airports, according to Reuters.
OPEC+ Strategy: Market Share Over Price Defence
The OPEC+ group's posture during the ceasefire uncertainty period carries its own strategic signal. The group is proceeding with monthly production increases of 188,000 b/d regardless of diplomatic outcomes, as part of a gradual reversal of 1.65 million b/d in prior supply restraint. Furthermore, OPEC's global influence on pricing strategy has rarely been more consequential than during this period of heightened diplomatic flux.
| OPEC+ Variable | Current Status |
|---|---|
| Monthly production increase | +188,000 b/d (continuing) |
| Total planned unwind volume | 1.65 million b/d |
| Saudi Arabia pricing posture | Expected to cut official selling prices again |
| Iraq, UAE, Saudi capacity surge | Targeted for 2027 |
The decision to continue supply increases irrespective of Hormuz conditions suggests that the group is prioritising market share recovery over price support at current levels. Saudi Arabia is also expected to reduce its official selling prices again, reinforcing this read of the group's strategic intent.
The next major ASX story will hit our subscribers first
Downstream Shock: How Emerging Markets Are Absorbing the Pressure
The Iran ceasefire and oil markets story is not confined to trading floors in London and New York. Its most acute consequences are being felt across oil-importing economies in Asia and South Asia, where energy import costs directly translate into inflation and growth pressure.
- India: Research suggests that $90/bbl oil could push domestic inflation to 4.8% while meaningfully slowing GDP growth. India's central bank has formally identified the oil shock as a threat to the broader growth outlook. Indian refiners have frozen domestic jet fuel prices to limit pass-through effects on consumers.
- Pakistan: Inflation has accelerated to 11.7% driven in significant part by oil and gas import cost increases.
- Japan: A 66% collapse in crude imports in April illustrates both the severity of supply disruption and the downstream adjustment already underway.
- China: The National Development and Reform Commission has permitted independent refiners in Shandong province to reduce output from June to no lower than 80% of last year's monthly average, acknowledging that full-capacity operation has become economically unviable under Hormuz disruption conditions.
The Philippines received its first Iranian crude cargo since the Hormuz blockade began, signalling that some buyers are finding pathways through alternative routing and diplomatic arrangements. This is an early but meaningful indicator that full isolation is not the permanent outcome.
Venezuela's Partial Offset and Its Structural Limits
Venezuela has emerged as a partial compensating supply source as Iranian volumes remain constrained. Venezuelan crude exports reached 1.25 million b/d in May 2026, the third consecutive monthly increase following the political transition after President Maduro's removal, according to Reuters shipping data. The United States absorbed 558,000 b/d of total outflows, with India taking 427,000 b/d.
However, Venezuela's capacity to meaningfully substitute for disrupted Hormuz-transiting barrels faces hard structural limits:
- Chronic underinvestment and ageing production infrastructure constrain rapid volume scaling
- Ongoing U.S. policy uncertainty around sanctions frameworks and licensing creates purchase risk for buyers
- Logistical constraints on moving Venezuelan heavy crude to Asian refiners reduce substitutability
Signals That Will Define the Next Price Leg
For investors and analysts tracking the Iran ceasefire and oil markets relationship, the following leading indicators carry the greatest forward-looking significance:
- Hormuz vessel transit volumes – Weekly vessel counts through the strait, as tracked by maritime monitoring services, provide the earliest physical confirmation of normalisation or deterioration.
- Iranian negotiating posture – Whether Tehran moves toward formal engagement with U.S. proposals or continues oscillating between rejection and review is the single highest-impact diplomatic variable.
- IEA global inventory data – Stockpile levels relative to the 5-year seasonal average will determine how much supply buffer exists if re-escalation occurs.
- OPEC+ compliance rates – Adherence to the 188,000 b/d monthly increase schedule signals whether the group maintains market share discipline or pivots back toward price defence.
- U.S. LNG feedgas flows – Currently averaging 16.0 Bcf/d in June, down from 17.1 Bcf/d in May and well below April's all-time high of 18.8 Bcf/d, signalling maintenance-related tightening in global LNG supply.
- Australian LNG industrial action – Workers at the Inpex-operated Ichthys LNG terminal have threatened a full shutdown from June 11 over a wage dispute. Given that the facility represents approximately 10% of Australian LNG export capacity, any prolonged stoppage would compound global supply tightness at a structurally sensitive moment.
The Long View: Structural Changes That Outlast Any Single Agreement
Whatever the diplomatic outcome between the U.S. and Iran, several structural shifts have been accelerated by this conflict that are unlikely to fully reverse regardless of when or how a settlement is reached. As analysts have noted, the volatility triggered by this episode underscores deeper, longer-lasting fractures in global energy infrastructure.
- Persian Gulf tanker routing has been permanently altered for a substantial portion of the global shipping fleet. Analysts warn that traffic patterns may not fully revert to pre-conflict norms even after a ceasefire is confirmed.
- Asian energy import diversification is accelerating, with India, China, and Japan all actively expanding non-Hormuz supply relationships at a pace that will reshape regional trade flows structurally.
- HSBC has identified a potential super-squeeze forming in oil markets, reflecting the confluence of constrained supply, inventory drawdowns, and resurgent demand as the summer peak approaches.
- Bernstein has set a long-term oil price target of $75 per barrel, implying eventual significant normalisation from current elevated levels, but only under conditions where geopolitical risk fully dissipates and OPEC+ supply increases materialise as planned. Both assumptions carry substantial uncertainty.
The IEA has warned explicitly that global crude stocks are on course for historically low levels ahead of the summer demand peak. That warning, combined with the 6 to 8 month Hormuz recovery timeline, the LNG tightening from Australian industrial action risk, and the Russian refinery paradox, creates a supply environment with fewer safety valves than price levels currently suggest.
Summary Data Table: Key Metrics at a Glance
| Metric | Value | Implication |
|---|---|---|
| WTI drop on ceasefire news | -$18.43/bbl to $94.52 | Risk premium unwinding |
| Brent drop on ceasefire news | -$15.54/bbl to $93.73 | Parallel bearish signal |
| Rystad re-escalation target | $180/bbl by August 2026 | Extreme tail risk scenario |
| Bernstein long-term target | $75/bbl | Normalisation baseline |
| Brent ceiling during review | ~$95/bbl | Diplomatic uncertainty cap |
| IEA Hormuz recovery timeline | 6-8 months minimum | Lagged supply restoration |
| Hormuz transit requests | 300+ vessels since late April | Partial flow restoration |
| China-bound tanker share | 28% of requests | Asian demand prioritisation |
| Japan crude import decline (April) | -66% | Acute disruption impact |
| Russia seaborne exports (2026 avg.) | 3.46 million b/d | Highest pace since 2022 |
| Russian export value (4-week avg.) | $2.2-2.3 billion/week | Rising revenue despite refinery strikes |
| Venezuela exports (May 2026) | 1.25 million b/d | Third consecutive monthly increase |
| OPEC+ monthly production increase | +188,000 b/d | Market share strategy |
| U.S. LNG feedgas flows (June) | 16.0 Bcf/d | 4-month low |
| Pakistan inflation | 11.7% | Oil shock pass-through |
| India inflation risk at $90/bbl | 4.8% | Growth headwind threshold |
This article is intended for informational and educational purposes only and does not constitute financial, investment, or trading advice. Oil market forecasts referenced herein represent the views of third-party analysts and research firms and involve significant uncertainty. Past price movements are not indicative of future outcomes. Readers should conduct their own independent research before making any investment decisions.
Want to Stay Ahead of the Next Major Resource Discovery Amid Market Volatility?
While geopolitical shocks continue to reprice energy markets in real time, Discovery Alert's proprietary Discovery IQ model scans ASX announcements daily, delivering instant alerts on significant mineral discoveries so subscribers can identify actionable opportunities before the broader market reacts — explore the historic returns major discoveries have generated or start your 14-day free trial today.