
July 24, 2026
Why Energy Markets Keep Getting Geopolitical Risk Wrong
There is a recurring pattern in how financial markets process prolonged geopolitical crises. In the early days of a conflict, risk premiums spike. Headlines dominate trading desks. Volatility indexes jump. Then, when the immediate catastrophe fails to materialise on schedule, something more dangerous sets in: markets begin to assume the worst will never arrive. This cognitive drift, sometimes called duration bias, is arguably more hazardous than the original panic, because it creates the conditions for a severe, sudden repricing when physical reality finally catches up with financial assumptions.
The Iran conflict oil supply disruption risk represents exactly this kind of structural mispricing event. The question is not whether disruption risk exists — it does. The more important question is whether markets are giving that risk the weight it deserves, or whether weeks of relative stability have lulled participants into dangerous complacency.
When big ASX news breaks, our subscribers know first
The Strait of Hormuz: A Bottleneck Without a Substitute
To understand the scale of what is at stake, it helps to start with the physical geography. The Strait of Hormuz is a narrow waterway connecting the Persian Gulf to the Gulf of Oman, measuring approximately 33 nautical miles at its narrowest navigable point. Despite its modest dimensions, it carries a disproportionate share of the world's energy trade.
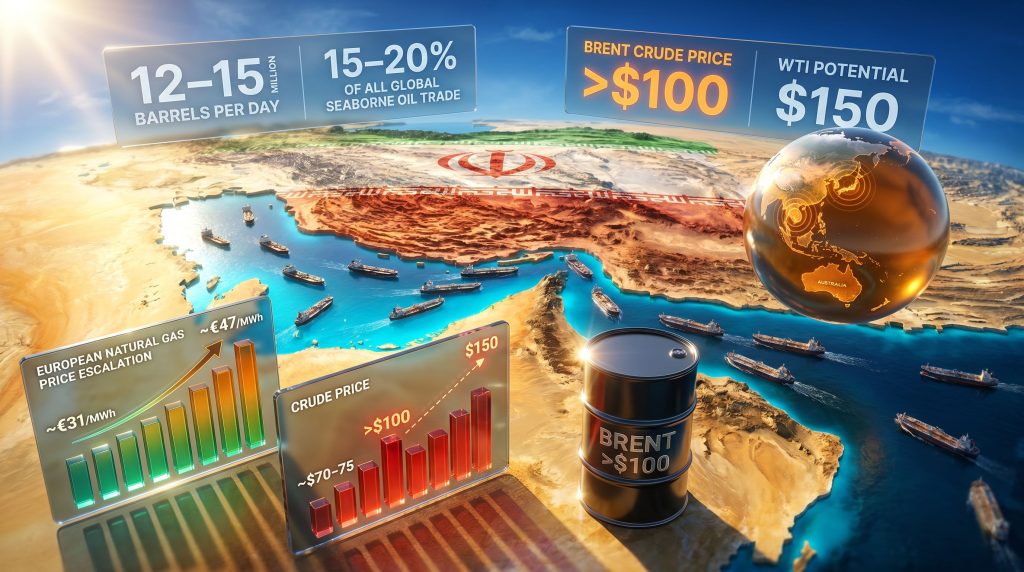
Approximately 12 to 15 million barrels of crude oil and refined petroleum products transit this corridor every day, representing somewhere between 15 and 20 percent of all seaborne crude oil trade globally. The LNG supply outlook is similarly significant, with approximately 81 million tonnes of LNG annually passing through the strait, accounting for roughly 20 percent of global LNG supply.
The critical issue is not simply volume — it is replaceability. No alternative route offers a meaningful near-term substitute for Hormuz-dependent traffic at scale.
Why Alternative Routes Fall Short
The most commonly cited alternative is rerouting tankers around the Cape of Good Hope in southern Africa. While physically viable, this option introduces substantial operational friction:
- Each rerouted voyage adds 10 to 14 days of transit time, significantly increasing per-barrel delivery costs
- Additional fuel consumption per voyage raises the marginal cost of each delivered barrel
- Port congestion at alternative terminals creates secondary bottlenecks that compound initial delays
- Insurance markets have withdrawn coverage from Gulf routes, meaning even willing operators face barriers to movement
Saudi Arabia has activated alternative overland pipeline infrastructure to partially compensate for reduced Hormuz throughput. This offers some relief, but pipeline capacity cannot absorb the full volume of seaborne traffic. The structural reality is that the Strait of Hormuz remains, at present, functionally irreplaceable.
What the Iran Conflict Has Actually Done to Energy Prices
The price moves since the onset of the conflict have been substantial, though the market's interpretation of what they represent remains contested. Crude oil price trends have shifted dramatically, and furthermore, crude oil price trends continue to reflect the ongoing uncertainty surrounding Hormuz throughput.
| Metric | Pre-Conflict Baseline | Level at Time of Analysis | Change |
|---|---|---|---|
| Brent Crude ($/barrel) | ~$70–75 | North of $115 | +50%+ |
| WTI Crude (projected stress scenario) | ~$65–67 | Potential $150 | +100%+ |
| European Natural Gas (€/MWh) | ~€31 | ~€47 | +52% |
| U.S. Diesel ($/gallon) | Baseline | +$0.50 | ~+20% |
| Risk Premium (partial closure) | $0 | $4–6/barrel | New structural floor |
Note: Price levels reflect conditions as discussed in early May 2026. Energy prices are volatile and subject to rapid change. This table should not be interpreted as investment advice or as a guaranteed forecast of future price movements.
Understanding the Risk Premium Concept
A risk premium in commodity markets represents the additional price that buyers will pay above the "expected value" price to insure against a low-probability but high-impact supply shock. Currently, analysts estimate that $4 to $6 per barrel of the prevailing Brent price reflects Hormuz disruption risk rather than current physical supply conditions.
This is actually a relatively modest premium given the scale of potential disruption. It implies that markets are pricing in a partial disruption as the base case, with full closure treated as a low-probability tail risk. Whether that probability weighting is correct is precisely the debate at the heart of the Iran conflict oil supply disruption risk assessment.
The International Energy Agency has characterised the current disruption as among the most significant supply shocks in modern energy market history, noting that even coordinated strategic reserve releases have failed to fully stabilise prices. When emergency mechanisms designed for exactly this kind of crisis prove insufficient to contain price movements, it signals that the physical imbalance is deeper than standard models anticipated.
The Three Reasons Markets Are Likely Underestimating This Risk
A fundamental tension has emerged in global financial markets. Major equity indices continue to trade near all-time highs even as Brent crude has broken decisively above $100 per barrel and pushed toward $115. Historically, these two conditions — rising energy prices and elevated equity valuations — have not coexisted for extended periods without one correcting sharply.
1. The Floating Inventory Illusion
When Hormuz traffic began to slow in the weeks after the conflict escalated, there was no immediate shortage. Tankers already at sea, storage facilities along delivery routes, and onshore stockpiles created a visible buffer. Markets interpreted the absence of immediate disruption as evidence of systemic resilience.
The critical error in this reasoning is treating a finite, depleting buffer as evidence of structural adequacy. Saudi Arabia, the UAE, and Qatar each engaged in significant pre-conflict inventory building. This strategic stockpiling temporarily insulated downstream markets from the full impact of reduced Hormuz throughput. That buffer is now actively depleting and is not being replenished at normal rates.
2. Conflict Fatigue and Duration Bias
Extended geopolitical standoffs condition markets to discount ongoing risk. The psychological mechanism is straightforward: when a feared outcome repeatedly fails to materialise, the brain updates its probability estimate downward, even when the underlying risk drivers have not changed. The Ukraine-Russia conflict provides a relevant precedent — initially expected to resolve within weeks, that conflict has now extended beyond four years.
The Iran standoff presents structurally similar dynamics: a confrontation with no clear resolution pathway, where each passing week without catastrophe further entrenches market complacency. Consequently, this oil market disruption may be more severe than current pricing implies, and the oil market disruption dynamic is compounded by pre-existing trade tensions.
3. The Confidence Trap of Partial Functionality
The Strait of Hormuz has not been fully closed. Vessels are still transiting, albeit at significantly reduced volumes. Saudi Arabia's pipeline alternative is partially operational. These facts are accurate. However, the danger is that partial functionality gets interpreted as near-normal functionality. The relevant question is not whether some oil is moving through the region, but whether the rate of movement is sufficient to replenish the inventories currently masking the supply gap.
How Supply Chain Disruption Cascades Beyond Crude Oil
The direct effect of Hormuz disruption on crude oil prices is well understood. What is less commonly discussed is the second and third-order impact on industries that depend on energy inputs or Gulf-sourced petrochemical feedstocks. Supply chain disruptions are already rippling across food, chemical, and manufacturing sectors globally.
Sectors Facing Compounding Pressure
- Aviation: Jet fuel supply constraints have forced airlines to add fuel surcharges and, in some cases, evaluate route viability. In regions with high Middle Eastern fuel supply dependency, this creates operational planning uncertainty.
- Mining operations: Resource extraction businesses are operationally intensive. Fuel represents a significant proportion of operating costs, and even modest supply disruptions affect productivity and unit economics in ways that may not yet be reflected in equity valuations.
- Agriculture: Fertiliser production depends on urea, sulfur, and petrochemical feedstocks that are either sourced from or transported through Gulf supply chains. Early evidence of sulfur supply constraints has already been noted at industrial scale, with at least one Indonesian smelter reporting a shutdown attributable to sulfur cost and availability issues.
- Manufacturing: Petrochemical input shortages are beginning to affect production scheduling across multiple sectors with Gulf supply chain exposure.
The Fly-In, Fly-Out Mining Vulnerability
A specific and underappreciated operational risk has emerged for resource extraction industries in the Asia-Pacific region. Many Australian mining operations depend on fly-in, fly-out (FIFO) workforce models, where employees are transported by aircraft to remote sites on rotating schedules.
This model creates a compounding vulnerability when aviation fuel supply tightens. Jet fuel and aviation gasoline constraints do not need to reach shortage levels to create operational problems. Even moderate supply friction or price surges can disrupt workforce rotations, reduce headcount at operational sites, and temporarily lower production throughput. The downstream effect on production volumes, and therefore earnings per share, may not yet be reflected in equity valuations for affected companies.
This is not a prediction of industry collapse. It is a recognition that operational leverage in mining means small disruptions to input supply can have disproportionate effects on output and profitability. A non-zero probability of this outcome, if currently priced as zero by the market, represents a genuine valuation gap.
Regional Exposure: Which Geographies Face the Greatest Risk?
Not all regions are equally exposed to Iran conflict oil supply disruption risk. The structural characteristics of different energy markets create significantly different vulnerability profiles.
Asia-Pacific: Structurally the Most Exposed
The Asia-Pacific region carries the highest structural exposure to a sustained Hormuz disruption. Australia, Japan, South Korea, and most Southeast Asian economies are disproportionately dependent on Middle Eastern crude imports for their refining and energy systems. Unlike North America or northern Europe, these economies have fewer alternative supply corridors and limited domestic hydrocarbon production to buffer against sustained disruption.
Indicators of emerging stress in Australia are already visible at the policy level. Legislative discussions in South Australia examining penalties for fuel hoarding reflect policymaker awareness that supply constraints are a plausible near-term scenario. Fuel hoarding legislation is not a precautionary bureaucratic exercise — it signals that government planners are actively gaming shortage scenarios and attempting to manage social responses in advance.
North America: Better Positioned, Not Immune
Canada and the United States benefit from substantial domestic hydrocarbon production, which meaningfully reduces direct import dependency on Middle Eastern crude. Canada in particular maintains a diverse and largely self-sufficient energy base, giving it structural resilience that most other OECD economies cannot match.
However, global oil price linkage means that even significant net exporters face higher domestic energy costs when Brent surges. Inflation effects, consumer spending compression, and industrial input cost increases flow through the broader economy regardless of domestic production levels.
Europe: Dual Exposure Through LNG
European energy markets face combined pressure from crude oil price inflation and LNG supply disruption. The movement in European natural gas prices from approximately €31/MWh to approximately €47/MWh — a jump of roughly 52 percent — reflects partial but arguably still incomplete repricing of Hormuz-related LNG supply risk. European consumers and industrial users are absorbing a secondary shock that compounds the direct crude oil price impact.
The next major ASX story will hit our subscribers first
Scenario Analysis: From Partial Disruption to Full Closure
Constructing a range of scenarios for the Iran conflict provides a more structured framework for assessing probability-weighted risk than simply tracking day-to-day price movements.
| Scenario | Probability Assessment | Estimated Price Impact | Key Trigger |
|---|---|---|---|
| Current state (reduced flows, partial disruption) | Ongoing baseline | Brent above $100, $4–6 risk premium | Inventory depletion continuing |
| Sustained harassment, limited military activity | Moderate | WTI toward $120–150 | Insurance market withdrawal accelerates |
| Full closure of the strait | Low but non-zero | Unprecedented spike, no historical ceiling | Direct military interdiction |
| Negotiated diplomatic resolution | Possible but timeline uncertain | Rapid risk premium compression, normalization | Verified diplomatic progress |
Disclaimer: Scenario probability assessments are illustrative frameworks, not predictive models. They reflect general analytical reasoning and should not be used as the basis for investment decisions without independent professional advice.
The 4 to 6 Week Inventory Depletion Window
The most actionable near-term indicator is the rate at which the pre-conflict inventory buffer depletes. Energy market analysts tracking weekly IEA and EIA inventory data have identified a critical window: if current reduced Hormuz throughput persists without resolution, the stockpile buffer built by Gulf producers ahead of the escalation could be substantially exhausted within 4 to 6 weeks of sustained disruption.
Beyond this window, the character of price discovery shifts fundamentally. Instead of a risk premium — meaning fear of future shortages — markets would begin responding to actual physical scarcity. This transition typically produces significantly more volatile and difficult-to-predict price behaviour, and the associated market volatility risks could ripple well beyond energy markets into broader financial conditions.
Why Full Closure Remains Unlikely But Cannot Be Dismissed
A complete Strait of Hormuz shutdown carries a structural self-deterrent: Iran relies on Gulf transit corridors for its own export revenue. Total closure would damage Iranian economic interests alongside everyone else's. However, targeted harassment of commercial tanker traffic, coordinated insurance market pressure, or limited military actions could achieve functionally similar supply disruption outcomes without requiring a formal declaration of closure.
How Investors Should Frame This Risk
The investment calculus around the Iran conflict is asymmetric in a way that current equity market pricing does not appear to fully reflect. In addition, the broader commodity volatility hedging environment has grown considerably more complex for portfolio managers navigating this landscape.
Consider the two primary outcomes:
- Rapid resolution: Risk premiums compress, energy prices normalise, equity markets consolidate or rally modestly from current levels. The upside for investors who reduced risk exposure is limited but the cost of caution is low.
- Sustained or escalating disruption: Physical shortages materialise as inventories deplete, the gap between equity valuations and energy market reality closes sharply, and a repricing event of potentially 40 to 50 percent becomes plausible in operationally exposed sectors.
The asymmetry here is significant. Missing a modest upside from quick resolution carries a defined and limited cost. Remaining fully exposed to a sustained disruption scenario carries a potentially severe and uncertain cost. When the downside is substantially larger than the upside, reducing exposure is rational even if the probability of the bad outcome is below 50 percent.
The Role of Seasonality in the Timing Picture
Historical seasonal patterns in commodity markets add a secondary dimension to this risk framework. Commodities and gold tend to see their strongest seasonal support in Q1 and into Q2. Oil historically maintains seasonal tailwinds through approximately July. As the calendar moves past the prime seasonal window, a structural support that has been partially sustaining current price levels begins to fade.
Technical Market Structure as an Early Warning
Beyond fundamental analysis, technical market structure is providing its own cautionary signals. Across several commodity indices, markets are forming lower highs, meaning each successive rally peak is failing to exceed the previous one. Lower highs preceding lower lows are a classic signal of trend deterioration. Monitoring whether key support levels established in March hold will be important for assessing whether a more significant correction is developing beneath the surface.
Portfolio Positioning Principles for Prolonged Uncertainty
- Prioritise companies with near-term, company-specific catalysts that can generate independent price performance regardless of broader market direction. In an environment where sectoral momentum has faded, stock selection quality matters far more than it did during last year's commodity rally.
- Reduce exposure to operationally leveraged businesses in Asia-Pacific regions with high Hormuz supply dependency, particularly those dependent on FIFO workforce models or energy-intensive production processes.
- Maintain elevated cash reserves as strategic optionality. Cash is not simply defensive posturing; it is dry powder for deploying into better-priced opportunities that a repricing event would create.
- Monitor technical chart structure for lower lows forming below March support levels, which would signal a more sustained correction rather than a temporary consolidation.
- Favour geographies with domestic energy resilience for resource sector exposure. North America, and Canada in particular, offers structural insulation from Hormuz supply disruption that most Asia-Pacific economies cannot match.
Key Indicators to Watch
For investors and analysts tracking how the Iran conflict oil supply disruption risk evolves, several specific data streams provide early warning signals.
Signs That Risk Is Deepening
- AIS tanker tracking data through the Strait of Hormuz, showing whether traffic volumes are recovering, stable, or declining further
- Weekly IEA and EIA inventory reports revealing the rate at which the pre-built stockpile buffer is depleting
- P&I club and marine insurance availability for Gulf routes, where withdrawal of coverage functions as a de facto operational closure even when the strait remains physically open
- Industrial curtailment announcements, particularly from energy-intensive smelting, refining, or manufacturing operations in Southeast Asia with documented Gulf supply chain exposure
- Government fuel management legislation in Asia-Pacific nations, where policy-level emergency planning reveals how policymakers privately assess shortage probability
Signs That Risk Is Abating
- Verified, credible diplomatic engagement between relevant parties with independently confirmed progress
- Resumption of normal insurance coverage for Gulf tanker routes by major underwriters
- IEA inventory data showing stabilisation rather than continued depletion
- Saudi Arabia's alternative pipeline infrastructure absorbing a meaningfully larger share of displaced Hormuz volumes
The Market Is Not Pricing a Non-Zero Risk as Non-Zero
The core analytical case for treating the Iran conflict as an underpriced risk is not that a catastrophic outcome is certain or even likely. It is that the probability of a sustained disruption, while perhaps modest, is clearly above zero, and current equity market levels appear to be treating that probability as if it were zero.
There is an important distinction between a risk being "priced in" and being "fully reflected." A market can acknowledge a risk exists, assign it a small probability weight, and still systematically underestimate it if the probability weight is lower than the actual evidence warrants.
The presence of South Australian fuel hoarding legislation, the documented depletion of floating inventory buffers, the withdrawal of marine insurance from Gulf routes, and the early industrial shutdowns in Southeast Asian smelting operations are not theoretical risks. They are observable, early-stage manifestations of exactly the disruption pathway that markets appear to be discounting.
The prudent approach is neither to assume catastrophe nor to dismiss the risk because it has not yet fully materialised. It is to recognise that the asymmetry between the cost of being cautious and the cost of being wrong about the downside argues for positioning that reflects the genuine uncertainty of an unresolved conflict with no visible resolution timeline.
Markets have a tendency to price geopolitical risk as transient until it proves structural. By the time that transition becomes undeniable, the repricing has already begun.
This article is for informational purposes only and does not constitute financial, investment, or professional advice. All price projections, scenario analyses, and market assessments involve inherent uncertainty and should not be relied upon as predictions of future outcomes. Readers should consult qualified financial advisors before making investment decisions. Energy markets are subject to rapid and unpredictable change driven by geopolitical, regulatory, and market forces outside any individual's control.
Want to Stay Ahead of the Market Opportunities Created by Global Commodity Disruptions?
Discovery Alert's proprietary Discovery IQ model delivers real-time alerts on significant ASX mineral discoveries, instantly translating complex market conditions into actionable investment insights — explore historic examples of major discovery returns to understand the scale of opportunity, then begin your 14-day free trial at Discovery Alert to position yourself ahead of the broader market.