
August 1, 2026
When Chokepoints Fail: The Architecture of the World's Most Severe Energy Supply Crisis
Energy market historians often frame supply shocks in terms of singular events: an embargo, a war, a pipeline rupture. What makes the current Iran war oil supply disruption categorically different is not just its scale but its structural nature. The Strait of Hormuz is not merely a shipping lane. It is the single most concentrated node in the entire global energy system, and when that node contracts, there is no architectural redundancy capable of absorbing the loss.
Understanding why this crisis has unfolded the way it has requires examining the physical geography, the market mechanics, and the behavioural responses that have rippled outward from a single 33-kilometre-wide waterway in the Persian Gulf. Furthermore, the crude oil price trends emerging from this conflict are reshaping long-held assumptions about energy security architecture worldwide.
When big ASX news breaks, our subscribers know first
From Surplus to Historic Deficit: The Fastest Market Reversal in Modern History
Entering 2026, energy analysts were broadly aligned on a cautious outlook: global oil markets were drifting toward mild oversupply, with OPEC's market influence fraying at the edges and U.S. shale output holding firm. Price forecasts clustered in a moderate range, and few commodity desks were modelling scenarios that involved existential supply disruption.
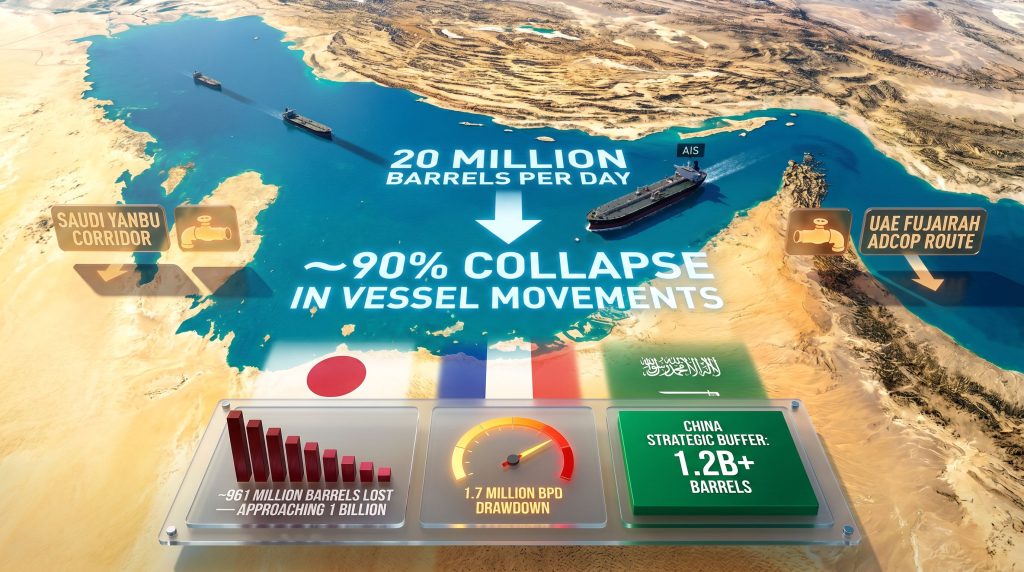
That baseline was erased within weeks of U.S.-Israeli military operations commencing on February 28, 2026. The conflict immediately began constraining the Strait of Hormuz, the narrow waterway through which approximately 20 million barrels per day (bpd) of crude oil, condensate, LNG, LPG, and refined products normally transit. That single corridor represents roughly 20% of all global energy trade by volume.
The IEA has formally classified what followed as the largest supply disruption in the recorded history of the global oil market. By late May 2026, cumulative crude and condensate supply losses had surpassed 1 billion barrels, according to Kpler shipping data, with the daily production gap sitting at more than 10 million bpd compared to pre-war baseline flows. For context, this exceeds the entire daily output of the United States, the world's largest individual oil producer.
No coordinated OPEC production response, no U.S. shale acceleration, and no West African supply push can arithmetically close an 11 million bpd gap. The supply void created by this conflict has no historical precedent and no short-term substitute.
The feedback loop that accelerated production curtailments is worth understanding in detail:
- Tanker traffic through the Strait of Hormuz collapsed by approximately 90% as conflict risk escalated.
- With export routes effectively closed, Middle Eastern producers faced rapid storage saturation.
- Storage saturation forced upstream production shut-ins across Saudi Arabia, Iraq, Iran, Kuwait, and the UAE.
- Shut-in production compounded the supply losses already caused by physical export blockage.
- Each week of continued restriction added another layer of cumulative loss that inventories had to absorb.
According to Kpler analyst Naveen Das, seasonal demand dynamics are adding a further complication, with summer cooling requirements in the Middle East creating incremental regional supply pressure that partially offsets any marginal production recovery, while simultaneously threatening to accelerate organic demand destruction in high-price environments.
The Hormuz Chokepoint: Geography as Destiny
The Strait of Hormuz sits between Oman and Iran at its narrowest point, with navigable shipping channels only a few kilometres wide in each direction. Its strategic importance is a product of pure geography: the majority of Saudi Arabia, Iraqi, Kuwaiti, UAE, Qatari, and Iranian export infrastructure drains toward the Persian Gulf, making Hormuz the unavoidable exit point.
The nations most structurally exposed to a Hormuz disruption include:
- Japan and South Korea, which collectively derive a substantial share of their crude oil and LNG from Gulf suppliers
- India, whose rapid economic expansion has increased its dependence on affordable Gulf crude
- China, the world's largest crude importer by volume
- Taiwan, heavily reliant on Gulf LNG for power generation
- European importers, who receive both Gulf crude and Qatari LNG cargoes
Bypass Routes: Partial Relief, Not a Solution
Two primary bypass mechanisms exist for moving Gulf energy exports without transiting Hormuz:
- Saudi Arabia's Yanbu terminal on the Red Sea, connected to Gulf production fields via the East-West Pipeline. Yanbu provides meaningful bypass capacity but falls well short of offsetting full Hormuz throughput.
- The UAE's Abu Dhabi Crude Oil Pipeline (ADCOP) running from Habshan to the port of Fujairah on the Gulf of Oman. ADNOC has announced plans to approximately double Fujairah bypass capacity through a new pipeline targeting completion by 2027.
Even with both corridors operating at maximum capacity, the combined bypass volume represents a fraction of the 20 million bpd that previously transited Hormuz. The infrastructure gap between existing alternatives and the disrupted volume is measured in millions of barrels per day, not thousands.
Inventory Collapse: The Countdown Clock on Market Stability
The critical question dominating energy market analysis is not whether inventories are falling, it is how quickly, and how much cushion remains before supply shortfalls translate into physical unavailability rather than merely higher prices.
| Metric | Data Point | Timeframe |
|---|---|---|
| Cumulative Middle East supply losses | ~961 million barrels (1 billion+ by end of May) | As of late May 2026 |
| Estimated daily supply gap | ~11 million bpd vs. pre-war baseline | Ongoing |
| Global inventory drawdown rate (early May) | ~1.5 million bpd | Early May 2026 |
| Global inventory drawdown rate (late May) | ~1.7 million bpd | Late May 2026 |
| IEA emergency reserve release | 400+ million barrels | Announced response |
| China strategic buffer stocks | 1.2+ billion barrels | Prior 12-month buildup |
The acceleration in the drawdown rate, from 1.5 million bpd to nearly 1.7 million bpd within a matter of weeks, is a critical signal. It indicates that the initial buffers are eroding faster than replacement supply or diplomatic resolution can compensate for.
China's Strategic Buffer: The Outlier Reshaping the Price Ceiling
China's relative insulation from the immediate supply shock is one of the most analytically significant features of this crisis. Over the twelve months preceding the conflict, China accumulated over 1.2 billion barrels in a combination of strategic and commercial reserves, a deliberate pre-positioning that has allowed Chinese refiners to continue operating at near-normal throughput rates while the rest of Asia faces acute tightness.
This divergence explains much of why oil prices have not yet reached $150 per barrel despite a supply disruption of historic scale. China, as the world's largest oil importer, is temporarily absent from the spot market as a distressed buyer, reducing incremental demand pressure that would otherwise amplify price spikes. However, this buffer has a finite duration. Duration modelling based on China's consumption rates and the size of its stockpile suggests that absent Hormuz recovery, Chinese reserve drawdown will eventually force a return to aggressive spot market buying, at which point the pricing dynamic could shift sharply.
The SPR Arithmetic Problem
The IEA's coordinated release of more than 400 million barrels from member nation strategic petroleum reserves represents the largest emergency deployment in the organisation's history. However, straightforward arithmetic reveals the limitation of this instrument.
At a supply gap of 11 million bpd, even the full 400 million barrel release provides roughly 36 days of complete offset. At the more realistic deployment rate of partial offset against a 1.7 million bpd inventory drawdown acceleration, the runway extends somewhat but remains measured in weeks, not months. Strategic reserve releases are fundamentally price-stabilisation tools, not genuine supply replacement mechanisms. Their function is to buy time for either diplomatic resolution or alternative supply mobilisation, not to permanently bridge a structural deficit.
Qatar's LNG Catastrophe: A Five-Year Supply Shadow
While crude oil has captured most of the market attention, the damage to global LNG supply represents an arguably more durable disruption. Qatar suspended LNG exports as early as March 2, 2026, following Iranian missile strikes on the Ras Laffan industrial complex, the world's single largest liquefaction facility.
Qatar subsequently advised that full restoration of export capacity to pre-war levels could take up to five years, with estimated annual revenue losses of approximately $20 billion per year. This is not a temporary shutdown. It is a decade-scale structural reduction in global LNG supply capacity.
| Region | LNG Dependency | Exposure Level |
|---|---|---|
| Japan | Power generation and industrial feedstock | Critical |
| South Korea | Baseload power and petrochemicals | Critical |
| Taiwan | Power generation | High |
| Europe | Post-Russia diversification supply | High |
| South Asia (India) | Industrial and power sector growth | Moderate-High |
Japan's situation crystallises the compounding nature of the crisis. Japanese crude imports fell 66% in April 2026, reflecting simultaneous disruption to both crude oil and LNG supply chains. For an economy that imports virtually all of its energy, this represents an acute industrial supply emergency.
Europe faces a structurally painful dual exposure. Already managing the residual effects of Russian pipeline gas disruption since 2022, European buyers are now absorbing a second simultaneous LNG supply shock. UK household energy bills are projected to rise 13% as gas prices transmit through retail pricing mechanisms, while German power prices have surged 30% on combined demand and tightness factors.
European buyers have pivoted aggressively toward U.S. LNG, Canadian LNG, and Australian LNG as emergency alternatives. However, total global liquefaction capacity additions cannot rapidly compensate for the volume removed by Ras Laffan's partial incapacitation. India's central bank has formally flagged that the sustained energy price shock poses a material downside risk to the country's GDP growth trajectory.
Dark Mode Shipping: When the Tracking System Breaks
One of the least discussed but most consequential second-order effects of the Iran war oil supply disruption has been the transformation of tanker operations in and around the Strait of Hormuz. According to Reuters, this disruption compares unfavourably with every past supply shock on record, including the 1973 Arab oil embargo.
Definition: AIS-off or dark-mode operation refers to vessels disabling their Automatic Identification System transponders, making them invisible to satellite tracking and coastal monitoring infrastructure. Before this conflict, the practice was almost exclusively associated with sanctions-evasion by Iran-linked and Russia-linked vessels.
Maritime analytics data from Vortexa documents a fundamental behavioural shift. AIS-off transits through Hormuz are no longer a niche sanctions-evasion signal. They have become a mainstream commercial response to conflict risk, with non-sanctioned vessels carrying crude oil, clean petroleum products, LPG, and LNG all operating without transponder visibility as a routine operational decision.
The implications extend well beyond shipping logistics:
- Real-time crude oil flow tracking becomes unreliable when the vessels carrying those flows are invisible to satellite monitoring systems.
- Inventory estimates at destination ports become less precise when cargo arrival timelines cannot be confirmed.
- Refinery supply assessments lose accuracy when feedstock delivery schedules are obscured.
- Regional product availability models become less reliable when clean product movements also go dark.
- Destination-level demand reads are compromised across the entire supply chain, from crude through to refined product markets.
The practical result is that the information infrastructure traders and analysts rely on to price oil markets in real time has been significantly degraded precisely at the moment when accurate data is most critical. Markets respond to information uncertainty by embedding a risk premium into prices, which means dark-mode shipping itself contributes to price volatility as a self-reinforcing mechanism.
The commercial calculus for shipowners willing to transit Hormuz in dark mode reflects the extraordinary financial incentives on offer. War risk insurance premiums for Hormuz transits have escalated dramatically, raising effective freight costs. However, tanker rates for vessels willing to accept that risk have spiked correspondingly, creating a cohort of specialised operators for whom conflict-zone transits at premium rates remain financially rational decisions despite the elevated danger.
The next major ASX story will hit our subscribers first
Regional Economic Fallout: Transmission Channels Beyond Energy
| Country/Region | Key Impact | Specific Data Point |
|---|---|---|
| Japan | Crude import collapse | Imports fell 66% in April 2026 |
| India | Growth threat | Central bank warned of material GDP risk |
| Philippines | Supply improvisation | First Iranian crude cargo received post-blockade |
| China | Relatively insulated near-term | 1.2B+ barrel strategic buffer |
| South Korea | LNG dependency exposure | Heavy reliance on Qatar LNG |
| UK | Consumer energy cost surge | Household bills projected up 13% |
| Germany | Power price spike | Prices surged 30% |
The Philippines receiving its first Iranian crude cargo since the Hormuz blockade began is a revealing data point about how global supply chains are improvising under stress. Buyers who would not typically source Iranian crude are now willing to accept it, a signal of how acute tightness is overriding procurement preferences.
The energy price shock is also transmitting into manufactured goods inflation through Chinese factory export prices. As oil market disruption escalates across Chinese manufacturing input costs, the prices of exported goods rise, embedding energy inflation into the global consumer price index through trade channels. The Kansas Federal Reserve President has explicitly warned that the oil price shock may not prove transitory, a significant signal that U.S. central bankers are taking seriously the possibility of persistent inflationary pressure rather than a brief spike.
Fertiliser markets face compounding pressure, since natural gas is the primary feedstock for nitrogen fertiliser production. A sustained gas price shock transmits through fertiliser costs into food production economics, creating a second-order food security dimension to the energy disruption.
Price Architecture: The $150 Question and the Buffers Holding It Back
Three structural buffers have prevented oil prices from reaching the $150+ per barrel level that several supermajor analysts have identified as a plausible ceiling scenario:
- China's strategic stockpile, which has insulated the world's largest importer from spot market pressure in the near term.
- IEA emergency reserve releases totalling more than 400 million barrels, providing partial offset and price stabilisation.
- Demand destruction in price-sensitive emerging markets, where high prices organically reduce consumption, partially closing the supply-demand gap from the demand side.
Bernstein Research has set a long-term oil price target of $75 per barrel, a figure that explicitly assumes conflict resolution and Hormuz reopening rather than continued disruption. Meanwhile, multiple supermajor analyst teams have warned that prices could reach $160 per barrel within weeks if inventory buffers are exhausted without supply recovery. The spread between these two forecasts illustrates how entirely the price trajectory depends on diplomatic rather than fundamental variables.
Oil prices demonstrated this sensitivity dramatically when ceasefire negotiation headlines triggered sharp selloffs in crude futures, with markets projecting a potential 19% price decline in a single month if a U.S.-Iran diplomatic agreement materialises. This embedded geopolitical risk premium is not a market inefficiency; it accurately reflects the binary nature of the supply outlook. Consequently, the oil price shock implications are already reshaping capital allocation decisions across the entire upstream sector.
Three Trajectories: Scenario Analysis for the Road Ahead
Scenario 1: Diplomatic Resolution
Successful U.S.-Iran ceasefire negotiations and phased Hormuz reopening would trigger a rapid unwinding of the geopolitical risk premium, potentially reducing crude prices by 15 to 20%. However, even under this optimistic scenario, Ras Laffan damage means global LNG supply remains structurally impaired for years. Cumulative inventory depletion creates a multi-year restocking demand cycle that would sustain elevated prices relative to the pre-conflict baseline even after military operations cease.
Scenario 2: Prolonged Stalemate
The most likely near-term path involves continued military operations at reduced intensity, with Hormuz partially restricted rather than fully closed. Crude prices would likely oscillate in a $90 to $120 range, responding to weekly diplomatic signals. Inventory drawdown continues at 1.5 to 1.7 million bpd, progressively eroding the buffer that has prevented a price breakout. Secondary inflationary effects accumulate across manufacturing, food, and transport sectors.
Scenario 3: Escalation and Full Closure
Full Hormuz closure under an escalation scenario would exhaust remaining inventory buffers within 60 to 90 days even with maximum IEA reserve deployment. Oil prices would likely exceed $150 per barrel, with historical precedent suggesting that sustained prices at this level are sufficient to trigger demand destruction severe enough to contribute to global economic contraction. Al Jazeera reports that global oil demand could plunge sharply under precisely this escalation scenario.
Supply-Side Responses: Investment, Infrastructure, and Timeline Reality
The upstream investment response to sustained high prices is already visible:
- U.S. drillers are adding rigs in response to elevated price signals, representing the standard market mechanism for translating high prices into new supply.
- Norway has increased upstream investment forecasts for both 2026 and 2027 as North Sea producers capitalise on the elevated price environment, while also lobbying the EU to reconsider Arctic drilling restrictions.
- The IEA is projecting a $3.4 trillion global energy investment surge as the supply shock accelerates capital deployment decisions across the full upstream value chain.
The critical timing constraint is inescapable: investment decisions made in 2026 will not yield meaningful new production volumes for two to four years. The oil market's supply-side response mechanism operates on geological and engineering timescales, not financial market timescales. This lag between capital commitment and physical production is precisely why sustained inventory drawdown and price pressure can persist long after the investment response has begun. In addition, the broader crude oil price trends suggest this supply tightness may persist well into the latter part of the decade.
Disclaimer: This article contains forward-looking statements, price forecasts, and scenario projections drawn from publicly available analyst research and market data. These statements involve significant uncertainty and should not be construed as financial or investment advice. Energy market conditions, geopolitical developments, and diplomatic outcomes can change rapidly. Readers should conduct independent research and seek professional financial advice before making any investment decisions.
Want To Stay Ahead of the Next Major Resource Discovery?
While geopolitical shocks reshape global energy markets, Discovery Alert's proprietary Discovery IQ model continuously scans ASX announcements in real time, instantly identifying significant mineral discoveries and turning complex data into actionable investment insights — explore historic discoveries and their exceptional returns, then begin your 14-day free trial at Discovery Alert to position yourself ahead of the market.