July 22, 2026
When Bond Market Titans Pivot to Gold, Every Investor Should Pay Attention
There is a particular moment in any major market cycle when the last remaining sceptics convert. Not the perennial gold bugs or the commodities traders who have always held bullion. The real signal comes when deeply analytical, fixed-income specialists, whose entire intellectual framework is built on discounting cash flows and pricing risk through bond markets, begin repositioning significant portions of their portfolios into assets that pay no yield and sit in vaults. That moment, for the current precious metals cycle, appears to be now.
Jeffrey Gundlach on gold is not a headline event. It is the visible expression of a much deeper rethinking of how capital should be structured in an era of fiscal excess, persistent inflation, and eroding monetary credibility. Understanding the reasoning, the data, and the practical implications of his framework is one of the more instructive exercises any investor can undertake in 2026.
When big ASX news breaks, our subscribers know first
The Intellectual Shift Behind Gundlach's Gold Conviction
Gundlach founded DoubleLine Capital in 2009 and built it into one of the most closely followed institutional asset managers in fixed income. His macro commentary carries disproportionate weight precisely because his entire professional framework is oriented around interest rates, credit risk, and monetary conditions. When a bond specialist of this stature repositions toward real assets, the signal carries more analytical weight than the same move made by a generalist investor or a dedicated commodities fund.
His conviction rests on a specific distinction between financial assets and real assets. Financial assets, including stocks and bonds, derive their value from institutional promises, contractual obligations, and counterparty relationships. Real assets hold intrinsic value that exists independently of any government guarantee or institutional solvency. In a system carrying historically elevated debt loads and running above-target inflation, the absence of counterparty risk is not a minor footnote. It is the defining characteristic that makes gold structurally attractive as a portfolio anchor.
What makes the current positioning analytically unusual is not that Gundlach likes gold. It is that DoubleLine's overall portfolio stance represents the firm's most defensive configuration in its 17-year history. A 20% cash allocation, a 20% real asset sleeve, selective exposure to emerging market equities, and minimal domestic U.S. equity concentration is not a tactical overweight. It is a structural statement about the adequacy of traditional portfolio construction in the current macro environment.
From Speculative Fringe to Institutional Mainstream
Gold's investor profile has undergone a genuine transformation over the past decade. In prior cycles, precious metals exposure was associated primarily with retail investors with specific geopolitical concerns or commodity traders running momentum strategies. The current demand composition is structurally different.
Central bank gold buying, sovereign wealth funds, and institutional asset managers are now among the dominant buyers. Retail demand has also broadened, with physical gold selling out at major retailers, reflecting a wider democratisation of the asset class. Gundlach's framing captures this shift precisely: the allocation is coming from serious capital pools acting on fundamental analysis, not from speculative positioning. When the same conclusion is reached simultaneously by sovereign reserve managers, institutional portfolio constructors, and retail investors globally, the underlying thesis deserves serious examination.
What the Numbers Confirm About Gold in 2026
The data landscape surrounding gold in May 2026 presents a consistent picture across multiple independent data sources.
Snapshot Table: Gold Market Fundamentals, May 2026
| Metric | Value | Source |
|---|---|---|
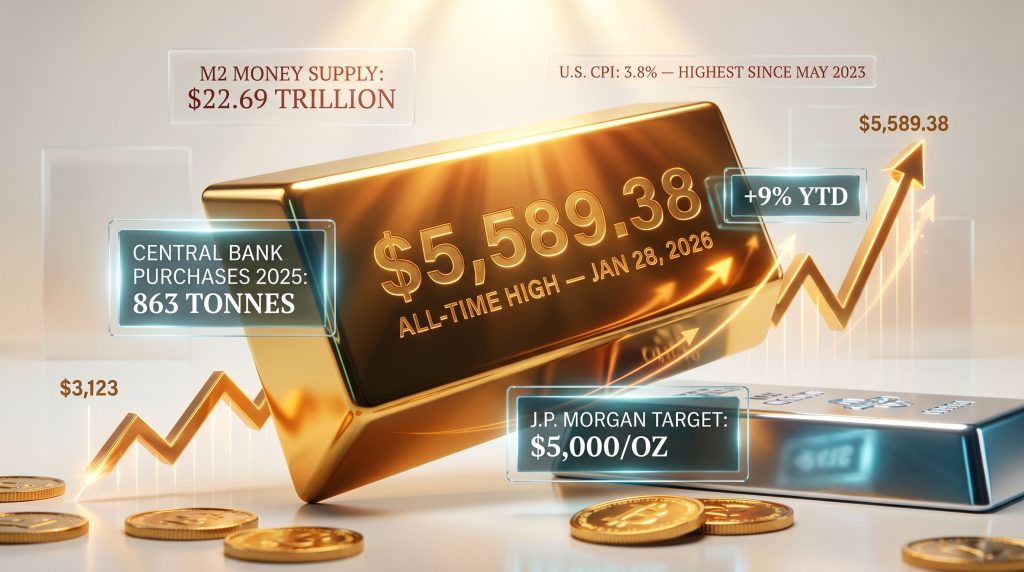
| All-time high closing price | $5,589.38/oz (Jan 28, 2026) | Investing.com |
| Current price range (May 2026) | $4,700 to $4,753/oz | Multiple |
| 52-week low | $3,123/oz | Investing.com |
| Discount from ATH | ~16% | Calculated |
| U.S. M2 money supply (Mar 2026) | $22.69 trillion | Federal Reserve / 247 Wall St. |
| M2 historical percentile | 90.9th percentile | 247 Wall St. |
| U.S. CPI inflation (Apr 2026) | 3.8% (highest since May 2023) | Trading Economics |
| 10-year Treasury yield | 4.36% | 247 Wall St. |
| Global gold demand (2025) | Over 5,000 tonnes | World Gold Council |
| Total 2025 demand value | $555 billion | World Gold Council |
| Central bank purchases (2025) | 863 tonnes | World Gold Council |
| Pre-2022 annual average CB purchases | 473 tonnes (2010-2021 avg) | World Gold Council |
| Q1 2026 central bank purchases | 244 tonnes | World Gold Council |
| J.P. Morgan Q4 2026 price target | $5,000/oz | J.P. Morgan Global Research |
Several of these figures deserve specific attention from a structural perspective.
The 2025 central bank purchase total of 863 tonnes is often cited in isolation. The more meaningful context is the comparison: the 2010-2021 annual average was 473 tonnes. Current purchasing rates are therefore running at roughly 83% above the pre-2022 baseline, sustained across multiple years, and continuing through gold's 16% price correction from its January 2026 peak. Central banks did not reduce purchases when gold fell. They continued buying at the corrected price, which is the most direct possible signal about the durability of their conviction.
The M2 reading at the 90.9th historical percentile is equally significant. Money supply at this level relative to historical ranges indicates that monetary expansion has reached extraordinary proportions. Combined with a CPI reading of 3.8%, the highest since May 2023, the traditional monetary policy framework is being tested at both the inflation and growth dimensions simultaneously.
Why Short-Term Price Movements Mislead Long-Term Investors
A specific dynamic worth understanding is why gold declined on the April 2026 CPI print despite the reading being inflationary. The mechanism is mechanical rather than fundamental. A hot inflation number forces bond markets to reprice rate expectations upward, which briefly strengthens the dollar, which exerts short-term downward pressure on dollar-denominated gold prices. This is a technical response driven by derivatives positioning and algorithmic trading, not a reflection of changing macro fundamentals. The structural case for gold is built on durable forces operating across years, not the knee-jerk responses of futures markets to individual data prints.
The Three Macro Forces Compounding Each Other
Gundlach's gold thesis is not driven by a single catalyst. It is built on three interlocking forces that individually would be significant and collectively represent an unusual convergence.
Force 1: The Fiscal Arithmetic Problem
U.S. federal debt is on a trajectory that creates an unavoidable arithmetic problem. At current interest rate levels, applied to a growing debt stock, annual interest expense is consuming an increasing share of federal revenue. M2 at $22.69 trillion and the 90.9th historical percentile tells the story numerically: the money supply has been expanded aggressively and the consequences are now embedded in the price level.
The critical insight in Gundlach's framework is that governments facing genuine fiscal stress have a limited set of options. They can raise taxes, cut spending, grow their way out, or monetise the debt through currency expansion. The political and structural barriers to the first three options are well-documented. The path of least resistance, historically, has been the fourth. Debt monetisation reduces the real value of outstanding obligations by depreciating the currency, which is precisely the environment in which gold's purchasing power preservation characteristics become most valuable.
The fact that DoubleLine sits at its most defensive portfolio positioning in 17 years, including two global financial crises and a pandemic, suggests the firm's internal risk assessment places current macro fragility in a category of its own.
When a fixed-income specialist with 17 years of institutional history moves to their most defensive posture on record, the signal extends well beyond any single asset class allocation.
Force 2: Structural Dollar Vulnerability
Gold is priced in U.S. dollars. A structurally weakening dollar is therefore a direct mechanical tailwind for gold prices measured in most other currencies. Gundlach identifies dollar weakness as one of his defining macro themes, driven by a combination of factors that are structural rather than cyclical.
Geopolitical fragmentation is accelerating the shift away from dollar-denominated reserves and trade settlement systems. This de-dollarisation process does not unfold in months. It operates over decades. However, the direction is established, and its implications for gold demand are direct: as sovereigns reduce dollar exposure, they require alternative reserve assets, and gold is the only reserve asset with sufficient historical credibility, liquidity, and political neutrality to absorb that reallocation at scale.
The Federal Reserve's constrained position amplifies this dynamic. With inflation at 3.8% and economic growth concerns simultaneously present, the Fed is effectively caught between its inflation mandate and its growth stabilisation role. According to Business Insider, Gundlach's assessment is that no Fed rate cuts are likely through 2026, contrary to market consensus that had priced for easing. A Fed that cannot act to support the economy constrains dollar strength and simultaneously limits the government's ability to manage debt costs, creating a recursive pressure loop that benefits real assets.
Force 3: Sovereign-Scale Reserve Reallocation
The most analytically definitive of the three forces is the scale and persistence of central bank gold accumulation. Central banks operate on entirely different time horizons than any other class of market participant. A reserve management decision made in 2025 reflects policy commitments that typically persist for five to ten years or longer. These are not momentum trades or tactical rebalances.
The World Gold Council's 2025 Central Bank Survey provided two data points that should be understood as genuinely significant:
- 95% of respondents expected global official gold reserves to grow over the following 12 months
- 43% of central banks indicated plans to expand their own gold holdings, a record reading in the survey's history
Combined with 863 tonnes purchased in 2025, nearly double the 2010-2021 annual average, and Q1 2026 purchases of 244 tonnes continuing through a 16% price correction, the pattern is unambiguous. Sovereign institutions are making a collective multi-year allocation decision about the relative reliability of gold versus fiat currency systems as reserve assets. J.P. Morgan projects combined institutional and central bank demand averaging approximately 585 tonnes per quarter through 2026 (J.P. Morgan Global Research).
Rebuilding Portfolio Architecture for a Post-60/40 World
The traditional 60/40 portfolio, 60% equities and 40% bonds, was designed for a specific macro environment: falling interest rates, contained inflation, manageable public debt, and stable economic growth. Those conditions enabled bonds and equities to provide genuine diversification because they responded differently to economic cycles. That correlation relationship has broken down as both asset classes face structural headwinds simultaneously.
Furthermore, the relationship between gold and bonds has itself evolved meaningfully, adding further complexity to traditional portfolio construction assumptions.
Portfolio Architecture Comparison: Traditional 60/40 vs. Gundlach's Evolved Framework
| Allocation Category | Traditional 60/40 | Gundlach Framework (May 2026) |
|---|---|---|
| Domestic equities | 60% | Capped at ~40% (non-U.S. stocks preferred) |
| Fixed income | 40% | Capped at ~25% (high-quality bonds only) |
| Gold | 0-2% | 10% (core real asset position) |
| Commodities basket | Minimal | 5-10% (Bloomberg Commodity Index type) |
| Cash / equivalents | Minimal | 20% |
| Emerging market equities | Rare | Included selectively |
The evolution of Gundlach's recommended allocation is itself instructive. In January 2026, he outlined a framework of 30% non-U.S. stocks, 20% real assets, 30% high-quality bonds, and 20% cash (Advisor Perspectives). By March 2026, the real asset sleeve was refined to 15%, split between 10% in gold and 5% in a broad commodity basket. By May 2026, the real asset allocation was raised back to 20% (DoubleLine). The directional trend is clear: the real asset sleeve has grown and the conviction behind it has deepened.
The Regime-Resilience Design Principle
The logic of this portfolio construction is specifically designed around regime uncertainty rather than a single macro forecast. Each allocation category serves a different scenario:
- Inflationary regime: Commodities and gold outperform; real purchasing power is preserved while paper assets erode
- Deflationary shock: High-quality bonds and cash provide capital preservation and optionality
- Stagflationary environment: Gold functions as the primary refuge, historically its strongest performance backdrop
- Equity market correction: Diversified real assets and a substantial cash buffer reduce drawdown severity and create redeployment capacity
No single scenario destroys the entire portfolio. The design objective is not maximum return in the best outcome. It is surviving the worst outcome without catastrophic loss while still participating in recovery.
Equity valuations described as extraordinarily elevated, combined with a 17-year low in risk positioning at one of the world's leading fixed-income managers, frames the 60% equity concentration of traditional portfolios not as a diversification strategy but as concentrated exposure to a single overvalued asset class.
Reading Entry Signals: The $3,500 Threshold and the Copper-to-Gold Ratio
Beyond the structural thesis, Gundlach has been specific about the conditions that trigger more aggressive positioning. Two signals are particularly instructive for investors tracking this framework.
The $3,500 Conviction Buy Level
Gundlach has indicated he would increase gold purchases aggressively on any pullback toward $3,500. With gold currently trading near $4,700, that represents approximately a 25% decline from current levels. The 52-week range spans $3,123 to $5,589.38, demonstrating that gold has already traded through a range of over $2,400 within a single year. Within established bull markets, pullbacks of this magnitude are structural features of the price cycle, not signals that the bull market has ended.
The psychology here is worth examining carefully. Most investors experience pullbacks as reasons to reduce exposure. Conviction-based frameworks treat them as the accumulation windows for which the portfolio thesis was specifically constructed. The investor who sells during a 20% correction and buys back at higher prices has not protected capital. They have paid a premium for emotional comfort.
The Copper-to-Gold Ratio as a Macro Indicator
The copper-to-gold ratio is a less widely understood but institutionally important analytical tool. Its logic is elegant: copper prices rise with genuine economic growth and industrial demand, while gold prices rise with fear, monetary stress, and demand for safe-haven stores of value. The ratio of copper price to gold price therefore functions as a real-time barometer of market confidence in economic expansion.
Copper-to-Gold Ratio Interpretation Framework
| Ratio Direction | Economic Signal | Gold Implication |
|---|---|---|
| Rising (copper outperforms gold) | Growth optimism, industrial demand strong | Gold relatively less favoured near-term |
| Falling (gold outperforms copper) | Growth pessimism, risk-off positioning | Gold demand typically accelerates |
| Falling alongside sticky inflation | Stagflationary signal, growth + inflation stress | Historically gold's most powerful backdrop |
The CFA Institute has documented the ratio's historical correlation with 10-year Treasury yields, used by institutional portfolio managers as a leading indicator for interest rate direction. A falling ratio in an environment of persistent inflation sends a dual signal: economic momentum is deteriorating while prices remain elevated. This is the stagflationary backdrop that Gundlach identifies as potentially the strongest possible environment for gold, precisely because it eliminates the policy tools that typically contain precious metals rallies.
The next major ASX story will hit our subscribers first
Gold and Silver: Two Real Assets, Two Distinct Roles
Understanding the relationship between gold and silver within a real asset allocation requires distinguishing their different behavioural characteristics across market cycles.
Gold as the Monetary Foundation
Gold occupies a unique position in financial history. No other asset class has maintained its role as a store of value across multiple monetary systems, political regimes, and millennia. Its defining characteristic in Gundlach's framework is the absence of counterparty risk. A gold bar does not depend on any institution's solvency, any government's fiscal discipline, or any central bank's policy credibility to hold its value. In a debt-saturated system where most financial assets are ultimately claims against other entities' ability to pay, this independence is genuinely scarce.
The safe-haven role of gold is therefore not simply a historical curiosity. It is a structurally rational response to a system where counterparty risk is pervasive and growing. This is why gold forms the core of the real asset sleeve in Gundlach's framework, at 10% of total portfolio allocation, while commodities occupy a secondary position.
Silver's Dual Nature and Amplified Beta
Silver operates differently from gold across a precious metals bull market cycle. Its behaviour is divided between monetary characteristics and industrial demand dynamics, which creates a specific performance pattern: silver typically lags gold in the early stages of a precious metals advance, then accelerates with significantly higher volatility once the broad metals complex gains momentum.
This pattern has historical precedent across multiple prior cycles, including the 1970s bull market and the 2010-2011 precious metals run. The gold-silver ratio serves as one key indicator of where the cycle stands.
In May 2026, the gold-to-silver ratio compressed from 62.05 to 54.94 in under a week, one of the fastest ratio compressions in recent memory. Historically, rapid ratio compression of this type signals that silver is beginning to catch up to gold's accumulated gains, a pattern that has preceded significant silver outperformance in prior precious metals bull markets.
This ratio compression is analytically significant not because it predicts near-term prices with precision, but because it suggests the cycle may be transitioning from the gold-led early phase to the broader precious metals participation phase where silver historically delivers amplified returns. Silver offers complementary exposure within a real asset allocation, serving a different risk-return function rather than duplicating gold's role.
Frequently Asked Questions on Jeffrey Gundlach on Gold
What is Jeffrey Gundlach's current price outlook for gold?
Gundlach views the current bull market as continuing beyond May 2026 price levels. His most specific near-term signal is a stated willingness to buy more aggressively on any pullback toward $3,500, which implies he regards current pricing in the $4,700 range as supported by durable fundamentals rather than speculative excess. The underlying drivers of his thesis, fiscal stress, dollar structural weakness, and sovereign accumulation, have not changed in character since gold's January 2026 all-time high of $5,589.38. For a broader view of where prices may head, the gold price outlook for 2025 and beyond provides useful additional context.
Why does Gundlach classify gold as a real asset rather than a commodity?
The distinction is conceptually important. Commodities derive demand primarily from industrial consumption and extractive economics, meaning their prices fluctuate with production costs, supply chains, and end-user demand cycles. Real assets hold intrinsic value independent of any institution's promise or any government's fiscal condition. Gold has functioned as a monetary anchor across thousands of years and multiple fiat currency collapses. That track record places it in a category separate from industrial commodities, despite being mined and physically traded.
Should investors buy gold near all-time highs?
The psychological barrier of buying near record prices is real but analytically misleading. In every prior sustained gold bull market, prices that exceeded previous all-time highs subsequently became new support floors rather than resistance ceilings. The relevant analytical question is not the absolute price level but whether the fundamental drivers remain intact. Gundlach's framework assesses those drivers, including above-target inflation, dollar structural vulnerability, and central bank accumulation at nearly double historical averages, as durable rather than transient.
How does central bank gold buying create a structural price floor?
Central banks operate with reserve management time horizons of decades rather than quarters. Their 863-tonne purchase total in 2025, running at approximately 83% above the 2010-2021 annual average of 473 tonnes, represents policy commitments that do not reverse on short-term price volatility. The fact that Q1 2026 purchases reached 244 tonnes through a 16% price correction confirms this dynamic: sovereign buyers treated the correction as an opportunity rather than a warning. J.P. Morgan projects combined institutional and central bank demand averaging approximately 585 tonnes per quarter through 2026, establishing a structural demand floor that retail sentiment alone cannot create.
What does DoubleLine's current portfolio positioning signal?
DoubleLine's positioning as of May 2026 represents the most defensive configuration in the firm's 17-year history. A 20% cash allocation, 20% in real assets including gold, selective emerging market equity exposure, and minimal U.S. domestic equity concentration signals that Gundlach's assessment is that current macro risks are substantially underpriced in conventional portfolio structures. As reported by Kitco, this is not a marginal adjustment. It is a fundamental rewrite of the portfolio's underlying risk assumptions.
Understanding Why Duration and Persistence Matter More Than Timing
The four compounding forces Gundlach identifies, above-target inflation, structural dollar weakness, unsustainable federal debt trajectory, and sovereign-scale gold accumulation, share a common characteristic that distinguishes this environment from typical market cycles. They are all slow-moving structural forces rather than event-driven catalysts.
Federal debt does not unwind in a single fiscal year. De-dollarisation, the gradual reduction of the dollar's share of global reserve assets and trade settlement, operates over decades. Central bank reserve strategies, once established as multi-year policy frameworks, do not reverse on a few months of commodity price movement. These forces do not turn on a headline or resolve on a quarterly earnings call.
This durability creates a specific psychological challenge for investors trained on event-driven investing. Waiting for the thesis to become undeniable, for the debt crisis to crystallise, for the dollar to visibly collapse, for inflation to become obviously entrenched, is a strategy that has consistently resulted in buying the crisis premium rather than the preparation discount. The investors who have historically captured the most value from structural macro shifts are those who positioned in advance of the consensus recognition, during the period when the thesis was intellectually sound but not yet emotionally obvious.
Bull markets in any asset class do not move in straight lines. Gold's 16% correction from its January 2026 all-time high to its May 2026 trading range is a normal structural feature of a continuing bull market, not evidence that the underlying thesis has failed. Conviction-based frameworks, of the kind reflected in Jeffrey Gundlach on gold positioning, treat those intervals as accumulation opportunities rather than exit signals.
The asymmetry in waiting is not symmetric in either direction. Being early in a structural macro reallocation costs patience. Being late costs price. For a real asset that has already demonstrated its capacity to appreciate from a 52-week low of $3,123 to an all-time high of $5,589.38 within a single year, the cost of misjudging that asymmetry is measurable in substantial real terms.
This article is for informational and educational purposes only. It does not constitute financial advice. Past performance is not a guarantee of future results. All investments involve risk, including the potential loss of capital. Please consult a qualified financial adviser before making any investment decisions.
Want to Identify the Next Major Mineral Discovery Before the Market Does?
While Gundlach's macro framework highlights gold's structural appeal, Discovery Alert's proprietary Discovery IQ model delivers real-time ASX alerts the moment significant mineral discoveries are announced — visit the Discovery Alert discoveries page to see how historic finds like those by De Grey Mining and WA1 Resources translated into extraordinary returns, and begin your 14-day free trial to position yourself ahead of the broader market.