July 21, 2026
When Interest Rates Become a Price Ceiling: Understanding Gold's Yield Sensitivity
Every major repricing in gold's history has eventually traced back to the same underlying mechanism: the relationship between the yellow metal and the real cost of holding it versus alternative assets. When inflation-adjusted bond yields rise, the opportunity cost of holding non-yielding gold increases, and institutional models begin repricing the metal downward. When real yields fall, the inverse applies with equal force. This dynamic is not new, but its precision has reached a new level of quantification in 2026, and that precision sits at the heart of JPMorgan's revised outlook.
Understanding why JPMorgan cuts gold forecast to $4,500 requires working through the mechanism itself, not just the headline number. The revision reflects a specific, measurable sensitivity that functions symmetrically in both directions. Furthermore, the bank's own projections make clear that the same logic pointing to near-term constraint also points to a structural recovery once the rate cycle turns.
When big ASX news breaks, our subscribers know first
The $20-Per-Basis-Point Rule: Gold's Quantified Rate Sensitivity
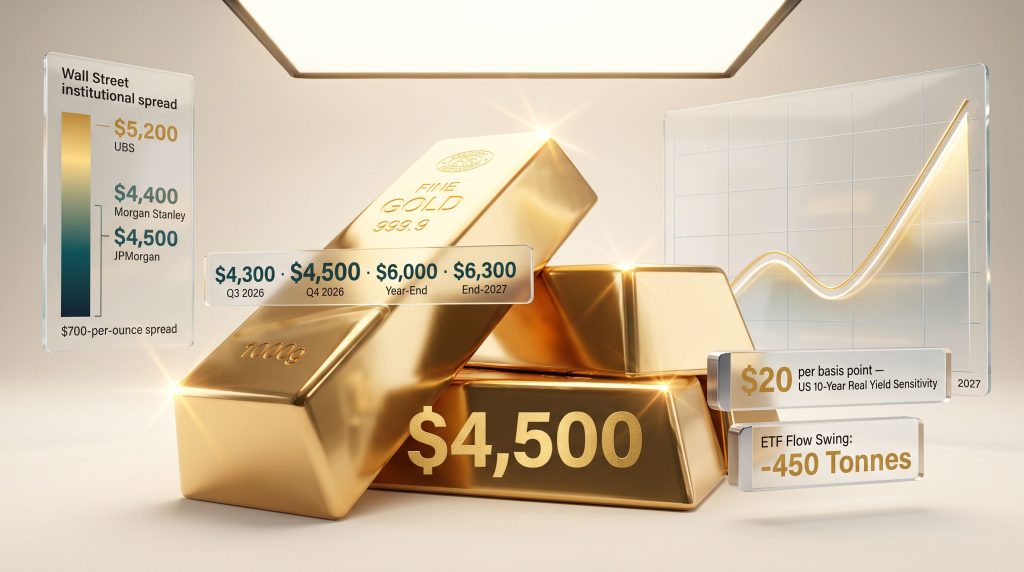
Since late February 2026, institutional modelling has documented that gold has declined by approximately $20 per ounce for every single basis point increase in US 10-year real yields. At current rate levels, that relationship functions as a direct and quantifiable price ceiling in the near term. (JPMorgan, via AllWeatherFinance / BigGo Finance)
This level of sensitivity is unusually precise for a commodity whose price is influenced by dozens of variables simultaneously. The reason it has become so dominant is the re-emergence of a negative correlation between gold and real yields that had weakened during the 2022–2025 cycle of geopolitical accumulation. The Warsh FOMC effect reasserted it sharply.
How Did the Warsh FOMC Meeting Reprice Gold's Rate Relationship?
Federal Reserve Chair Kevin Warsh chaired his first FOMC meeting on 17 June 2026. The Fed held the benchmark rate unchanged at 3.50%–3.75%, but the meeting delivered a hawkish surprise that markets immediately interpreted through the real yield lens. Nine of the 18 members who submitted dot plot projections indicated at least one rate hike in 2026, while the remaining nine projected rates on hold or lower. (Yahoo Finance, June 17, 2026)
Two additional decisions amplified the hawkish signal. Warsh withheld his own dot plot projection entirely, becoming the first Fed chair ever to do so, and simultaneously announced the elimination of forward guidance, ending the central bank's practice of pre-signalling future rate moves. (CNN, June 17, 2026)
Markets read that combination as structurally hawkish. Real yields moved higher. Gold's negative correlation with those yields, which had loosened during the reserve diversification cycle, snapped back firmly. The $20-per-basis-point relationship is the direct product of that reassertion.
Understanding the broader gold and bond dynamics at play here is essential for contextualising why this rate sensitivity has re-emerged so sharply in 2026.
Key insight: The Warsh decision to eliminate forward guidance introduced a new form of rate uncertainty that the market cannot hedge in advance. Without pre-signalling, every economic data release carries more direct rate-path implications, making gold's real yield sensitivity a more continuous, active pricing mechanism rather than a periodic one.
JPMorgan's Full Forecast Ladder: Near-Term Caution, Long-Term Conviction
The headline from JPMorgan's 3 July 2026 note was a 25% reduction in its gold price target. What the headline compressed was a two-phase structure: a near-term adjustment grounded in real yield mechanics, and a multi-year thesis that remains fully intact.
On 9 June 2026, JPMorgan told clients gold would reach $6,000 per ounce by year-end. Twenty-four days later, the bank revised its Q4 2026 target to $4,500, with a Q3 average projection of $4,300. Critically, the bank also reaffirmed its expectation of a renewed upward cycle beginning in 2027. (Reuters, July 3, 2026)
| Forecast Period | JPMorgan Price Target | Primary Driver |
|---|---|---|
| Q3 2026 Average | $4,300/oz | Real yield sensitivity, ETF outflows |
| Q4 2026 Target | $4,500/oz | Partial demand stabilisation |
| Year-End 2026 | Under review | Conditional on rate path |
| End-2027 | $6,300/oz | Central bank diversification, yield normalisation |
Source: Reuters, JPMorgan, July 3, 2026
The single most widely misunderstood element of this revision is that the $4,500 figure refers specifically to the Q4 2026 near-term target, not the bank's multi-year structural projection. JPMorgan's 2027 end-target of $6,300 per ounce has not been withdrawn. The bank explicitly describes a renewed upward cycle beginning in 2027 driven by the same structural forces cited since the gold rally began in earnest from below $2,000 in 2023.
Consequently, investors tracking the gold price forecast landscape should distinguish carefully between near-term cyclical headwinds and long-run structural conviction when interpreting JPMorgan's position.
Where JPMorgan Sits Within Wall Street's Forecast Divide
JPMorgan's $4,500 Q4 target is the most cautious among major institutional forecasters. The spread between JPMorgan and the most bullish Wall Street institution currently exceeds $700 per ounce, representing one of the widest forecast divergences for gold in recent memory. (TheStreet, Yahoo Finance, July 2026)
| Institution | Q4 2026 / 12-Month Target | Relative Positioning |
|---|---|---|
| JPMorgan | $4,500 | Most cautious near-term |
| Morgan Stanley | ~$4,400 base / $5,200 upside | Conditional on ETF inflow recovery |
| Goldman Sachs | $4,900 | Moderately bullish |
| Bank of America | $4,800 | Moderately bullish |
| Deutsche Bank | $4,800 | Moderately bullish |
| UBS | $5,200 (12-month) | Most bullish |
Sources: Reuters, TheStreet, Yahoo Finance, July 2026
Perspective: A $700-per-ounce institutional spread does not indicate confusion about gold's role as a store of value. It reflects genuine disagreement about the near-term rate path. When rate uncertainty resolves, that spread historically compresses, and historical evidence suggests the compression tends to favour the upside.
Gold spot price as of 20–21 July 2026 was trading in the $4,007–$4,043 range, already below JPMorgan's own Q3 average projection of $4,300. The metal reached an intraday peak of $5,589.38 on 28 January 2026, and has since corrected approximately 28% from that level. If JPMorgan's near-term model is accurate, current spot prices already incorporate a substantial portion of the rate-sensitivity headwind before any structural recovery phase begins.
What Actually Drove the 25% Revision: Demand-Side Deterioration
JPMorgan's July 3 revision was not driven solely by real yield mechanics. The bank simultaneously revised its demand assumptions across every major buying category, and the cumulative shift was significant. (JPMorgan, via AllWeatherFinance)
| Demand Category | Prior Forecast | Revised Forecast | Net Change |
|---|---|---|---|
| Gold ETF flows (full-year 2026) | +400 tonnes net inflow | -50 tonnes net outflow | -450 tonnes |
| Central bank net buying | 640 tonnes | 600 tonnes | -40 tonnes |
| Bar and coin demand growth | +10% year-on-year | +3.6% year-on-year | -6.4 percentage points |
Source: JPMorgan, via AllWeatherFinance
The ETF revision is the most striking single figure: a 450-tonne swing from strong net inflows to net outflows represents a complete reversal of the institutional paper gold accumulation trend that helped drive prices to January highs. However, it is important to distinguish between cyclical demand normalisation and structural demand collapse, because they point to very different forward trajectories.
ETF outflows in a rising real yield environment are a rational institutional response, not evidence that long-term investors have abandoned gold. Furthermore, central bank gold buying declining from 640 tonnes to 600 tonnes is a reduction, not a withdrawal. Bar and coin demand growing at 3.6% rather than 10% is slower growth, not contraction. The demand picture has softened; it has not reversed direction.
Mapping the Downside: The $3,500 Tail Risk and Why It Requires Two Things Simultaneously
JPMorgan's report identifies a scenario in which gold decisively breaks below $4,000, potentially testing the $3,500–$3,600 range. This scenario has attracted significant media attention, but its conditional structure is frequently omitted from coverage. (JPMorgan, via BigGo Finance / AllWeatherFinance)
The downside scenario requires both of the following conditions to occur together:
- Summer 2026 economic data runs materially hotter than consensus expectations, strengthening the case for Federal Reserve action
- The Federal Reserve executes a rate hike earlier than its current forward guidance implies, triggering technical stop-losses and momentum selling below the $4,000 level
JPMorgan's own base case satisfies neither condition. The bank's rate strategy team expects the Fed to hold rates throughout 2026, with the first hike delayed to Q3 2027. As of early July 2026, the OIS forward curve was pricing approximately 40 basis points of cumulative hikes through April 2027, a position more hawkish than JPMorgan's central scenario but not a committed market probability.
The July 28–29 FOMC meeting and the June PCE inflation reading on 30 July represent the next significant inputs into this assessment. Either data point landing materially above consensus expectations would shift probability weightings toward the downside scenario, while in-line or soft readings would reinforce JPMorgan's hold-through-2026 base case.
The $3,500–$3,600 range is a tail risk, not a central expectation.
The next major ASX story will hit our subscribers first
The Structural Bull Case JPMorgan Did Not Revise
Three long-cycle forces drove gold from below $2,000 per ounce in 2023 to its January 2026 peak of $5,589. None of those forces appear in JPMorgan's list of reasons for the near-term revision, and the bank explicitly projects their continued operation through the 2027 recovery cycle. (Reuters / Yahoo Finance, citing JPMorgan)
Structural drivers underpinning JPMorgan's 2027 thesis:
- Sovereign reserve rebalancing – Non-Western central banks continue reducing US dollar-denominated holdings in favour of physical gold, a multi-year trend with no sign of reversal
- US fiscal expansion – Persistent accumulation of sovereign debt sustains long-run real yield normalisation pressure that ultimately supports gold's structural role
- Geopolitical fragmentation – Multi-polar reserve diversification accelerates demand for neutral, non-sovereign stores of value that cannot be frozen or sanctioned
The symmetry argument deserves particular attention. The same $20-per-basis-point sensitivity that currently functions as a cap on gold's near-term price operates identically in reverse when real yields eventually compress. If the US growth outlook deteriorates, if inflation falls faster than expected, or if the Fed resumes an easing cycle in 2027, every basis point of yield decline becomes a $20-per-ounce tailwind. JPMorgan's near-term caution and its 2027 structural optimism are not contradictions; they are sequential phases of the same rate-sensitivity model.
Silver, Platinum, and Palladium: The Full Precious Metals Complex
JPMorgan's July 3 update extended across all four major precious metals, applying the same rate-sensitivity framework while acknowledging distinct supply-demand dynamics for each. (Reuters, July 3, 2026)
| Metal | 2026 Year-End Target | 2027 Outlook | Primary Driver |
|---|---|---|---|
| Gold | $4,500 (Q4) | $6,300 | Rate normalisation, central bank buying |
| Silver | $60–$65/oz | Stabilisation | Supply deficit normalisation, gold-silver ratio |
| Platinum | ~$1,800/oz | ~$1,950/oz | South African supply-side support |
| Palladium | ~$1,350/oz | ~$1,300/oz | Broader complex weakness |
Source: Reuters, July 3, 2026
Silver's Industrial Demand Profile and the Supply Deficit Context
Silver's price dynamics carry a structural complexity that gold does not: approximately 58% of total silver consumption is industrial demand (Silver Institute, World Silver Survey 2026), meaning the metal responds to manufacturing and technology cycles in ways that pure monetary metals do not.
On the solar side, photovoltaic manufacturers have been actively reducing silver intensity per panel. BloombergNEF estimates that solar silver demand fell roughly 7% year-on-year in 2026 as producers accelerated material substitution in response to elevated input costs. This is industrial efficiency adjustment, not a demand collapse.
The broader supply context matters here. In addition to rate pressures, the ongoing silver supply deficits running for five consecutive years through 2025 (Silver Institute, World Silver Survey 2026), with current trajectory pointing toward a sixth consecutive year of deficit conditions, provide a structural underpinning that JPMorgan's $60–$65 per ounce target reflects as normalisation from 2025's exceptionally tight supply premium, not an abandonment of silver's structural supply story.
At current spot prices near $56.53 (July 20, 2026), JPMorgan's $60–$65 range implies meaningful recovery from current levels. The gold-to-silver ratio normalisation thesis also warrants monitoring: if gold recovers toward JPMorgan's 2027 targets and the ratio compresses toward historical norms, silver's percentage upside would exceed gold's on a relative basis.
Platinum and Palladium: Supply-Driven Divergence
Platinum's $1,800 year-end target and $1,950 2027 projection both rest on South African supply-side fundamentals, where ongoing operational constraints at major producing operations continue to limit available supply. Palladium's weaker trajectory at $1,350 by year-end and $1,300 through 2027 reflects broader automotive demand softness, as the structural shift toward battery electric vehicles reduces catalytic converter demand over time.
What Long-Term Holders Should Actually Be Asking
The most useful framework for interpreting JPMorgan's revision is not whether the $4,300 Q3 average proves accurate. It is whether the revision changes anything about the multi-decade argument for holding physical precious metals as a reserve asset.
Three questions frame the decision clearly:
-
Have the structural forces driving central bank gold accumulation reversed? JPMorgan's own research explicitly states they have not. Non-Western central bank diversification away from dollar-denominated assets is an ongoing policy trend, not a tactical trade.
-
Does the rate-sensitivity mechanism work symmetrically on the upside when yields eventually compress? Historical evidence says yes, and JPMorgan's own model confirms it, projecting the 2027 recovery phase directly from the same mechanism driving current constraint.
-
Is the current institutional forecast divergence of $700 per ounce a signal of structural uncertainty or near-term rate path uncertainty? The weight of the evidence points firmly toward the latter.
Perspective: Gold currently trades below JPMorgan's own Q3 average projection. If the bank's near-term model is correct, current prices already reflect a substantial portion of the rate-sensitivity headwind, positioning long-term holders before the structural recovery phase JPMorgan projects beginning in 2027.
Frequently Asked Questions: JPMorgan's Gold Forecast Cut Explained
Why Did JPMorgan Cut Its Gold Price Forecast in July 2026?
JPMorgan revised its Q4 2026 gold target by 25% to $4,500 on July 3, citing weaker-than-expected demand across ETFs, central banks, and retail channels. This came alongside a sharp reassertion of gold's sensitivity to US 10-year real yields following the hawkish tone of the 17 June 2026 FOMC meeting under Chair Kevin Warsh. The decision to cut — where JPMorgan cuts gold forecast to $4,500 — was rooted in both rate mechanics and demand-side deterioration simultaneously.
Is the $3,500 Downside Scenario JPMorgan's Base Case?
No. The $3,500–$3,600 range is a tail risk requiring two simultaneous conditions: hotter-than-expected summer economic data and an early Fed rate hike. JPMorgan's base case calls for no Fed rate hike in 2026, with the first hike delayed to Q3 2027.
Does JPMorgan Still Hold a Long-Term Bullish View on Gold?
Yes. The bank explicitly projects a renewed upward cycle from 2027 onward, targeting $6,300 per ounce by end-2027, driven by central bank diversification, geopolitical fragmentation, and real yield normalisation.
What Are the Most Important Upcoming Catalysts for Gold Pricing?
The July 28–29 FOMC meeting and June PCE inflation data on 30 July represent the next significant decision points for the near-term rate path and, by extension, gold's yield-sensitivity ceiling. Both data releases carry material implications for whether JPMorgan cuts gold forecast assumptions hold or require further revision.
This article is for informational purposes only and does not constitute financial or investment advice. Precious metals involve risk and may result in partial or total loss of capital. Always consult a qualified financial adviser before making investment decisions.
Want to Track the Next Major Precious Metals Discovery Before the Market Moves?
While JPMorgan's revised gold outlook highlights the power of structural forces in driving precious metal valuations, the biggest gains in this sector have historically come from being positioned early — and Discovery Alert's proprietary Discovery IQ model delivers real-time alerts the moment significant ASX mineral discoveries are announced, turning complex data across 30+ commodities into clear, actionable insights. Explore historic discovery returns on Discovery Alert's dedicated discoveries page and begin your 14-day free trial today to ensure you're positioned ahead of the market.