
August 22, 2026
When Policy Becomes the Price Signal: Understanding the Geopolitical Architecture of the Junior Mining Bull Market
There is a version of the junior mining bull market story that fits neatly onto a single chart: metal prices rise, margins expand, capital flows in, explorers rerate. That version is incomplete. The cycle now underway is being shaped not by a commodity demand surge rooted in industrial growth alone, but by something harder to model and slower to reverse: the deliberate reorganisation of global mineral supply chains along geopolitical lines. Understanding that distinction is the difference between identifying durable opportunity and chasing a sentiment trade that reverses with the calendar.
When big ASX news breaks, our subscribers know first
The Evidence That Capital Is Moving in Earnest
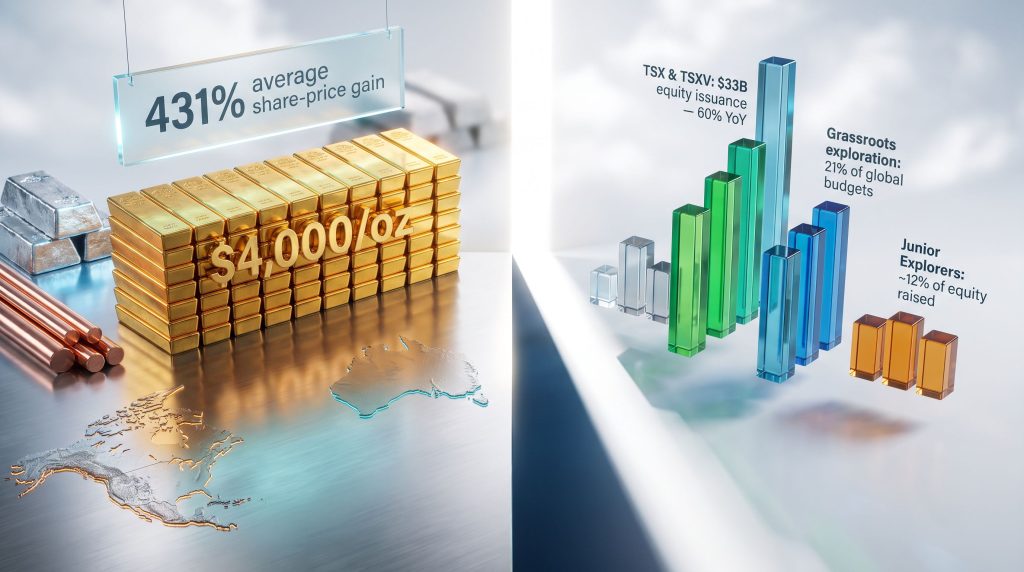
The headline data is genuinely striking. The 2026 TSX Venture 50 was composed of 48 out of 50 mining companies, with constituent companies delivering an average share-price gain of 431% and market-capitalisation growth of 775% across 2025. That represents the strongest annual performance recorded since the program launched in 2006. TSX and TSXV combined equity issuance exceeded $33 billion in 2025, a 60% year-over-year increase, and momentum has carried into 2026 with June alone producing approximately $700 million in junior equity raises, up 67% from the same month a year prior.
These are not small movements at the margin. Capital is genuinely re-entering the sector. However, the analytical problem is that aggregate figures obscure a more complex reality: the money is not flowing evenly, and the cohort capturing the bulk of it is far narrower than the headline numbers imply. To appreciate the full picture, it helps to consider the broader junior mining investment landscape and how capital concentration is reshaping opportunity across the value chain.
The Bifurcation Problem: Where the Money Is Not Going
Two structural trends sit beneath the aggregate fundraising data, and both point in the same direction.
First, grassroots exploration's share of global exploration budgets has fallen to a record-low 21%. This is not a temporary softness. It reflects a deliberate capital preference for execution certainty over geological optionality. Second, small-cap explorers' proportion of total equity raised has compressed from approximately 31% five years ago to roughly 12% today. Institutional allocators are concentrating at the de-risked end of the value chain, not distributing capital across it.
The equity market confirms the split. Median junior explorer and developer price-to-net-asset-value (P/NAV) multiples currently sit in the 0.3x to 0.6x range, representing deep discount territory even against record metal prices. The VanEck Junior Gold Miners ETF (GDXJ) gained approximately 12.6% year-to-date as of 20 August 2026, a fraction of what the underlying commodity prices have delivered. The takeaway is precise: advanced, permitted, and near-production stories are being rerated aggressively, while everything upstream of that inflection point is being structurally discounted.
| Segment | Estimated P/NAV Range | Market Characterisation |
|---|---|---|
| Senior Producers | 1.0x to 2.0x | Fully priced; margin expansion visible |
| Advanced Developers (permitted, funded) | 0.6x to 1.0x | Capital concentrating; leverage available |
| Junior Explorers | 0.3x to 0.6x | Structural discount; reasons are durable |
| Grassroots Exploration | Sub-0.3x | Effectively unfunded; access minimal |
Why Geopolitics Is the Primary Rerating Mechanism in This Junior Mining Bull Market
Every prior junior mining bull market this century has had a recognisable demand-pull architecture. The 2003 to 2008 cycle was anchored in Chinese industrialisation. The 2009 to 2011 recovery was driven by post-financial-crisis monetary expansion and commodity catch-up. The current cycle shares surface features with those predecessors but is fundamentally different in its origin structure.
The TMX Group itself has attributed the surge in mining capital to a new global financing cycle driven by geopolitical uncertainties and industrial policy shifts. That framing matters because it correctly identifies what is supplying the price floor and the capital allocation signal: policy architecture, not the commodity demand cycle alone. Furthermore, the surge in critical minerals demand linked to the energy transition is amplifying this dynamic in ways that earlier cycles simply did not experience.
Several overlapping policy vectors are operating simultaneously:
- The FORGE framework (Australia, Canada, Japan) has created a friend-shoring architecture that structurally advantages Western-jurisdiction mineral projects in institutional capital allocation decisions.
- Section 232 tariff mechanisms targeting mineral imports have introduced price-floor dynamics that, while not enshrined as statute, are reshaping project-level financing conversations.
- A July 2026 executive order tightening U.S. defense procurement to restrict sourcing of Chinese mineral inputs has materially altered demand calculations for domestically produced critical minerals.
- The $12 billion "Project Vault" federal stockpile programme functions as a de facto demand guarantee for specific commodity cohorts, providing a pricing backstop that conventional market analysis would not model.
None of these mechanisms are seasonal. They do not unwind in September with the summer trading lull.
China's Export Control Escalation and Its Downstream Effect on Western Juniors
China's progressive tightening of rare-earth and critical mineral export controls through 2025 and 2026 has been more systematic than many Western market participants initially credited. The addition of a whistleblower enforcement mechanism for smuggling, combined with the detention of Japanese nationals in mid-2026 on allegations of rare-earth smuggling, signals that Beijing views these controls as durable policy instruments rather than temporary diplomatic leverage.
The commodity cohorts most acutely exposed to Chinese supply-chain weaponisation include rare earths, tungsten, antimony, and gallium. In particular, the antimony shortage risks for defence and industrial sectors have become a focal point for Western policymakers seeking to accelerate domestic project development. For Western-jurisdiction junior miners holding resources in any of these categories, Chinese enforcement escalation functions as an immediate repricing event.
The enforcement signal matters as much as the restriction itself. When a policy carries genuine legal consequence for those circumventing it, buyers in allied nations are compelled to source from non-Chinese projects regardless of marginal cost differences. That compulsion is a durable demand signal for Western juniors.
Central Bank Gold Accumulation: Debasement Hedge or Structural Shift?
Central bank gold purchasing is running at approximately 190 tonnes per quarter. Framing this as a seasonal allocation preference misses the structural driver. The sustained pace of central bank gold reserves accumulation reflects an institutional assessment that fiat currency reserve holdings carry rising debasement and geopolitical concentration risk.
Gold above $4,000 per ounce represents not just a psychological milestone but a structurally different margin environment for producers and a qualitatively different valuation context for developers. The debasement trade and reserve-currency confidence erosion as a demand driver is a more durable thesis than sentiment-driven gold rallies. It is also, however, a consensus-crowded trade, and that distinction carries its own risk implications discussed below.
The Commodity Asymmetry Map: Where the Physical Case Is Strongest
Silver: Supply Inelasticity as a Structural Feature
Silver's investment thesis rests on a mechanism that most commodity frameworks fail to account for properly: approximately 70% of mined silver is produced as a by-product of copper, lead, and zinc operations. This means silver mine supply cannot respond to silver's own price signal. When silver prices rise, no new primary silver mines immediately come online at scale, because the majority of supply is determined by base-metal production economics, not silver economics.
The physical consequence is visible in the data. Silver has registered six consecutive annual supply deficits, with cumulative drawdowns of approximately 762 million ounces since 2021. That is a structural supply shortfall, not a cyclical blip.
One important caveat deserves attention. In May 2026, UBS revised its silver deficit estimate downward significantly, from approximately 300 million ounces to 60 to 70 million ounces, and adjusted price targets accordingly. The deficit is real; its scale remains contested. For investors, this distinction matters: the existence of a deficit supports a long-term thesis, but position sizing should account for the possibility that consensus deficit estimates are materially overstated.
Copper: Three Demand Vectors Converging on a Slow-Moving Supply Curve
The copper supply crunch is demand-convergence driven rather than supply-inelastic, but the structural logic is equally compelling. Wood Mackenzie has modelled a refined copper deficit of approximately 304,000 tonnes for 2025 and 2026, with three distinct demand vectors arriving simultaneously:
- Data centre infrastructure buildout driven by AI compute expansion, which is copper-intensive at transformer, wiring, and cooling system levels.
- Grid infrastructure expansion across North America and Europe as transmission networks are upgraded to support electrification at scale.
- Electric vehicle adoption, which consumes three to four times the copper content of a comparable internal combustion vehicle.
What makes copper's supply response structurally slow is the combination of long permitting timelines, declining ore grades at existing operations, and a decade of underinvestment in greenfield development. New copper supply cannot be brought online quickly enough to meet the convergence of these three demand vectors at current price levels. Analysts at White & Case have similarly highlighted how geopolitical chessboard dynamics are compounding these structural supply challenges across multiple commodity classes.
Gold: Structural Support With Narrower Upside Asymmetry
Gold's role in this cycle has largely been as the psychological anchor: the first commodity to reprice, the most consensus-owned trade, and the one where the risk-reward calculus has already normalised for many institutional participants. The central bank accumulation thesis provides a durable demand floor, but some institutional forecasts have modelled gold declining approximately 21% from current levels if the debasement narrative unwinds or if dollar strength reasserts.
That is not a base case, but it is a sizing consideration for heavily concentrated gold positions. At the project level, gold above $4,000 per ounce transforms the valuation arithmetic for developers whose prefeasibility studies were modelled at $1,900 per ounce. Every dollar gold trades above the study price deck flows directly to project net present value, but only if the mine actually reaches production. That conditional qualifier is where developer evaluation becomes the critical skill.
A Stage-Aware Framework for Capital Allocation Across the Value Chain
Evaluating Producers: Testing Margin Discipline Before Margin Capture
With structurally wide margins at current gold prices, the primary analytical question for senior producers has shifted from whether margins exist to how they are being deployed. Three screening criteria define this evaluation:
- All-in sustaining cost versus spot spread: Structural margin width signals durability; a company with a $1,800 AISC at $4,200 spot has a fundamentally different risk profile than one at $3,500 AISC.
- Reinvestment discipline: Brownfield expansion, near-mine exploration, and debt reduction signal management teams thinking through the cycle. Cycle-top acquisitions at premium valuations signal the opposite.
- Reserve replacement quality: Reserves recut at conservative price decks signal operational durability. Reserves that are only viable at or near spot price create future write-down risk if metal prices retrace.
Evaluating Developers: The Financing Structure Has Become the Differentiator
Among advanced developers, the single most important variable in the current cycle is no longer project grade or resource size alone. It is the financing structure used to reach construction. Non-dilutive financing mechanisms have emerged as a genuine competitive moat, and their use is accelerating. Two real-world templates illustrate the structural shift:
- Cabral Gold closed a US$45 million gold-linked loan denominated in ounces, allowing the company to access construction capital without issuing new equity shares.
- Thewelo secured a US$25 million gold loan through Monetary Metals alongside a fully subscribed debenture, demonstrating a path to first pour that preserves existing shareholder value throughout the construction phase.
These are not isolated transactions. They represent a template for how developers in this junior mining bull market can separate themselves from the equity-dilution dynamic that has historically suppressed junior share performance through construction. Observers at New Age Metals have noted that this structural shift in financing is one of the clearest signals that the current cycle carries genuine durability.
Developer Screening Framework:
- Permit status — Full construction approval is the most frequently mispriced de-risking event in the current market.
- First-pour timeline — Months to production matter more than years; the NPV benefit of elevated spot prices only materialises if the mine is built.
- Study price deck versus spot — A prefeasibility study modelled at $1,900 gold with spot at $4,400 contains significant unrecognised embedded value that re-reading the study at current prices will reveal.
- Financing structure — Non-dilutive routes to construction are now a valuation differentiator, not merely a financing preference.
Evaluating Explorers: Five Metrics That Replace the Producer Framework
The explorer cohort occupies the deepest discount in the current market for structural reasons, not cyclical ones. Producer and developer metrics do not transfer to this segment. The relevant screening criteria address company quality, not just asset quality:
| Screening Criterion | What to Measure | Red Flag Signal |
|---|---|---|
| Treasury and Runway | Months of cash at current burn rate | Less than 12 months without a clear financing path |
| Dilution History | Shares outstanding growth versus resource growth | Share count growing faster than resource ounces added |
| Insider Behaviour | Net buying or net selling at current prices | Insiders selling into strength |
| Target Discipline | Willingness to abandon marginal drill targets | Drilling every target to sustain promotional activity |
| Partner Validation | Strategic equity, off-take interest, or major-company participation | Absence of any external validation signal |
The explorer discount is only an investment opportunity when the company passes this five-point test. When the underlying commodity is performing but the company fails these criteria, the discount is not mispricing. It is correct pricing.
The next major ASX story will hit our subscribers first
Risks That Sit Beneath the Bullish Case
Intellectual honesty about the risks embedded in the current thesis is not optional for serious investors. Four scenarios carry meaningful probability:
Scenario 1: Consensus crowding and narrative reversal. Gold and copper are both widely owned. Some institutional forecasts have modelled copper falling approximately 20% by year-end and gold declining approximately 21% if the debasement narrative normalises. Crowded consensus trades unwind quickly when the narrative catalyst shifts.
Scenario 2: Policy reversal or legal challenge. The same executive orders structurally advantaging Western juniors can be reversed, delayed, or subjected to congressional and judicial challenge. Section 232 price floors remain a policy instrument rather than statute, and that distinction carries real implications for project financing decisions that embed policy assumptions into base cases.
Scenario 3: Financing access without share price performance. Juniors can successfully raise capital and still trade sideways if institutional rotation favours producers and developers. GDXJ's approximately 12.6% year-to-date performance as of August 2026 illustrates that even a funded sector can deliver disappointing equity returns when the capital allocation hierarchy is working against the upstream cohort.
Scenario 4: Developer execution failure. Permitted and funded does not mean built. Labour availability shortfalls, contractor capacity constraints, and grid connection delays have each terminated otherwise viable projects in recent cycles. Construction execution risk deserves explicit assessment in developer due diligence, not just as a footnote but as a primary evaluation criterion.
Catalysts to Monitor Through Q3 and Q4 2026
| Catalyst | Timing | Directional Impact |
|---|---|---|
| Denver Gold Forum | September 2026 | Sentiment inflection; historically breaks summer trading range |
| Senior producer Q3 earnings | October 2026 | Signals capital rotation direction for institutional allocators |
| Section 232 copper ruling | Q4 2026 | Binary event for Western copper junior valuations |
| Chinese export control expansion | Rolling | Immediate repricing of critical mineral junior cohort |
| New non-dilutive developer financings | Rolling | Validates structural shift away from equity dilution as primary construction mechanism |
| Central bank gold purchase data (Q3) | October 2026 | Confirms or questions the durability of the debasement floor thesis |
The Denver Gold Forum and Precious Metals Summit in September historically function as the sentiment inflection point that breaks the summer trading range and establishes positioning into year-end. Senior producer Q3 earnings guidance will signal whether the next dollar of institutional capital flows into reinvestment, M&A, or buybacks, each of which carries different implications for junior equity performance.
Frequently Asked Questions: Junior Mining Bull Market and Geopolitics
Is this cycle driven by fundamentals or geopolitics?
Both are operative, but they perform different analytical functions. The physical deficits in silver and copper and the debasement dynamic in gold provide the floor and the long-term demand case. Geopolitical policy actions, including friend-shoring frameworks, export control escalation, and defense procurement restrictions, provide the repricing catalyst that converts a fundamental thesis into an immediate capital allocation signal.
Why are junior explorers underperforming despite record metal prices?
Because the market is paying for execution certainty, not geological optionality. Grassroots exploration's share of global budgets has fallen to a record-low 21%, and small-cap explorers' share of equity raised has compressed from roughly 31% to approximately 12% over five years. These are structural, not cyclical, forces.
What makes a junior mining company well-positioned in a geopolitically driven bull market?
Four attributes define the market's current preferred profile: Western jurisdiction, near-production timeline, critical mineral or strategic metal exposure, and non-dilutive financing structure. Companies that satisfy all four criteria occupy a qualitatively different risk-reward position than those satisfying only one or two.
What is the difference between a gold-linked loan and a traditional equity raise?
A gold-linked loan denominated in ounces allows a developer to access construction capital without issuing new shares, preserving the value of existing equity throughout the most dilution-intensive phase of the mining development lifecycle. The Cabral Gold and Thewelo transactions illustrate that this is now an executable template, not a theoretical preference.
Positioning Logic for the Cycle's Next Phase
The junior mining bull market driven by geopolitics is real, structurally supported, and likely to persist beyond the seasonal trading patterns that historically dominate August commentary. But the directional call is considerably easier than the selection problem. Identifying which companies within a favourable cycle will actually outperform requires treasury discipline, dilution history, insider alignment, and jurisdiction screening, not just commodity price exposure.
The highest-conviction positioning logic for Q3 and Q4 2026 concentrates on three layers:
- Silver and copper on physical supply-deficit fundamentals, with explicit attention to the contested nature of deficit magnitude estimates.
- Permitted and funded developers that have adopted or are pursuing non-dilutive financing structures, where the NPV gap between study price decks and current spot prices contains embedded, unrecognised value.
- Explorers only when the five-point treasury, dilution, discipline, insider, and partner screening framework is fully satisfied, not merely partially.
The cycle is favourable. The selection challenge is harder than the trend. Investors who treat the two as equivalent are likely to own the sector's gains in headline form while missing them in portfolio reality.
This article is for informational purposes only and does not constitute financial advice. All forecasts, price projections, and scenario analyses referenced are sourced from third-party institutions and carry inherent uncertainty. Past performance in mining cycles is not indicative of future results. Readers should conduct independent due diligence before making any investment decisions.
Want to Know Which ASX Mineral Discoveries Are Emerging in Real Time?
Discovery Alert's proprietary Discovery IQ model instantly identifies significant ASX mineral discoveries across critical commodities — translating complex geological data into actionable insights for both short-term traders and long-term investors. Explore historic examples of major mineral discoveries and their returns, then start your 14-day free trial at Discovery Alert to position yourself ahead of the broader market.