
August 22, 2026
When Volume Growth Becomes a Financial Illusion
In commodity markets, the instinct to equate higher sales volumes with stronger financial performance is one of the most persistently misleading assumptions an investor can hold. The relationship between units sold and earnings generated is not linear; it is mediated almost entirely by the price at which those units are sold. When benchmark pricing collapses fast enough, selling more of a commodity does not generate more money. It can, paradoxically, generate substantially less, while simultaneously increasing operational costs tied to higher throughput.
This is precisely the dynamic that defined Nanshan Aluminium International's first-half 2026 financial result, and it serves as a textbook illustration of why commodity investors must always treat price as the primary variable and volume as a distant secondary consideration. The Nanshan alumina profit drop on lower prices is, furthermore, a reminder of how quickly favourable conditions can reverse in global resource markets.
When big ASX news breaks, our subscribers know first
H1 2026 at a Glance: The Numbers Behind the Nanshan Alumina Profit Drop
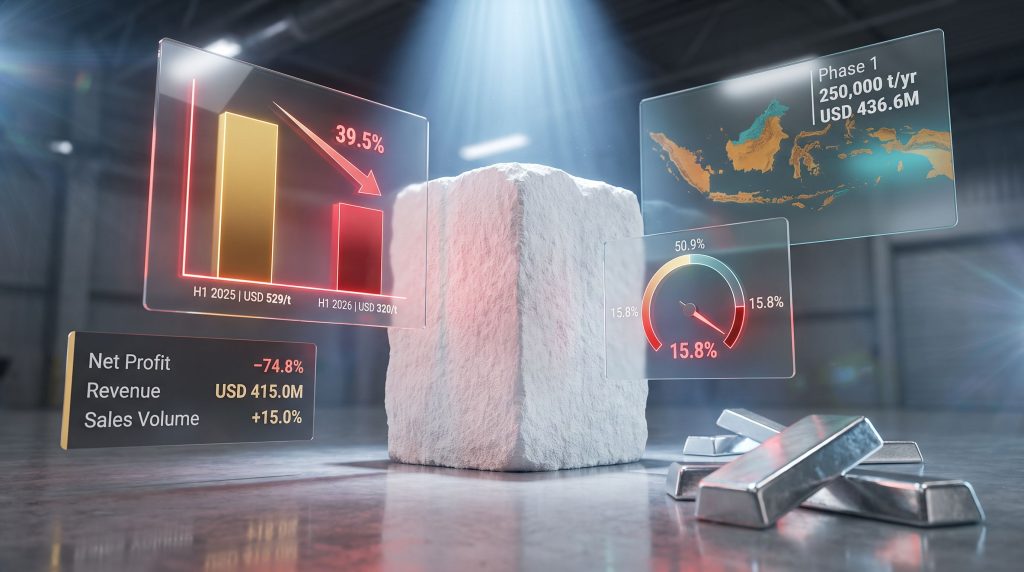
The scale of Nanshan's earnings compression in the six months ended 30 June 2026 is difficult to overstate. Despite selling 15% more alumina by volume, every major profitability metric deteriorated sharply. The core driver was a 39.5% collapse in average selling price, from USD 529 per tonne to USD 320 per tonne, a decline that the volume increase had no mathematical capacity to offset.
| Metric | H1 2026 | H1 2025 | Change |
|---|---|---|---|
| Revenue | USD 415.0M | USD 596.8M | -30.5% |
| Net Profit (attributable) | USD 62.7M | ~USD 249.2M | -74.8% |
| Gross Profit | USD 65.5M | USD 303.9M | -78.4% |
| Gross Margin | 15.8% | 50.9% | -35.1 pp |
| Sales Volume | 1.296M tonnes | 1.127M tonnes | +15.0% |
| Average Selling Price | USD 320/t | USD 529/t | -39.5% |
| Interim Dividend (HKD) | HKD 0.16/share | HKD 0.65/share | -75.4% |
| Basic EPS | USD 0.10 | USD 0.46 | -78.3% |
The gross profit decline of 78.4% is arguably more revealing than the net profit figure, because it strips away non-operating items and isolates the raw commercial damage from pricing. With gross margin compressing from 50.9% to 15.8%, a 35-percentage-point contraction, Nanshan's alumina operations moved from an extraordinarily profitable configuration to one operating at margins that leave almost no buffer against any further cost inflation or price weakness. According to reporting by AlCircle, this profitability impact was widely noted as one of the more pronounced pricing-cycle consequences seen among major alumina refiners in recent years.
Understanding Price-Volume Divergence in Alumina Economics
Why Volume Is a Lagging Signal in Commodity Businesses
One of the less-discussed features of commodity production is that volume decisions are typically made months or years before the price environment in which those volumes are ultimately sold. Expansion of mining and refining capacity is planned during periods of favourable pricing, yet the production that results from that investment arrives into whatever market conditions happen to prevail at completion.
Nanshan's situation exemplifies this lag. The 15% volume increase to 1.296 million tonnes reflects operational scaling decisions made when alumina markets were far more supportive. By the time those extra tonnes reached the market in H1 2026, the international alumina benchmark, tracked via LME Platts pricing, had declined to approximately USD 307 per tonne from roughly USD 447 per tonne in the prior corresponding period. That is a benchmark-level decline of approximately 31%, and Nanshan's realised price of USD 320 per tonne tracked closely to that benchmark, suggesting limited fixed-price contract coverage that might otherwise have smoothed the impact.
The Revenue Destruction Formula
The arithmetic of price-volume divergence is unforgiving. To illustrate the magnitude of lost pricing power, consider a simple counterfactual: if Nanshan had maintained its H1 2025 average selling price of USD 529 per tonne across its expanded H1 2026 volume of 1.296 million tonnes, revenue would have approximated USD 686 million. Instead, at USD 320 per tonne, revenue came in at USD 415 million. That USD 271 million gap represents the direct financial cost of the pricing cycle, a figure no volume growth strategy could reasonably compensate for.
In commodity businesses with high fixed-cost bases, a 39.5% price decline across a largely stable cost structure does not compress margins proportionally. It destroys them asymmetrically, because costs do not fall at the same rate as prices. This is the core mechanism behind operating leverage risk in mining and refining operations.
Furthermore, the broader implications for the aluminum and alumina markets are significant, as similar pricing pressures have been observed across other major producers navigating this same cycle.
The Cost Structure Problem: Why Margins Cannot Fall Gracefully
Fixed Cost Exposure in Alumina Refining
Alumina refining is among the most capital-intensive and operationally rigid industrial processes in the base metals sector. The refining of bauxite into alumina through the Bayer process requires sustained high-temperature caustic digestion, followed by precipitation, calcination, and handling infrastructure. The costs associated with maintaining these systems — including energy consumption for calcination kilns, labour, maintenance, and reagent supply — do not scale down proportionally when output prices decline.
This structural rigidity means that when alumina prices fall sharply, per-tonne margins compress rapidly. A refinery that achieves a USD 209 per tonne gross margin at USD 529 per tonne pricing might retain only a fraction of that margin at USD 320 per tonne, depending on where its cost curve sits. Nanshan's gross margin outcome of 15.8% implies a gross profit per tonne of approximately USD 50.5, compared to roughly USD 269 per tonne in H1 2025. That is an 81% collapse in per-tonne profitability despite a 15% increase in throughput.
The Energy Cost Dimension
A factor that is not always prominent in investor discussions of alumina pricing cycles is the role of energy. Alumina refining is highly energy-intensive, with calcination processes alone consuming significant quantities of natural gas or alternative fuels. Energy markets in 2025–2026 have remained volatile in parts of Southeast Asia, and any upward pressure on refining energy costs during a period of already-compressed selling prices would accelerate margin erosion further. Whether Nanshan benefited from stable or declining energy input costs during the period is a variable that warrants attention in any deeper analysis of the per-tonne cost structure.
What Drove the Global Alumina Price Slump?
Supply-Demand Dynamics in the Global Alumina Market
The decline in international alumina benchmark pricing from approximately USD 447 per tonne in H1 2025 to roughly USD 307 per tonne in H1 2026 reflects several intersecting forces that are worth examining individually. The commodity price impact on producers like Nanshan has consequently been substantial, with ripple effects extending across refining, smelting, and downstream fabrication sectors.
Key supply-side factors contributing to the price decline include:
- Expansion of alumina refining capacity across Southeast Asia and broader Indo-Pacific markets, adding new tonnes to global supply
- Resolution of bauxite supply disruptions that had previously constrained refining output in certain geographies, allowing idled capacity to restart
- Indonesian alumina capacity growth, where regulatory frameworks governing bauxite exports have historically created periodic cycles of supply tightness followed by abundance
- Reduced refinery curtailments globally as energy markets stabilised relative to prior periods of acute cost pressure
Key demand-side factors include:
- Fluctuations in Chinese industrial demand for primary aluminium, which directly governs smelter-grade alumina (SGA) consumption at scale
- Softening in global fabricated aluminium demand growth relative to earlier forecasts
- Shifts in procurement behaviour among primary aluminium smelters, with some operators drawing down alumina inventory rather than purchasing spot supply
It is worth noting that smelter-grade alumina, which constitutes the dominant product category for refiners like Nanshan, is consumed almost exclusively as feedstock for electrolytic aluminium production. Any slowdown in smelter operating rates or production curtailments at primary aluminium facilities flows directly into weaker SGA demand, which in turn depresses spot and benchmark pricing.
The Bauxite Quality Variable
A lesser-known factor influencing alumina production economics is the quality of the underlying bauxite feedstock. Not all bauxite is equal. Gibbsitic bauxite, which is geologically distinct from boehmitic or diasporic varieties, dissolves more readily in caustic soda at lower temperatures, reducing energy consumption during the digestion phase of refining. Producers with access to high-quality gibbsitic bauxite in proximity to their refining operations enjoy a structural cost advantage that becomes particularly valuable during periods of price compression. The bauxite profile feeding Nanshan's Indonesian operations is therefore a meaningful, if under-discussed, variable in assessing its long-term cost competitiveness.
How the Profit Decline Flowed Through to Shareholders
Dividend Reduction: A Signal of Earnings Confidence
The interim dividend cut from HKD 0.65 to HKD 0.16 per share, a reduction of approximately 75.4%, is not simply a financial consequence of lower earnings. It is a deliberate management signal about near-term earnings expectations. Boards of capital-intensive commodity companies generally resist dividend cuts unless they anticipate that the earnings environment underpinning prior payout levels is unlikely to recover quickly. The magnitude of this reduction suggests management does not expect a rapid normalisation of alumina pricing through the second half of 2026.
Basic earnings per share declining from USD 0.46 to USD 0.10 simultaneously reframes the valuation conversation. At the prior earnings run rate, investors could apply sector-typical price-to-earnings multiples and arrive at supportable valuations. At USD 0.10 per share, the earnings base is too thin to sustain comparable multiples without assuming a significant price recovery. TipRanks has noted that Nanshan's warning of a sharp profit drop was one of the more significant earnings alerts to emerge from the alumina sector in the period.
The FX Offset: Real but Unreliable
Net foreign exchange gains pushed other income from USD 8.2 million to USD 23.1 million, providing a modest offset to the operating profit collapse. However, currency gains are inherently non-recurring and cannot be incorporated into forward earnings models with any reliability. Their contribution in H1 2026 should be viewed as a one-time benefit rather than a structural improvement in the business's earnings quality.
One genuinely notable financial characteristic is finance costs of just USD 1,000, effectively zero. This reflects the group's position of carrying no borrowings, a rare feature in a sector where leverage is frequently the norm.
The next major ASX story will hit our subscribers first
Balance Sheet Resilience in a Weakened Earnings Environment
Asset Growth as a Counter-Narrative
Total assets expanded 11.0% to USD 2.496 billion despite the earnings contraction, while equity attributable to shareholders grew 10.2% to USD 2.054 billion. Asset growth during a period of profit decline is not inherently contradictory; it typically reflects capital expenditure programmes, working capital movements, or cash accumulation that does not yet appear as earnings.
In Nanshan's case, the most striking balance sheet development is the more than doubling of cash and cash equivalents to USD 666.7 million from USD 321.3 million. Combined with zero reported borrowings, this creates a liquidity position that is exceptional by the standards of the global alumina refining industry.
| Balance Sheet Metric | H1 2026 | End 2025 | Change |
|---|---|---|---|
| Total Assets | USD 2.496B | USD 2.249B | +11.0% |
| Equity (attributable) | USD 2.054B | USD 1.864B | +10.2% |
| Cash & Equivalents | USD 666.7M | USD 321.3M | +107.5% |
| Borrowings | USD 0 | USD 0 | Nil |
A debt-free balance sheet with USD 666.7 million in liquid assets is not just a financial comfort metric. In commodity cycles, it is a strategic weapon. It allows a company to fund capital expenditure from internal resources, avoid dilutive equity raises at depressed valuations, and potentially acquire distressed assets or take market share from higher-cost competitors who face refinancing pressure during the downturn.
The Indonesia Electrolytic Aluminium Project: Vertical Integration as a Cycle Hedge
Moving Down the Value Chain
Nanshan's Indonesian electrolytic aluminium development represents a logical strategic response to the earnings volatility inherent in single-commodity alumina exposure. The aluminium value chain runs from bauxite mining through alumina refining to primary aluminium smelting, with each stage carrying distinct pricing dynamics and margin profiles. By extending into electrolytic aluminium production, Nanshan gains access to LME-linked primary aluminium pricing, which does not necessarily move in lockstep with upstream alumina benchmarks.
The strategic rationale for vertical integration is straightforward: when alumina prices are depressed, primary aluminium prices may be relatively more supported, or vice versa, providing a natural earnings diversification mechanism. Importantly, an integrated producer also captures the conversion margin between alumina and aluminium that would otherwise accrue to third-party smelters purchasing its refined product. In addition, some aluminium industry leaders have pursued similar integration strategies precisely to mitigate the kind of pricing-cycle exposure that has weighed on Nanshan's H1 2026 result.
Phase One Parameters
The first phase of the Indonesian electrolytic aluminium project carries the following key characteristics:
- Target capacity: 250,000 tonnes per year of electrolytic aluminium
- Estimated investment: approximately USD 436.6 million
- Expected construction period: approximately two years
- Location: co-located with existing alumina refining operations in Indonesia, providing feedstock logistics advantages
- Feedstock sourcing: proximity to in-house alumina supply reduces transportation costs and supply chain risk
The co-location advantage deserves particular emphasis. Electrolytic aluminium smelters consume approximately two tonnes of alumina per tonne of aluminium produced. A smelter positioned adjacent to an alumina refinery eliminates the freight, handling, and storage costs associated with transporting large volumes of bulk alumina feedstock. At 250,000 tonnes per year of aluminium output, this implies alumina consumption of roughly 500,000 tonnes annually, a meaningful internal demand source that reduces Nanshan's dependence on spot alumina market pricing.
Medium-Term Expansion and Scale Ambitions
Beyond Phase 1, Nanshan has outlined plans for an additional 500,000 tonnes per year of electrolytic aluminium capacity, bringing the combined target to up to 750,000 tonnes annually. At that scale, Nanshan would become a regionally significant primary aluminium producer, not merely a large alumina refiner with a downstream investment. The strategic transformation implied by this trajectory is substantial.
| Factor | Alumina Business | Electrolytic Aluminium (Planned) |
|---|---|---|
| Commodity Exposure | Alumina spot/benchmark pricing | Primary aluminium LME pricing |
| Margin Profile | Variable; highly price-sensitive | Dependent on power cost and LME spread |
| Capital Intensity | Existing infrastructure | USD 436.6M+ Phase 1 |
| Revenue Diversification | Single commodity | Adds downstream exposure |
| Execution Risk | Operational | Construction, permitting, power supply |
Key Risks That Investors Must Weigh
Capital Deployment Timing
The most acute strategic risk Nanshan faces is the timing of capital deployment relative to its earnings cycle. Committing approximately USD 436.6 million to Phase 1 construction during a period when core alumina earnings have declined 74.8% compresses the internal funding headroom, even with USD 666.7 million in cash on hand. If alumina prices remain suppressed through the two-year construction period, cash balances will erode precisely when Phase 1 capital expenditure peaks.
Power Cost Risk in Aluminium Smelting
Electrolytic aluminium production is among the most electricity-intensive industrial processes in existence. Power typically represents 30–40% of total aluminium smelting production costs, and in some markets this figure is higher. Indonesia's industrial power pricing framework and energy mix evolution will have a material influence on the economics of Nanshan's smelter project. The industrial commodity pricing dynamics relevant to energy-intensive production are, furthermore, particularly complex in emerging market contexts where regulatory frameworks can shift. Access to competitively priced, reliable electricity is not merely a cost variable; it determines whether the project generates returns above the cost of capital or operates as a break-even or loss-making asset.
Permitting and Execution Complexity
Indonesian industrial development involves a regulatory environment that requires careful navigation. Permitting for large-scale smelting facilities involves environmental impact assessments, industrial zone compliance, and coordination with electricity providers. Construction timeline slippage in complex industrial projects is common, and any delays to commissioning would extend the period during which capital is deployed without generating revenue.
Forward-Looking Indicators Worth Monitoring
For investors tracking the Nanshan alumina profit drop and its recovery trajectory, the following metrics provide the most actionable forward signals:
- LME Platts alumina benchmark pricing relative to the H1 2026 average of USD 307 per tonne. A sustained recovery toward USD 400–450 per tonne would materially restore gross margins given that the cost base has remained broadly stable.
- Phase 1 construction commencement and milestone announcements for the Indonesian electrolytic aluminium project, which will clarify whether the two-year build timeline is on track.
- Cash drawdown rate against the USD 666.7 million liquidity buffer, which indicates how aggressively capital is being deployed and whether internal funding is sufficient without debt.
- Dividend policy signalling, as any restoration of the payout ratio toward prior levels would indicate management confidence in earnings normalisation.
- Global bauxite supply conditions, particularly in Guinea and Indonesia, which influence both refining input costs and broader alumina supply-demand balances.
- Chinese primary aluminium production data, which remains the single largest demand driver for global smelter-grade alumina and therefore the most important upstream signal for alumina pricing.
Frequently Asked Questions
Why did Nanshan's alumina profit fall so sharply in H1 2026?
A 39.5% decline in average selling price from USD 529 per tonne to USD 320 per tonne was the primary driver. This price collapse overwhelmed a 15% increase in sales volume, compressing gross margin from 50.9% to 15.8% and reducing gross profit from USD 303.9 million to USD 65.5 million.
How much did Nanshan's revenue fall in H1 2026?
Revenue declined 30.5% to USD 415.0 million from USD 596.8 million in H1 2025.
Did Nanshan cut its dividend in response to lower profits?
Yes. The interim dividend was reduced to HKD 0.16 per share from HKD 0.65 per share, representing a cut of approximately 75.4%.
What is Nanshan's Indonesia aluminium project?
A phased electrolytic aluminium development targeting 250,000 tonnes per year in Phase 1, with an estimated investment of approximately USD 436.6 million, co-located with existing alumina operations, and a further 500,000 tonnes per year planned in the medium term.
How does Nanshan's cash position support its expansion despite lower earnings?
Cash and cash equivalents more than doubled to USD 666.7 million with zero borrowings, providing the liquidity to fund Phase 1 capital expenditure without requiring debt financing under current market conditions.
What would need to happen for Nanshan's profitability to recover?
A sustained recovery in international alumina benchmark pricing toward or above USD 400–450 per tonne would materially restore gross margins, given that the underlying cost structure has remained broadly stable through the pricing downturn.
The Central Lesson: Price Dominates Volume in Commodity Economics
Nanshan's H1 2026 result is a cleanly structured demonstration of a principle that experienced commodity investors understand but that is frequently underestimated by those new to resource sectors. Selling 15% more of a commodity that has fallen in price by nearly 40% does not produce more money. It produces dramatically less, while simultaneously stretching operational resources across a larger production base. The Nanshan alumina profit drop on lower prices is not a consequence of operational failure; it is a consequence of commodity price mechanics operating exactly as they always do.
What distinguishes Nanshan's situation from many commodity producers in similar circumstances is the financial resilience of its balance sheet. A debt-free structure with USD 666.7 million in cash transforms a potentially existential earnings downturn into a manageable, if uncomfortable, cycle trough. The Indonesia electrolytic aluminium project represents a genuine strategic pivot that could meaningfully reduce the company's sensitivity to alumina-specific pricing cycles over the medium term. However, investors should weigh that opportunity against the execution, power cost, and capital timing risks that accompany any large-scale smelter development in a period of compressed core earnings.
The recovery narrative for this business ultimately depends on a single variable above all others: the trajectory of international alumina benchmark pricing. Until that recovers toward more supportive levels, higher volumes and a strong cash position are stabilising forces but not profit restorers.
Disclaimer: This article is intended for informational and educational purposes only and does not constitute financial advice. All financial figures are sourced from publicly reported company data. Forecasts, scenario analyses, and market projections involve inherent uncertainty and should not be relied upon as the basis for investment decisions. Past performance of commodity prices and company earnings is not indicative of future results. Readers should conduct their own independent research and consult qualified financial advisers before making any investment decisions.
Want to Identify the Next Major Mineral Discovery Before the Broader Market Does?
While Nanshan's result illustrates how dramatically commodity price cycles can reshape returns, Discovery Alert's proprietary Discovery IQ model delivers real-time alerts on significant ASX mineral discoveries — instantly translating complex resource data into actionable opportunities for investors at every experience level. Explore how historic discoveries have generated exceptional returns and begin your 14-day free trial today to position yourself ahead of the market.