
May 21, 2026
The Hidden Vulnerability in America's LNG Export Chain
The reliability of U.S. liquefied natural gas exports is not simply a function of how much gas sits underground or how many liquefaction trains are operational. It depends, fundamentally, on the integrity of the midstream infrastructure connecting wellheads to tidewater terminals. That connection is far more fragile than most market participants appreciate, and nowhere is this more apparent than along the Gulf Coast's intrastate pipeline network, where a single gas quality exceedance event can ripple through billions of cubic feet of daily supply commitments within hours.
Understanding how LEAP pipeline gas flows recover on Haynesville pipeline infrastructure, and what triggers their disruption in the first place, offers a window into a structural vulnerability that LNG offtake counterparties, energy traders, and feedgas schedulers increasingly cannot afford to ignore. Furthermore, the LNG supply outlook for 2025 and beyond makes this analysis all the more pressing.
When big ASX news breaks, our subscribers know first
LEAP Pipeline: The Anatomy of a Critical Intrastate Conduit
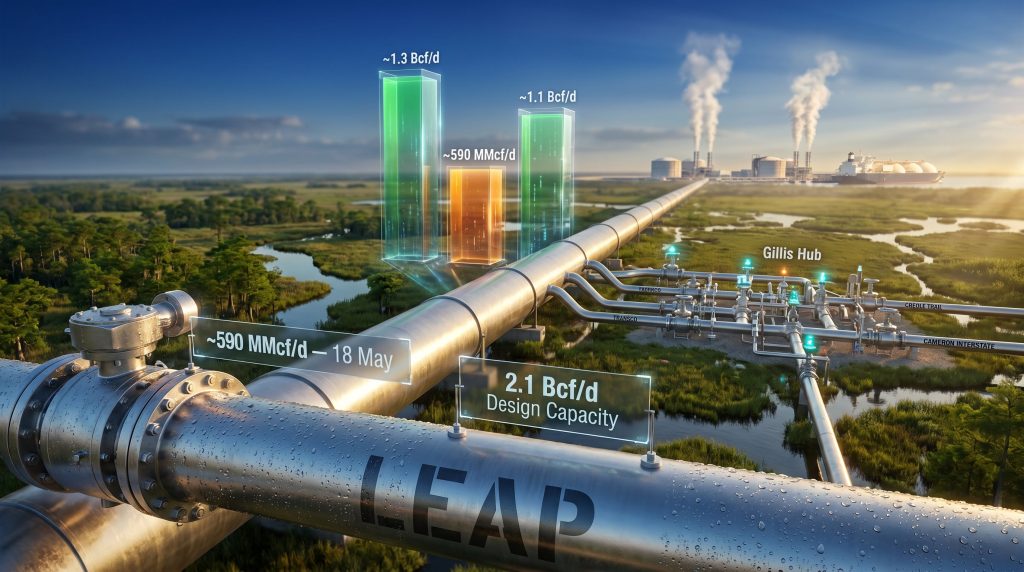
DT Midstream's Louisiana Energy Access Project, universally known as LEAP, spans 221 miles from the producing heartland of northwest Louisiana southward to the Gillis Hub, situated north of Lake Charles. At full design capacity, the system moves 2.1 billion cubic feet per day (Bcf/d) of Haynesville Shale gas toward one of the most consequential gas distribution nodes in North America.
What makes LEAP strategically distinct from typical gathering systems is its end-destination orientation. The Gillis Hub is not merely a metering point; it is a multi-pipeline interchange with connections to some of the most LNG-critical transmission infrastructure in the country:
- Creole Trail pipeline (Cheniere Energy) feeding Sabine Pass LNG
- Cameron Interstate pipeline supplying Sempra's Cameron LNG terminal
- Transco (Williams) providing connectivity to the Southeast and Northeast corridor
- Acadian pipeline (Enterprise Products) serving Gulf Coast industrial demand
- Trunkline (Energy Transfer) with storage and Gulf Coast access
- Texas Eastern Transmission (Enbridge) connecting to broader interstate networks
This multi-spoke connectivity at the Gillis Hub gives LEAP a hub-and-spoke architecture that amplifies both its value and its systemic importance. When LEAP flows falter, the disruption does not stay contained at a single point — it propagates outward through each of these receiving systems simultaneously.
Gas Quality Non-Compliance: The Operational Risk That Rarely Makes Headlines
What Water Vapor Does to a Pipeline System
Pipeline tariff specifications exist for technically precise reasons. When water vapor content in a gas stream exceeds contractually stipulated thresholds, the consequences cascade through the system in ways that go well beyond regulatory inconvenience.
Excessive moisture in gas streams creates conditions for hydrate formation, where water molecules bond with hydrocarbon molecules under pressure and cold temperatures to create ice-like solid plugs capable of blocking pipes entirely. High moisture also accelerates internal corrosion, damages compressor seals, and degrades the combustion quality standards that downstream industrial users and LNG liquefaction processes depend on.
Industry Insight: Gas quality events are technically distinct from mechanical failures or weather-related force majeure, yet their operational consequences can be just as severe. Unlike a pipeline rupture, which has a visible cause, moisture exceedances often require systematic tracing back through gathering lines to identify the originating well pad or separator failure.
How a Quality Rejection Event Unfolds
The sequence of events that follows a quality compliance failure typically moves through a predictable operational cascade:
- A receiving interstate pipeline detects that inbound gas exceeds moisture specification limits
- The receiving pipeline issues a quality restriction notice, halting or curtailing receipts
- Upstream shippers must reduce nominations or divert volumes to alternative interconnects
- Downstream feedgas deliveries to LNG terminals decline, potentially triggering train load-shedding
- Midstream operators trace the contamination source through gathering system monitoring
- The originating segment or well pad is isolated and remediated
- The receiving pipeline issues a resolution notice confirming quality restoration
- Nominations and receipts resume at recovering volumes
While this process often resolves within 24 to 72 hours, the downstream scheduling effects on LNG production can linger beyond the immediate event window, particularly when cargo nominations have already been issued.
The May 2026 LEAP Flow Disruption: What the Data Shows
Volume Profile Across the Event Window
The LEAP disruption that unfolded in May 2026 provides a precise case study in how LEAP pipeline gas flows recover on Haynesville pipeline networks following quality events. Pipeline nomination and flow data document the event with clarity:
| Period | Approximate Flow Volume | Operational Status |
|---|---|---|
| 1 to 17 May (baseline) | ~1.3 Bcf/d | Normal operating range |
| 18 May (disruption peak) | ~590 MMcf/d | ~55% reduction from baseline |
| 20 May (recovery nominations) | ~1.1 Bcf/d | Partial recovery underway |
The trough-level volume of approximately 590 million cubic feet per day (MMcf/d) on 18 May represents a loss of roughly 710 MMcf/d compared to the preceding two-and-a-half-week average. By any measure, this constitutes a significant short-term supply shock to the downstream pipeline systems and LNG feedgas schedulers depending on LEAP's output.
Downstream Notifications and Recovery Timeline
The resolution sequence involved multiple pipeline operators issuing formal customer notices within a two-day window:
- 19 May: Williams-operated Transco notified customers that the quality issue on LEAP had been resolved and that gas receipts would resume that evening
- 20 May: Cheniere's Creole Trail pipeline, the primary feedgas conduit to Sabine Pass LNG, issued its own notice confirming receipt resumption
- 20 May: Shipper nominations onto select interstate pipelines from LEAP reached approximately 1.1 Bcf/d, marking a partial recovery toward the pre-disruption baseline
The roughly 48-hour disruption window is short by absolute standards, but its concentration across peak LNG feedgas delivery schedules amplified its market significance. Consequently, natural gas price trends in the period reflected the sensitivity of Gulf Coast markets to intrastate pipeline reliability.
Sabine Pass LNG Feedgas Dependency: Why 15% Through One Pipe Matters
LEAP's Proportional Contribution to Sabine Pass Feedgas
Sabine Pass LNG, operated by Cheniere Energy, holds a nameplate liquefaction capacity of approximately 33 million tonnes per year (Mt/yr) and operates with a feedgas requirement of roughly 4.7 Bcf/d under normal conditions. During the baseline period from 1 to 17 May 2026, LEAP contributed an estimated 690 MMcf/d to Sabine Pass's total feedgas intake, representing close to 15% of the terminal's total feedgas requirements sourced through a single intrastate pipeline system.
Why This Concentration Matters: LNG liquefaction operates on tightly optimised thermodynamic cycles. Individual trains within a multi-train facility are designed to run at or near nameplate capacity rather than at highly variable rates. When feedgas supply drops sharply and unexpectedly, operators face a choice between reducing liquefaction rates across multiple trains or drawing down the limited pipeline storage buffer available in interconnecting systems. Neither option is operationally neutral, and both carry scheduling consequences that extend to cargo loading timetables.
Cameron LNG: The Compounding Maintenance Factor
The May 2026 quality event did not occur against a clean operational backdrop at Cameron LNG either. Sempra's 15 Mt/yr Cameron terminal had already commenced planned maintenance on one of its three liquefaction trains on 30 April 2026, which progressively reduced LEAP's delivery volumes to that facility:
| Period | Cameron LNG Receipts from LEAP | Context |
|---|---|---|
| April 2026 average | ~100 MMcf/d | Pre-maintenance baseline |
| 1 to 17 May average | ~25 MMcf/d | Reduced due to train maintenance |
| 18 May (disruption) | Minimal | Combined quality and maintenance impact |
This illustrates a dynamic that market participants sometimes underweight: planned maintenance and unplanned quality events can coincide to create compounding supply-side pressure on Gulf Coast LNG output, even when neither event in isolation would constitute a material disruption.
LEAP's Multi-Month Recovery Trajectory: Broader Context
From Volume Softness to Structural Recovery
The May 2026 disruption episode cannot be interpreted in isolation. LEAP had experienced a softer volume period through much of late 2024, before embarking on a sustained recovery trajectory that predates the quality event. In addition, Haynesville shale gas flows to the Gulf Coast have been supported by improving infrastructure fundamentals throughout this period:
- By February 2025, sampled interstate pipeline receipts from LEAP exceeded 1.0 Bcf/d for the first time since May 2024
- By late February 2025, sampled volumes had climbed above 1.2 Bcf/d
- Actual throughput volumes are estimated to run approximately 300 MMcf/d higher than sample data suggests, due to LEAP's interconnect with TC Energy's Gillis Access system
This sampling gap is a lesser-known feature of Haynesville basin flow analytics. Market participants relying solely on publicly observable nomination data may systematically underestimate actual LEAP throughput, creating a persistent intelligence asymmetry between those who understand the Gillis Access interconnect and those who do not.
Three Structural Forces Driving Volume Recovery
The recovery in LEAP flows is not simply a bounce from a temporary soft patch. Three distinct structural forces are supporting the upward trend:
- New takeaway capacity additions across the Haynesville basin are easing the chronic bottlenecking that previously capped producer netbacks and incentivised volume curtailment
- Strengthening Gulf Coast and LNG-linked demand is pulling incremental Haynesville volumes southward, with growing export commitments underpinning contracted feedgas volumes
- LEAP's own capacity expansion programme, which has scaled the system from approximately 1.0 Bcf/d at initial commissioning to the current 2.1 Bcf/d design capacity through phased incremental builds
The next major ASX story will hit our subscribers first
LEAP's Phased Capacity Build-Out: A Critical Infrastructure Timeline
How the System Has Scaled
| Expansion Stage | Approximate Capacity | Cumulative System Capacity |
|---|---|---|
| Initial system commissioning | ~1.0 Bcf/d | 1.0 Bcf/d |
| Mid-phase expansion increment | ~0.9 Bcf/d added | ~1.9 Bcf/d |
| Full design capacity achieved | Additional increment | 2.1 Bcf/d |
As of June 2024, the U.S. Energy Information Administration recognised LEAP as capable of transporting approximately 1.9 Bcf/d from the Haynesville region toward Gulf Coast markets, a figure reflecting the pipeline's substantially expanded role in regional gas takeaway compared to its original configuration.
This phased capacity growth matters for understanding Haynesville's monetisation potential. A basin that sits geographically close to LNG export demand centres only realises that proximity advantage if the connecting infrastructure exists at sufficient scale. LEAP's expansion directly improves Haynesville producers' ability to capture LNG-linked pricing rather than being discounted at the wellhead due to takeaway constraints.
Market Implications of LEAP Flow Volatility
Short-Term Price and Scheduling Effects
When LEAP experiences significant flow reductions, the downstream market effects span multiple pricing and operational domains:
- Henry Hub basis spreads can widen temporarily as Gulf Coast supply tightens relative to broader market availability
- Transco Zone 3 pricing may reflect reduced inbound intrastate supply during disruption windows
- LNG cargo scheduling faces adjustment risk if feedgas shortfalls persist beyond the roughly 24-hour buffer that liquefaction facilities can typically absorb without affecting train throughput
- Power generation dispatch in Louisiana and adjacent states may shift toward alternative fuel sources or demand response programmes during acute supply disruption periods
However, understanding the broader U.S. gas price forecast is equally important when contextualising how flow disruptions translate into price movements across interconnected markets.
The Structural Concentration Risk for LNG Feedgas Security
The LEAP episode surfaces a broader structural challenge for Gulf Coast LNG operators: the concentration of Haynesville gas flows through a limited number of intrastate pipeline corridors creates single-point-of-failure exposure that offtake counterparties and terminal operators must factor into their supply security planning frameworks.
The Gillis Hub's multi-pipeline connectivity does provide meaningful resilience. The presence of Acadian, Trunkline, Texas Eastern, Transco, and the Cameron Interstate pipeline as alternative routing options means that complete supply isolation is a very low-probability outcome. However, during a quality exceedance event, those alternative routes may not carry sufficient spare capacity to fully offset a 710 MMcf/d loss on LEAP within the same operating day.
Structural Risk Note: As U.S. LNG export capacity continues to expand through the late 2020s, the aggregate feedgas demand placed on Haynesville intrastate infrastructure will grow. The pipeline resilience architecture that appears adequate for current export volumes may require reassessment as new liquefaction capacity comes online and feedgas requirements scale upward.
This reality is pushing midstream operators toward more granular upstream gas quality monitoring at the gathering system level, including real-time moisture sensing at individual well pad interconnects. The goal is to detect quality exceedances before they propagate to receiving interstate pipelines, reducing both the depth and duration of flow disruption events. Furthermore, gas price trade impacts from geopolitical and policy shifts add further complexity to how these disruptions are absorbed by global markets.
LEAP vs. Broader Haynesville Takeaway Infrastructure
| Pipeline | Operator | Primary Destination | Design Orientation |
|---|---|---|---|
| LEAP | DT Midstream | Gillis Hub / LNG corridor | Dedicated LNG feedgas routing |
| Acadian | Enterprise Products | Gulf Coast industrial corridor | Industrial and power demand |
| Trunkline | Energy Transfer | Gulf Coast / storage | Multi-purpose Gulf Coast |
| Texas Eastern (TETCO) | Enbridge | Northeast / Gulf Coast | Multi-region interstate |
| Transco | Williams | Southeast / Northeast | High-capacity interstate |
LEAP's differentiated positioning among Haynesville takeaway infrastructure lies in its purpose-built intrastate design oriented specifically toward Gulf Coast LNG feedgas delivery. Its relatively direct routing from producing fields to the Gillis Hub, without the longer interstate haul requirements of systems like Transco or Texas Eastern, gives Haynesville gas a transport cost and transit time advantage that competing supply basins cannot replicate. In addition, energy export challenges faced by other major producing nations underscore why U.S. infrastructure reliability carries such strategic weight globally.
Frequently Asked Questions: LEAP Pipeline and Haynesville Gas Flows
What caused the LEAP pipeline flow disruption in May 2026?
The disruption resulted from excessive water vapor content in the gas stream that triggered quality compliance rejections from receiving interstate pipelines. This was a gas quality event rather than a mechanical failure or weather-related incident.
How long did the LEAP flow disruption last?
Volumes dropped sharply on 18 May and began recovering by 20 May following resolution notices from Transco and Cheniere's Creole Trail pipeline, representing a disruption window of approximately 48 hours.
How much gas does LEAP supply to Sabine Pass LNG under normal conditions?
During the May 2026 baseline period, LEAP delivered approximately 690 MMcf/d to Sabine Pass LNG's feedgas supply, constituting roughly 15% of the terminal's total feedgas intake of around 4.7 Bcf/d.
What is the LEAP pipeline's total capacity?
DT Midstream's LEAP system has a full design capacity of 2.1 Bcf/d across its 221-mile route from northwest Louisiana to the Gillis Hub.
Why is Haynesville gas particularly valuable for U.S. LNG exports?
The Haynesville Shale's geographic proximity to Louisiana's Gulf Coast LNG export facilities gives it a fundamental transport cost and timing advantage over competing supply basins such as Appalachia or the Permian. Shorter intrastate pipeline hauls translate into lower basis differentials and more predictable feedgas delivery schedules for terminal operators.
Does LEAP's sampling data fully capture actual throughput?
Not entirely. Because LEAP interconnects with TC Energy's Gillis Access system, actual throughput volumes are estimated to run approximately 300 MMcf/d above what standard pipeline sampling data captures, making sampling-based analyses a potential source of systematic underestimation for market participants tracking Haynesville basin flows.
Key Takeaways
- LEAP is a 2.1 Bcf/d intrastate pipeline system connecting Haynesville Shale output to Louisiana's LNG export corridor via the multi-pipeline Gillis Hub
- A gas quality exceedance event caused flows to collapse from a ~1.3 Bcf/d baseline to approximately 590 MMcf/d on 18 May 2026, a reduction of roughly 55%
- Recovery to approximately 1.1 Bcf/d was underway by 20 May following quality resolution notices from Transco and Creole Trail
- LEAP supplies an estimated 15% of Sabine Pass LNG's feedgas under normal operations, making LEAP pipeline gas flows recover on Haynesville pipeline infrastructure a material concern for one of the world's largest LNG export facilities
- A planned Cameron LNG liquefaction train maintenance outage that began 30 April compounded the overall Gulf Coast supply picture during the disruption period
- Actual LEAP throughput likely exceeds sampled pipeline data by approximately 300 MMcf/d due to the Gillis Access interconnect, a factor frequently overlooked in publicly available flow analysis
- Longer-term, LEAP volumes have been on a structural recovery trajectory since early 2025, supported by phased capacity expansions, improving Haynesville takeaway, and strengthening LNG-linked demand pulls from the Gulf Coast
This article is intended for informational purposes only and does not constitute financial, trading, or investment advice. Data references and flow volumes are based on publicly available pipeline reporting and market intelligence sources. Readers should conduct independent verification of all figures before making commercial or investment decisions based on this content.
Want to Capitalise on the Next Major Resource Discovery Before the Market Moves?
While LNG infrastructure vulnerabilities reshape global energy supply chains, significant mineral discoveries on the ASX continue to create substantial investment opportunities for those positioned early — Discovery Alert's proprietary Discovery IQ model delivers real-time alerts the moment major discoveries are announced, turning complex data across 30-plus commodities into clear, actionable insights. Explore historic discovery returns on Discovery Alert's dedicated discoveries page and start your 14-day free trial today to ensure you're never the last to know.