July 16, 2026
How the LME Aluminium Forward Curve Reveals Market Structure Beyond the Headlines
Commodity markets have a tendency to generate noise at the daily price level while the most meaningful signals are buried in the structural mechanics beneath. A single session's modest decline in the LME aluminium offer price falls and opening stock declines tells you relatively little in isolation. However, combine that move with forward curve shape, warehouse stock trajectory, warrant dynamics, and upstream cost ratios, and a far more coherent picture of market direction emerges. The data recorded on May 20, 2026 offers exactly that kind of layered reading opportunity.
When big ASX news breaks, our subscribers know first
How LME Aluminium Pricing Contracts Are Structured and Why Each Matters
Understanding the Cash, Three-Month, and Forward Contract Hierarchy
The London Metal Exchange operates aluminium pricing across a hierarchy of contract dates, each serving a distinct function for market participants. The cash contract reflects the price for immediate delivery and settlement, used primarily as a spot reference. The three-month contract is the most critical benchmark in global aluminium trade, forming the basis for the vast majority of physical contracts between producers, traders, and downstream buyers worldwide. Long-dated forward contracts, such as the December 2027 contract, represent the market's collective view of supply and demand conditions over a multi-year horizon.
Understanding how each tier behaves relative to the others provides far more analytical depth than any single price point. Furthermore, when near-term contracts soften while long-dated contracts hold firm, it signals that participants are responding to short-term noise rather than revising their structural outlook.
The Role of Bid-Offer Spreads in Assessing Market Liquidity
Bid-offer spreads are one of the least discussed but most informative indicators of market liquidity and participant confidence. A narrow spread indicates abundant liquidity and strong two-way interest, while a widening spread suggests reduced market depth or elevated uncertainty among traders willing to make prices.
The May 20, 2026 contract data reveals a clear liquidity gradient across the forward curve:
| Contract | Bid Price (USD/t) | Offer Price (USD/t) | Spread (USD/t) | Daily Change |
|---|---|---|---|---|
| Cash | $3,643 | $3,644 | $1 | -0.57% |
| 3-Month | $3,589 | $3,590 | $1 | -0.61% |
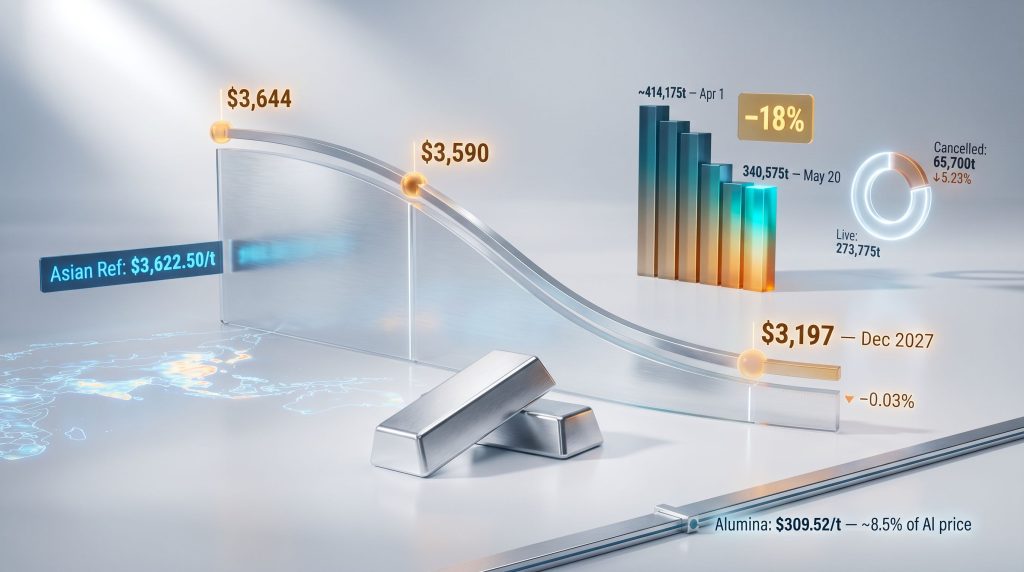
| Dec 2027 | $3,192 | $3,197 | $5 | -0.03% |
The $1 spread on both the cash and three-month contracts reflects highly liquid, actively traded instruments where market makers are confident in pricing. The $5 spread on the December 2027 contract, by contrast, is a natural function of reduced trading volume and greater uncertainty over an 18-month horizon. This wider spread does not signal distress; it reflects the structural reality that fewer participants are willing to commit capital to prices nearly two years forward, creating a natural premium for the price-making function.
What Did LME Aluminium Prices Do on May 20, 2026?
Near-Term Price Softening: Consolidation or Reversal?
On May 20, 2026, the LME aluminium offer price fell 0.57% to $3,644 per tonne on a cash basis, while the three-month offer price declined 0.61% to $3,590 per tonne. The December 2027 forward contract eased just 0.03% to $3,197 per tonne, a move so marginal it is statistically indistinguishable from unchanged. According to recent LME data, these movements reflect a broader pattern of price adjustment across aluminium markets.
The asymmetry between near-term price softness and long-dated price stability is one of the most reliable indicators that a daily decline represents consolidation rather than a structural trend reversal.
Contextualising these moves within the broader price trajectory is essential. Aluminium prices have climbed approximately 46.59% on a year-on-year basis through mid-2026, and the metal was trading roughly 2.8% higher over the preceding 30 days heading into May 20. A sub-1% intraday decline against that backdrop is entirely consistent with normal profit-taking behaviour after an extended rally.
The Asian Reference Price as a Regional Pricing Signal
The LME aluminium three-month Asian Reference Price stood at $3,622.50 per tonne on May 20, a figure that warrants close attention because it sits approximately $32.50 per tonne above the global three-month offer price of $3,590 per tonne. This premium is not arbitrary. Regional reference prices on the LME are calculated during Asian trading hours using prices submitted by designated market participants, and the premium embedded in the Asian figure reflects both regional demand dynamics and the timing differential between Asian and London market activity.
For downstream aluminium buyers across manufacturing hubs in China, Japan, South Korea, and Southeast Asia, the Asian Reference Price functions as the critical procurement benchmark. Consequently, when it holds at a premium to the global benchmark, it suggests that demand conditions in Asia are providing a floor beneath global pricing, even when London-session trading dips.
How Should Traders Interpret the LME Aluminium Forward Curve on May 20?
Reading the Backwardation-Adjacent Structure Across Contract Dates
In metals markets, a contango structure describes a forward curve where prices rise progressively through time, reflecting the cost of carrying physical inventory. Backwardation describes the inverse: nearby prices sit above forward prices, typically signalling immediate supply tightness or strong prompt demand.
The May 20, 2026 forward curve presents a clear downward slope: cash at $3,644/t, three-month at $3,590/t, and December 2027 at $3,197/t. This is a classic backwardation-adjacent structure, where the prompt market commands a premium over deferred dates. The market is communicating that near-term supply is considered tighter than medium-term supply, and that participants expect production capacity to gradually rebalance over the coming 18 months.
Why the December 2027 Contract Barely Moved
The near-complete stability of the December 2027 contract, down just 0.03% while near-term contracts fell more than 0.60%, carries a specific analytical implication. Long-dated contract holders tend to be producers and large industrial consumers engaged in multi-year hedging programmes. These participants are not reacting to daily price moves; they are managing structural exposure.
When they do not revise their long-dated positions in response to a near-term dip, it signals confidence that the medium-term supply-demand balance does not require repricing. If the market genuinely believed that a demand downturn was developing, long-dated contracts would typically weaken in tandem with or ahead of near-term contracts. The absence of that adjustment on May 20 is itself a bullish structural signal.
What Is Happening to LME Aluminium Warehouse Stocks and Why It Matters
The April to May 2026 Inventory Drawdown: Scale and Significance
Warehouse stock movements on the LME are among the most closely watched physical market indicators available in real time. The drawdown trajectory recorded through April and May 2026 is structurally significant. Furthermore, the broader context of the aluminum and alumina markets reinforces why inventory shifts carry such weight in current pricing dynamics.
| Date | LME Opening Stock (Tonnes) | Change from April 1 |
|---|---|---|
| 1 April 2026 | ~414,175 | Baseline |
| 28 April 2026 | ~372,700 | -9.9% |
| 19 May 2026 | 341,775 | -17.5% |
| 20 May 2026 | 340,575 | -17.8% |
Opening stock declined to 340,575 tonnes on May 20 from 341,775 tonnes on May 19, a single-session fall of approximately 0.35%. However, the cumulative picture is far more striking: total LME-registered aluminium inventory has contracted by roughly 18% over seven weeks from early April levels. In commodity market terms, a sustained drawdown of this magnitude is a structurally bullish signal, regardless of what daily prices are doing on any given session.
One underappreciated dynamic in LME warehouse analysis is the geographic concentration of registered stocks. Metal registered at LME warehouses is not uniformly distributed; it tends to cluster in a small number of key locations including Malaysia, the Netherlands, and the United States. When drawdowns are concentrated in specific locations, they can signal regional rather than global tightening, which may not translate evenly into price recovery across all physical premium markets. In addition, the performance of aluminium premiums in specific regions can often diverge significantly from headline LME movements.
Understanding Live Warrants vs. Cancelled Warrants: A Key Operational Distinction
Key Concept: In LME warehouse mechanics, live warrants represent metal that remains available for trading and delivery within the LME system. Cancelled warrants identify metal that has been earmarked for physical withdrawal from registered warehouses. A rising live warrant count alongside falling cancelled warrants can indicate that metal is being re-registered rather than removed, which is a materially different signal from straightforward physical demand.
On May 20, 2026, the warrant data told a nuanced story:
- Live warrants: 273,775 tonnes, up 0.93% from 271,250 tonnes on May 19
- Cancelled warrants: 65,700 tonnes, down 5.23% from 69,325 tonnes on May 19
The 5.23% single-session drop in cancelled warrants is the more analytically interesting figure. Cancelled warrants represent active withdrawal intentions, so a meaningful decline in their volume suggests that physical buyers paused or reversed their drawdown plans on May 20. This is consistent with the modest price dip on the same day: when the cash price softens slightly, some buyers may choose to defer physical lifting in anticipation of procuring at a marginally lower cost. This behaviour is rational and does not indicate weakening underlying demand.
The simultaneous increase in live warrants further supports this interpretation. Metal that might have been in the process of cancellation was either re-registered or newly added to the system, temporarily reversing the dominant drawdown trend without disrupting the multi-week structural decline in total stocks.
Inventory-to-Price Divergence: Reading Between the Lines
One of the more sophisticated analytical frameworks applied to LME metals markets involves tracking the divergence between physical inventory trends and daily price movements. When total stocks are falling steadily but daily prices experience occasional softness, the market is typically in a demand-led tightening phase where short-term price volatility reflects financial market positioning rather than physical supply surplus.
Historical aluminium market cycles have repeatedly demonstrated this pattern: sustained inventory drawdowns across 6 to 10 week periods have frequently preceded renewed price strength. The current trajectory, with stocks down 18% from early April and prices still elevated on a year-on-year basis, is consistent with that historical sequence.
Where Does Alumina Fit Into the Aluminium Pricing Picture?
The Alumina-to-Aluminium Price Ratio as a Smelter Margin Indicator
LME alumina Platts price stood at $309.52 per tonne on May 20, which places the alumina-to-aluminium price ratio at approximately 8.5% when measured against the cash offer price of $3,644 per tonne. This ratio is a critical margin indicator for primary aluminium smelters, because alumina is the primary feedstock input in the electrolytic reduction process that produces aluminium metal. Understanding the bauxite supply chain that feeds into alumina production provides additional context for smelter cost structures.
The full cost chain moving from bauxite through to primary aluminium follows a well-established structure:
- Bauxite mining: Raw ore extracted with aluminium oxide content typically ranging from 30% to 60% depending on ore quality and deposit type
- Refining (Bayer Process): Bauxite refined into aluminium oxide (alumina) at a typical conversion ratio of approximately 2 to 3 tonnes of bauxite per tonne of alumina
- Smelting (Hall-Heroult Process): Alumina reduced to primary aluminium metal using electrolysis, consuming approximately 1.9 to 2.0 tonnes of alumina per tonne of aluminium produced
- Primary aluminium pricing: Final metal priced against LME benchmarks with regional physical premiums applied
When alumina prices rise faster than aluminium prices, the ratio expands and smelter margins compress. At 8.5%, the current ratio sits within a manageable range for most smelters operating at modern efficiency standards, though energy costs — which can account for 30% to 40% of total smelting costs depending on the region — are equally critical to full margin analysis.
The next major ASX story will hit our subscribers first
What Are the Broader Market Forces Behind LME Aluminium's May 2026 Trajectory?
Supply-Side Risk Premiums Embedded in Elevated Pricing
The approximately 46.59% year-on-year price gain recorded through mid-2026 is not purely a demand story. Elevated aluminium prices at this level typically contain a meaningful supply-side risk premium, reflecting market concerns about production disruptions, energy availability constraints at smelters, and geopolitical influences on supply chain reliability. These premiums can persist for extended periods even when actual supply disruptions are limited, because the market prices the possibility of disruption rather than confirmed volume loss.
A less commonly understood aspect of aluminium's supply dynamics is the significant role of curtailment optionality among smelters. Unlike many commodities, primary aluminium production can be reduced relatively quickly in response to energy cost spikes or low aluminium prices, and then restarted over a period of weeks to months. This creates a non-linear supply response function that can sustain price premiums during periods of energy market volatility, even without permanent capacity loss. Moreover, US aluminium tariffs have added another dimension to supply-side cost pressures for many market participants.
Demand-Side Consolidation: Profit-Taking Versus Structural Slowdown
Distinguishing between technical profit-taking and genuine demand deterioration requires looking beyond daily price moves at order flow data, downstream production schedules, and forward purchasing behaviour. Key demand sectors that drive aluminium consumption growth trajectories include:
- Automotive lightweighting: Ongoing vehicle electrification is increasing aluminium intensity per vehicle as manufacturers substitute steel to offset battery weight
- Renewable energy infrastructure: Solar panel mounting systems, wind turbine nacelle components, and transmission cable applications represent a growing structural demand pool
- Packaging and consumer goods: Aluminium beverage cans and flexible packaging represent the largest single end-use category by volume globally
- Construction and architectural applications: Curtain wall systems, window profiles, and roofing applications contribute significant sustained demand particularly in Asian markets
The May 20 price dip carries none of the hallmarks of a genuine demand slowdown. There was no corresponding collapse in forward purchasing, no significant increase in cancelled warrants that would signal buyers stepping back from the physical market, and no deterioration in the Asian Reference Price premium.
The US Dollar Relationship and Macroeconomic Sensitivity
LME aluminium, like all dollar-denominated commodities, maintains an inverse relationship with US dollar strength under most market conditions. When the dollar appreciates, dollar-denominated metals become more expensive for non-dollar buyers, which can temporarily suppress demand and depress prices even when physical fundamentals are supportive.
Periods of financial market risk aversion that drive dollar strength can therefore create short-term aluminium price weakness that diverges from the underlying physical supply-demand balance. This macro sensitivity is one of the reasons why single-session price moves of less than 1% carry limited analytical weight in isolation. They are as likely to reflect currency dynamics or broader equity market sentiment as they are to reflect any genuine change in aluminium supply or demand conditions. According to Bloomberg's analysis of recent aluminium market moves, the broader context of macro-driven price swings can be substantial.
How LME Aluminium Prices Translate Into Physical Market Transactions
From LME Benchmark to Final Transaction Price
The journey from an LME benchmark price to the final price paid in a physical aluminium transaction involves several additive layers that many non-specialist observers overlook:
- LME cash or three-month price established as the global base benchmark
- Regional physical premium applied (examples include the Midwest Premium in the United States, the European Duty-Paid Premium, and the Japan CIF Premium for Asian transactions)
- Product-specific shape premium added to account for the additional processing cost of delivering specific product forms such as billet, slab, or rod rather than standard ingot
- Alloy premium incorporated where applicable for specific aluminium alloy grades required by end users
- Final negotiated transaction price agreed between buyer and seller incorporating all of the above components
This multi-layered structure means that a $20 to $30 per tonne movement in the LME benchmark translates into a proportionally smaller change in the fully loaded physical price. Downstream manufacturers tracking their input costs must monitor both LME benchmark movements and regional premium trajectories simultaneously. For context on how major aluminium producers navigate these pricing layers, the strategies vary considerably by scale and geography.
FAQ: LME Aluminium Prices and Warehouse Stocks Explained
What Does a Falling LME Aluminium Offer Price Mean for Buyers?
A decline in the LME offer price reduces the benchmark component of physical aluminium procurement costs, though the total transaction price also incorporates regional premiums and product-specific premiums that may not move in the same direction or magnitude.
Why Do LME Warehouse Stock Levels Matter if Most Aluminium Trades Off-Exchange?
LME inventory data provides one of the few publicly available real-time proxies for global visible supply. Even though the substantial majority of physical aluminium changes hands in bilateral transactions outside the LME system, the exchange warehouse stock trend is widely used as a directional indicator of whether the market is moving toward tightness or surplus.
What Is the Practical Difference Between Cash and Three-Month LME Prices?
The cash price governs immediate delivery settlement and is used for spot transactions. The three-month price is the primary hedging and physical pricing benchmark, offering liquidity and standardisation that makes it the dominant reference across the global aluminium industry.
What Does a Falling Cancelled Warrant Count Signal?
Declining cancelled warrants indicate that fewer holders are actively requesting physical metal withdrawal from LME-registered warehouses. In isolation, this can suggest a temporary pause in physical procurement activity, though it must be assessed alongside total inventory trends to determine whether it reflects genuine demand moderation or simply tactical timing by buyers.
Is a 0.57% Daily Price Decline Meaningful in Commodity Markets?
Sub-1% daily moves in LME metals are well within the normal range of price consolidation behaviour, particularly following extended rallies. The move becomes analytically significant only if it is sustained across multiple sessions or accompanied by deteriorating physical indicators such as rising inventory, collapsing cancelled warrants, or weakening regional reference prices.
Key Takeaways: LME Aluminium Market Structure on May 20, 2026
- Price action: The LME aluminium offer price falls of 0.57% to $3,644/t on a cash basis and 0.61% to $3,590/t on a three-month basis represent consolidation within an established uptrend, not a structural reversal
- Forward curve: The December 2027 contract's near-zero movement confirms that medium-term supply-demand assumptions remain intact
- Inventory trajectory: Opening stock declining to 340,575 tonnes continues an 18% drawdown from early April levels, a sustained bullish structural signal
- Warrant dynamics: The 5.23% drop in cancelled warrants to 65,700 tonnes warrants monitoring as a potential indicator of near-term physical procurement timing rather than genuine demand retreat
- Asian premium: The $3,622.50/t Asian Reference Price holding above the global three-month benchmark of $3,590/t confirms ongoing regional demand support
- Alumina cost context: At $309.52/t, alumina represents approximately 8.5% of the cash aluminium price, indicating moderate but manageable smelter input cost pressure at current levels
Disclaimer: This article is intended for informational and educational purposes only and does not constitute financial or investment advice. Commodity prices and market conditions are subject to rapid change. Past inventory and price relationships do not guarantee future market behaviour. Readers should conduct independent research and consult qualified financial advisers before making investment or procurement decisions based on commodity market analysis.
Want to Track the Next Major ASX Mineral Discovery Before the Market Does?
Discovery Alert's proprietary Discovery IQ model scans ASX announcements in real time, delivering instant alerts on significant mineral discoveries across more than 30 commodities — turning complex data into clear, actionable investment opportunities for both short-term traders and long-term investors. Start your 14-day free trial today and see why historic discoveries have generated extraordinary returns for those positioned early.