
July 22, 2026
The Invisible Architecture of Aluminium Pricing: Why Structure Matters More Than Headlines
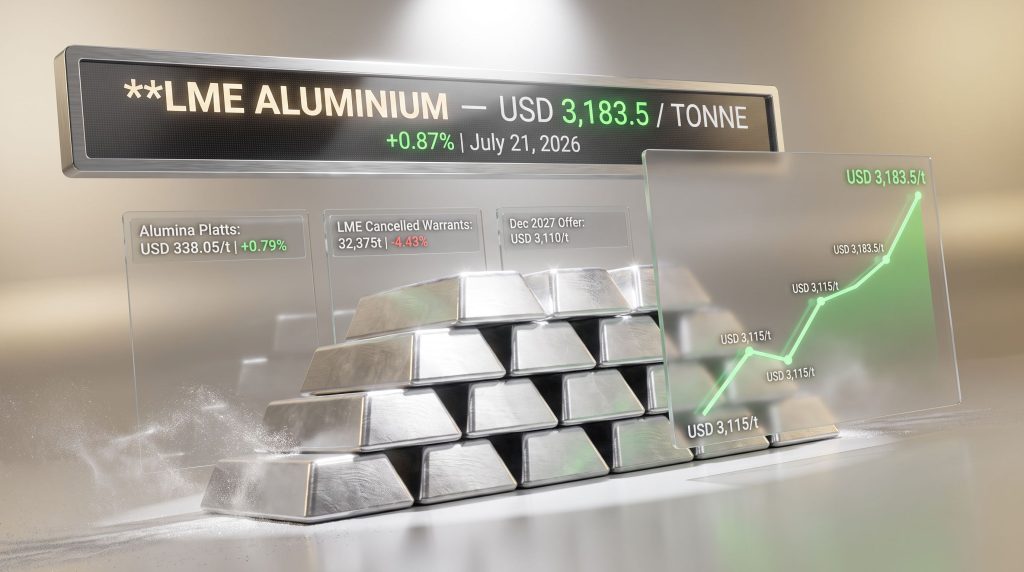
Most commodity price movements get explained through a single dominant narrative: a supply shock here, a demand surge there. However, the most instructive price moves are those that cannot be attributed to one clean catalyst. When the LME aluminium price climbs to USD 3,183.5 per tonne, as it did on July 21, 2026, the more revealing question is not what moved the market, but why multiple forces converged at the same moment to push prices higher across every segment of the forward curve simultaneously.
Understanding that convergence requires moving beyond headlines and into the underlying mechanics of how aluminium is priced, stored, refined, and traded across a deeply interconnected global supply chain. Furthermore, the bauxite supply chain adds another layer of complexity to how these price signals ultimately form.
When big ASX news breaks, our subscribers know first
Why the Full Forward Curve Move on July 21 Carries Unusual Significance
On most trading days, price gains in a commodity are uneven across the curve. Cash prices might rally while longer-dated contracts lag, or a technical bounce at the front end fades before it reaches December 2027 contracts. What made July 21, 2026 analytically distinct was the uniformity of the move.
Breaking Down the Complete LME Aluminium Price Table
| Contract / Reference | July 20 Price (USD/t) | July 21 Price (USD/t) | Change (%) |
|---|---|---|---|
| Cash Bid | 3,155.00 | 3,183.00 | +0.89% |
| Cash Offer | 3,156.00 | 3,183.50 | +0.87% |
| 3-Month Bid | 3,147.00 | 3,170.00 | +0.73% |
| 3-Month Offer | 3,147.50 | 3,170.50 | +0.73% |
| Dec 2027 Bid | 3,082.00 | 3,105.00 | +0.75% |
| Dec 2027 Offer | 3,087.00 | 3,110.00 | +0.75% |
| Asian Reference Price | 3,140.00 | 3,158.00 | +0.57% |
Every single maturity posted gains. The cash offer price reached USD 3,183.5 per tonne, up 0.87% from USD 3,156 per tonne the prior session. The three-month bid and offer both advanced by 0.73%, while even the December 2027 contracts moved higher by 0.75%.
This kind of curve-wide participation is not characteristic of short-term speculative positioning. It reflects a market repricing across time horizons, which typically signals that traders are adjusting their structural view of supply and demand, not just reacting to a single data point. Consequently, LME aluminium price benchmarks serve as a critical reference for interpreting these curve-wide signals.
When every maturity on the forward curve moves in the same direction simultaneously, it is generally a stronger conviction signal than a front-end-only rally. Curve-wide participation suggests the market is revising its fundamental outlook, not merely rebalancing positions.
The Recovery Arc: From USD 3,115/t to USD 3,183.5/t
To contextualise the July 21 price level, it is important to trace the trajectory that preceded it. Aluminium touched approximately USD 3,115 per tonne on July 6, 2026, establishing what now appears to be the low point of the recent trading range. The subsequent recovery, unfolding across multiple sessions through USD 3,140/t, then USD 3,160/t, and finally USD 3,183.5/t, was not a single-day spike but a sustained, multi-session climb.
This type of gradual staircase recovery is technically meaningful. It suggests accumulating buying interest rather than a short-squeeze or stop-loss-driven move, both of which tend to be sharp, fast, and quickly reversed. A sustained push above USD 3,185 per tonne on a closing basis would open the next technical resistance zone higher, and traders with medium-term positioning will be monitoring that level closely.
The Asian Reference Price: A Distinct Regional Signal
The LME Asian Reference Price for aluminium is a daily benchmark derived from LME trading activity during Asian market hours. It serves as the primary pricing reference for physical aluminium contracts across the Asia-Pacific region and is distinct from the European cash price used for Western hemisphere settlements.
On July 21, this price stood at USD 3,158 per tonne, up 0.57% from USD 3,140 per tonne the prior session. The more modest gain compared to the cash offer price reflects slightly different demand dynamics in Asian markets at that point in the session, but the directional alignment with European benchmarks confirms that the recovery was not regionally isolated.
Inventory Mechanics: What the Warehouse Data Actually Reveals
LME warehouse inventory data is one of the most closely watched but frequently misread inputs in aluminium price analysis. The headline stock number matters less than the composition of that figure and the directional change in its components.
LME Aluminium Inventory Movements: July 20 to July 21, 2026
| Inventory Category | July 20 (Tonnes) | July 21 (Tonnes) | Change |
|---|---|---|---|
| Opening Stocks | 280,100 | 279,775 | -325 (-0.12%) |
| Live Warrants | 245,900 | 245,900 | Unchanged |
| Cancelled Warrants | 33,875 | 32,375 | -1,500 (-4.43%) |
Understanding Cancelled Warrants and Why the 4.43% Drop Matters
A warrant in LME terminology is a document that certifies ownership of a specific quantity of metal stored in an LME-approved warehouse. Live warrants represent metal that is currently stored and freely available for trade. Cancelled warrants represent metal that has been formally earmarked for physical removal from the warehouse system.
When cancelled warrants rise sharply, it signals that buyers are pulling metal out of the exchange system for immediate physical use, typically a sign of tightening spot availability. When cancelled warrants fall, as they did by 4.43% on July 21, it suggests that fewer buyers are withdrawing metal, which can indicate reduced near-term physical demand pressure or a temporary pause in industrial drawdown activity.
The important nuance here is that total LME stocks below 280,000 tonnes remain historically constrained. The modest decline in total stocks and the falling cancelled warrants together paint a picture of a market where the absolute level of available metal is low, even if the immediate withdrawal pressure has temporarily eased.
The absolute level of LME aluminium stocks is arguably more consequential than day-to-day warrant movements. When total inventories are already structurally low, even a small incremental drawdown can have an outsized impact on physical market tightness and cash premiums.
The Alumina Price Signal: Upstream Cost Pressure Building
One of the less widely discussed but analytically important data points from July 21 was the simultaneous rise in the LME alumina Platts price, which increased from USD 335.41 per tonne to USD 338.05 per tonne, a gain of 0.79% in a single session. In addition, ongoing alumina market pressures have been building throughout 2025 and into 2026, compounding the upstream cost environment.
Alumina Price Data: July 20 to July 21, 2026
| Metric | July 20 (USD/t) | July 21 (USD/t) | Change (%) |
|---|---|---|---|
| LME Alumina Platts Price | 335.41 | 338.05 | +0.79% |
The Alumina-to-Aluminium Cost Transmission Mechanism
Alumina, the white powder produced by refining bauxite ore, is the direct feedstock for primary aluminium smelting. Producing one tonne of primary aluminium requires approximately 1.9 to 2.0 tonnes of alumina, making feedstock cost the single largest variable in smelter economics after energy.
When alumina prices rise faster than aluminium output prices, smelter margins compress. The fact that alumina gained 0.79% on the same session that aluminium cash prices rose 0.87 to 0.89% means margins did not deteriorate further on July 21, but the sustained upward movement in alumina pricing signals that upstream cost pressure is accumulating.
The broader supply chain context adds further complexity. Global bauxite and alumina production is heavily concentrated in a small number of countries, including Australia, Guinea, Brazil, and China. Any disruption at the mining or refining stage, whether through weather events, infrastructure constraints, or trade policy shifts, can transmit rapidly through alumina prices into primary aluminium smelting economics.
Three Structural Forces Behind the Current Price Environment
The mid-July 2026 aluminium price recovery reflects not one but three converging pressures operating simultaneously across different timeframes.
-
Geopolitical risk repricing — Escalating tensions in the Middle East have introduced a structural risk premium into base metal markets. Aluminium, as a commodity dependent on global shipping routes and energy infrastructure, is particularly sensitive to disruption fears in that region. This premium is real but reversible: if geopolitical tensions ease, a portion of the current price support would likely unwind.
-
Physical inventory tightness — With total LME stocks sitting below 280,000 tonnes, the exchange-visible supply buffer is limited. This is not just an LME phenomenon; off-warrant stocks held in non-LME warehouses and in-transit inventories also appear constrained relative to demand levels in key consuming regions.
-
Upstream cost escalation — Rising alumina prices act as a floor under primary aluminium prices. Smelters facing higher feedstock costs require higher output prices to maintain viability, creating a structural cost-push dynamic that tends to be more persistent than geopolitical or sentiment-driven price moves.
Short-Term Drivers vs. Structural Constraints: A Framework
| Driver Type | Timeframe | Price Impact | Reversibility |
|---|---|---|---|
| Geopolitical risk premium | Short-term (weeks) | Moderate upward | High: dissipates with resolution |
| Inventory depletion | Medium-term (months) | Strong upward | Moderate: requires new supply |
| Alumina cost-push | Medium-term | Moderate upward | Low: structural supply constraints |
| Macro and demand recovery | Long-term | Sustained upward | Low: demand-driven |
The next major ASX story will hit our subscribers first
What the Forward Curve Structure Reveals About Market Expectations
The December 2027 contract trading at USD 3,105 to 3,110 per tonne is approximately USD 73 to 78 below the current cash price. This modest contango structure, where future prices sit below spot, tells an important story about market expectations.
A deeply contangoed aluminium market typically signals surplus conditions or expectations of improving supply over time. The relatively narrow spread between cash and December 2027 levels suggests the market is not pricing in a dramatic supply correction, but rather a gradual normalisation from current tightness.
This is consistent with the base case scenario of price consolidation in the USD 3,150 to 3,200 range, rather than a sharp move to new highs or a collapse back toward the July 6 lows. The narrowing spread between cash and three-month contracts is also worth noting, as it can indicate that the near-term supply and demand balance is tightening relative to the forward period — a subtle but meaningful signal for physical traders and hedgers.
Scenario Analysis: Three Paths for Aluminium Prices From Here
| Scenario | Trigger Conditions | Price Outlook (3-Month) |
|---|---|---|
| Bullish continuation | Geopolitical escalation combined with accelerating inventory drawdown | USD 3,250 to 3,350/t |
| Base case consolidation | Risk premium stabilises, physical stocks remain tight but stable | USD 3,150 to 3,200/t |
| Bearish reversal | Geopolitical resolution combined with demand softening | USD 3,050 to 3,100/t |
Key Indicators to Watch for Aluminium Price Direction
Market participants seeking to assess the next directional move in aluminium should monitor the following:
- Weekly LME inventory reports, particularly cancelled warrant trends, which provide the most timely signal of physical demand acceleration or deceleration
- Alumina Platts price trajectory: a sustained move above USD 340 per tonne would signal intensifying upstream cost pressure and a likely floor for primary aluminium pricing
- Geopolitical developments in the Middle East, which remain the most volatile near-term variable and the most likely source of a sudden directional shift in either direction
- Chinese aluminium production data: as the world's largest producer, accounting for more than 55% of global primary output, any output disruption or domestic policy shift carries outsized global price implications
- USD index movements: as a USD-denominated commodity, aluminium prices maintain an inverse relationship with the dollar's strength; a weakening dollar tends to support commodity prices in non-USD currencies, stimulating demand
Furthermore, the global steel demand outlook provides a useful parallel, as steel and aluminium often respond to the same macro demand signals across key industrial sectors. In addition, aluminium tariff impacts remain a critical variable shaping trade flows and regional pricing differentials, particularly for the top aluminium producers navigating an increasingly complex policy environment.
Frequently Asked Questions: LME Aluminium Pricing Mechanics
What is the difference between the LME cash price and the three-month price?
The cash price on the LME reflects settlement for immediate delivery, typically two business days forward. The three-month contract is the exchange's most liquid forward benchmark and serves as the primary reference for physical aluminium contracts globally. The spread between them, known as the cash-to-three-month spread, indicates market structure: a positive spread (cash above three-month) signals backwardation and near-term tightness, while a negative spread signals contango and more comfortable near-term supply.
What does the LME Asian Reference Price represent?
This is a daily aluminium price benchmark derived from LME trading activity during Asian market hours, primarily used for settling physical aluminium contracts in the Asia-Pacific region. It is distinct from the European cash price and reflects regional supply and demand dynamics. On July 21, 2026, it stood at USD 3,158 per tonne, a 0.57% gain from the prior session. For instance, recent aluminium cash price movements illustrate how quickly these regional benchmarks can shift in response to stock drawdowns.
What are cancelled warrants and why do they affect aluminium prices?
Cancelled warrants represent LME-registered aluminium that has been formally earmarked for physical removal from exchange-approved warehouses. Rising cancellations signal that industrial buyers are drawing down exchange inventories for actual use, which tightens visible supply and typically supports cash prices. Falling cancellations, as seen on July 21 when they declined 4.43%, indicate a temporary pause in physical withdrawals.
How does the alumina price affect primary aluminium production costs?
Alumina is the direct precursor to aluminium metal. Approximately 1.9 to 2.0 tonnes of alumina are required per tonne of aluminium produced. When alumina prices rise, smelter input costs increase proportionally. Unless aluminium output prices rise fast enough to compensate, smelter profitability is eroded, which can eventually incentivise curtailments and further tighten primary metal supply.
Summary: What the USD 3,183.5/t Level Represents
The July 21, 2026 aluminium price move is best understood not as a reaction to a single event, but as the market's recalibration across multiple dimensions of supply risk. Several key takeaways emerge:
- The LME aluminium price climbs to USD 3,183.5 per tonne and represents the high point of a sustained multi-session recovery from the July 6 low of approximately USD 3,115 per tonne
- Uniform gains across cash, three-month, and December 2027 contracts confirm broad-based market conviction behind the move rather than isolated speculative activity
- Simultaneous gains in the alumina Platts price signal that upstream cost pressures are building alongside the primary metal price, reducing the likelihood of a sharp near-term reversal
- Total LME stocks below 280,000 tonnes remain historically constrained, providing a structural underpinning to the current price level
- The USD 3,185 per tonne level represents the next key technical reference point; a sustained close above this threshold would reinforce the bullish continuation scenario
Disclaimer: This article is intended for informational and analytical purposes only and does not constitute financial or investment advice. Commodity price forecasts and scenario analyses involve inherent uncertainty. Past price movements are not indicative of future performance. Readers should conduct independent research before making any investment or trading decisions.
Want to Capitalise on the Next Major ASX Mineral Discovery Before the Broader Market?
Discovery Alert's proprietary Discovery IQ model delivers real-time alerts on significant ASX mineral discoveries — instantly transforming complex mineral data into actionable investment insights for both short-term traders and long-term investors. Explore historic examples of exceptional discovery returns and start your 14-day free trial today to position yourself ahead of the market.