
July 21, 2026
The Mechanics Behind LME Aluminium's Inventory-Driven Price Cycles
Commodity markets rarely move in straight lines, and aluminium is no exception. Across the long arc of base metal trading history, one pattern has proven remarkably consistent: when physically deliverable inventory shrinks, price floors tend to firm. This is not a recent discovery. It is a structural feature of how exchange-traded commodity markets function, and it has reasserted itself with notable clarity during the July 2026 trading sessions on the London Metal Exchange.
Understanding why this happens, and what the current data signals for traders, producers, and downstream consumers, requires looking beyond individual session figures and examining the layered mechanics of how LME aluminium pricing, warehouse inventory architecture, and upstream feedstock costs all interact.
When big ASX news breaks, our subscribers know first
What Is Driving the LME Aluminium Price Recovery in July 2026?
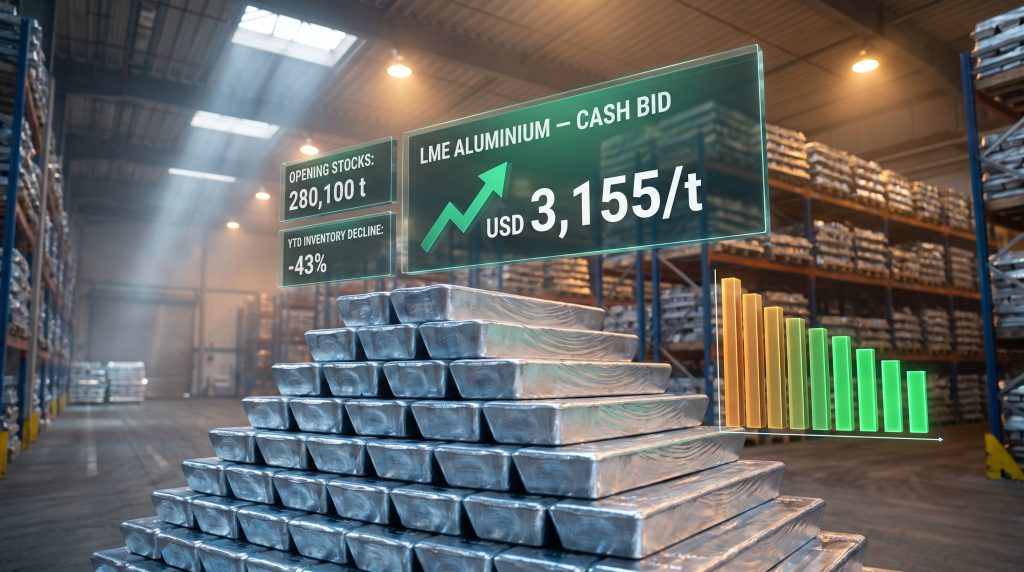
The LME aluminium price recovers as stocks slip has become a recurring headline pattern across July 2026, and the July 20 session provided a textbook example of this dynamic in action. After retreating to a four-month low of approximately USD 3,085/t earlier in the month, cash prices clawed back ground, with the cash bid reaching USD 3,155/t and the cash offer firming to USD 3,156/t on July 20, representing a 0.06% session-on-session gain.
At the same time, LME trading volumes and opening stocks slipped to 280,100 tonnes, down from 281,600 tonnes in the prior session, a decline of 0.53%. Viewed in isolation, that movement is modest. However, contextualised against the broader trend, where LME-registered aluminium inventories have contracted by approximately 43% year-to-date to around 285,000 tonnes, the directional signal becomes considerably more meaningful.
How LME Aluminium Spot Pricing Moved Across the July 19 to 20 Session
| Price Segment | July 19 Level (USD/t) | July 20 Level (USD/t) | Change |
|---|---|---|---|
| Cash Bid | 3,152 | 3,155 | +0.10% |
| Cash Offer | 3,154 | 3,156 | +0.06% |
| 3-Month Bid | 3,146 | 3,147 | +0.03% |
| 3-Month Offer | 3,146.5 | 3,147.5 | +0.03% |
| Dec-27 Bid | 3,077 | 3,082 | +0.16% |
| Dec-27 Offer | 3,082 | 3,087 | +0.16% |
| Asian Reference Price | 3,150.5 | 3,140 | -0.33% |
Notably, the strongest percentage gains on July 20 appeared in the longer-dated December 2027 contracts, with both bid and offer posting 0.16% improvements. This detail is worth examining carefully, as it suggests market participants were beginning to price in some degree of sustained tightness rather than treating the inventory drawdown as a transient blip.
How Do LME Warehouse Stocks Influence Aluminium Market Sentiment?
The LME's warehouse inventory system is more architecturally complex than a simple headline stock number implies. Three distinct layers of inventory data are published, and each carries a different informational signal for market participants.
Deconstructing the Three-Tier Inventory Architecture
1. Opening Stocks (Total Registered Inventory)
- Represents the aggregate volume of aluminium held across all LME-approved warehouse facilities globally
- July 20 reading: 280,100 tonnes, down from 281,600 tonnes
- Sustained declines in this figure erode the physical buffer between available supply and contracted demand
2. Live Warrants (Immediately Deliverable Metal)
- Metal that can be delivered immediately against LME contracts without any cancellation process
- Held steady at 245,900 tonnes on July 20, unchanged from the prior session
- Stability here indicates that while overall stocks are shrinking, the pool of immediately tradeable metal has not yet entered acute stress territory
3. Cancelled Warrants (Metal Flagged for Withdrawal)
- Inventory that has been earmarked for physical removal from LME-registered warehouses
- Declined to 33,875 tonnes on July 20, a 0.95% drop from 34,200 tonnes
- A falling cancelled warrant figure can indicate some moderation in immediate off-take intentions among physical buyers
What makes the July 20 data particularly instructive is the combination: opening stocks and cancelled warrants both declining while live warrants hold flat. This pattern is consistent with gradual, persistent supply absorption at the margins rather than a sudden demand surge. It is precisely the kind of slow bleed in inventory that has historically preceded more pronounced price moves.
One aspect of cancelled warrants that is not widely understood by non-specialist observers is that they function as a leading indicator of physical demand rather than a coincident one. When a cancelled warrant is raised, metal has already been committed to withdrawal. The actual departure of that metal from the warehouse system occurs later, meaning that today's cancelled warrant decline may foreshadow tomorrow's live warrant reduction rather than simply reflecting current conditions. For further context on recent price behaviour, this analysis of LME aluminium stocks offers a useful comparative perspective from late June 2026.
What Do Forward Curve Signals Reveal About the Price Outlook?
Reading Backwardation in the July 2026 LME Aluminium Market
Perhaps the most technically significant feature of the July 20 price data is the structure of the forward curve. With the cash offer sitting at USD 3,156/t and the three-month offer at USD 3,147.5/t, the market was trading in a mild backwardation. This is a condition where near-term prices exceed forward prices, which in physical commodity markets typically signals that near-term supply is tighter relative to demand than the medium-term outlook.
Backwardation in base metals is meaningful for several reasons:
- It discourages financing trades, where metal is bought spot and sold forward simultaneously, since the forward price no longer compensates for storage costs and financing charges
- It incentivises physical holders to release metal into the market, which can paradoxically stabilise or suppress spot prices if enough material comes forward
- It signals to downstream buyers that waiting to purchase may not yield lower prices, encouraging more immediate procurement decisions
Hypothetical Scenario: What Happens If Stocks Fall Below 250,000 Tonnes?
| Inventory Threshold | Likely Market Response | Historical Precedent |
|---|---|---|
| 300,000–350,000 t | Moderate upward price pressure | Observed in Q1 2026 |
| 250,000–300,000 t | Elevated cash premium, tighter spreads | Current zone (July 2026) |
| Below 250,000 t | Potential backwardation acceleration, spot price spike | Rare; typically associated with supply disruption events |
The December 2027 contract closing at USD 3,082/t on July 20 trades meaningfully below spot levels, suggesting the broader market anticipates some degree of supply normalisation over an 18-month horizon. However, this forward discount should not be misread as a bearish consensus. It may simply reflect the market's expectation that the current inventory drawdown pace is unlikely to be maintained indefinitely at this velocity.
How Does Alumina Pricing Feed Into the LME Aluminium Market?
The Upstream Cost Chain and Its Downstream Implications
Alumina, the intermediate oxide compound refined from bauxite ore before being smelted into primary aluminium, closed at USD 335.41/t on July 20 according to LME Platts pricing data. Furthermore, the alumina market pressures observed in prior quarters continue to shape smelter economics in ways that feed directly into LME inventory dynamics.
The full cost transmission chain runs as follows:
- Bauxite extraction costs feed into alumina refinery operating economics
- Alumina refinery output pricing determines the primary input cost for aluminium smelters
- Smelter operating margins, calculated as the spread between alumina input costs and aluminium output prices, govern production volume decisions
- Primary aluminium production volumes flowing into the market influence LME warehouse registration rates
- LME warehouse registration levels directly shape the inventory figures that underpin spot price behaviour
A less commonly discussed dynamic within this chain is that alumina pricing volatility can create asymmetric responses at the smelter level. When alumina costs rise sharply but aluminium output prices do not keep pace, marginal smelters with higher energy or logistics costs face disproportionate margin compression. These are the facilities most likely to implement curtailments, meaning that alumina price spikes can reduce future aluminium supply with a lag of several months, feeding back into tighter LME inventory conditions down the track.
What Structural Forces Are Behind the 43% Year-to-Date Inventory Decline?
Supply and Demand Dynamics Reshaping Exchange-Registered Stocks
A 43% contraction in LME-registered aluminium stocks over the course of a single calendar year is a significant structural development, not a routine fluctuation. Several reinforcing forces have contributed to this drawdown. In addition, Chinese industrial demand patterns and shifting trade flows have played a notable role in reshaping where and how metal is absorbed globally.
Supply-Side Pressures:
- Ongoing smelter curtailments in energy-constrained production regions, particularly where power tariff structures have made aluminium smelting economically marginal
- Increasing producer preference for off-warrant, bilateral supply arrangements rather than registering metal into LME-approved warehouses
- Logistical friction and elevated storage costs in certain LME warehouse locations reducing the attractiveness of exchange-registered storage
Demand-Side Absorption:
- Sustained consumption from automotive, packaging, and construction end markets
- Accelerating off-take from energy transition sectors, including electric vehicle battery enclosures, structural components, and solar panel mounting systems
- Downstream restocking cycles as industrial manufacturers replenish inventory depleted during earlier demand softness
Trading and Financial Flows:
- Physical industrial consumers increasingly procuring metal directly rather than relying on LME-registered stock as a buffer
- Reduced speculative long positioning in LME aluminium futures limiting the artificial inflation of registered inventory that can sometimes accompany financial carry trades
A 43% year-to-date inventory decline at the LME is among the more pronounced structural tightening episodes in recent aluminium market history. Episodes of comparable magnitude have, in historical cases, preceded sustained price rallies once the rate of inventory decline outpaced the market's capacity to rebalance through increased production or import flows.
One factor that receives insufficient attention in mainstream market commentary is the role of warrant geography. Not all LME-registered warehouses carry the same physical accessibility or freight cost profile. As inventories decline, the remaining registered metal becomes increasingly concentrated in specific locations, which can create localised tightness and elevated regional premiums even when the global headline stock figure appears adequate on paper.
The next major ASX story will hit our subscribers first
LME Aluminium Price Recovery: Key Metrics at a Glance
Summary Statistics: July 20, 2026 Session
| Metric | Value | Session Change |
|---|---|---|
| Cash Bid | USD 3,155/t | +0.10% |
| Cash Offer | USD 3,156/t | +0.06% |
| 3-Month Bid | USD 3,147/t | +0.03% |
| 3-Month Offer | USD 3,147.5/t | +0.03% |
| Dec-27 Bid | USD 3,082/t | +0.16% |
| Dec-27 Offer | USD 3,087/t | +0.16% |
| Asian Reference Price | USD 3,140/t | -0.33% |
| Opening Stocks | 280,100 t | -0.53% |
| Live Warrants | 245,900 t | Unchanged |
| Cancelled Warrants | 33,875 t | -0.95% |
| Alumina Platts Close | USD 335.41/t | N/A |
Why Did the Asian Reference Price Diverge From the Broader Recovery?
One of the more nuanced signals embedded in the July 20 data was the 0.33% decline in the LME aluminium three-month Asian Reference Price to USD 3,140/t, moving in the opposite direction to cash and three-month benchmark prices that posted modest gains.
This divergence reflects the reality that Asian aluminium markets operate within their own regional supply-demand dynamics. Several factors can cause the Asian Reference Price to diverge from the primary LME benchmark:
- Regional surplus conditions driven by elevated Chinese primary aluminium output, which has repeatedly acted as a pressure valve on Asian spot markets
- Currency movements affecting the landed cost of LME-priced material in local markets
- Differential freight and logistics costs between LME warehouse locations and Asian consumption centres
- Seasonal demand patterns in key Asian end-use sectors that may not align with Northern Hemisphere consumption cycles
The fact that Asian reference pricing weakened while broader LME cash prices recovered suggests that the tightness reflected in declining LME warehouse stocks may be more concentrated in Western exchange-registered supply chains than in the Asia-Pacific physical market at this point. Consequently, the aluminium tariff impacts introduced earlier in 2025 have further complicated regional pricing dynamics by redirecting trade flows in ways that exacerbate these East-West divergences.
What Should Market Participants Monitor in Coming Sessions?
Forward-Looking Indicators and Risk Factors
Bullish signals to watch:
- Continued decline in LME opening stocks approaching the 270,000-tonne threshold
- Renewed acceleration in cancelled warrant volumes indicating fresh physical off-take intentions
- Deepening cash premium over three-month prices, signalling more entrenched backwardation
- Alumina Platts pricing trending higher, which would compress smelter margins and potentially trigger production curtailments
Bearish risk factors:
- Stabilisation or reversal in the inventory decline trajectory, suggesting demand absorption has reached a near-term ceiling
- Sustained weakness in Asian Reference Pricing spreading into the broader LME benchmark complex
- Easing of energy cost pressures in major smelting regions restoring curtailed production capacity
- Strengthening of the US dollar, which historically correlates inversely with USD-denominated commodity prices
Key data releases to track:
- Weekly LME warehouse stock reports across all registered locations
- Chinese National Bureau of Statistics primary aluminium production data
- Global manufacturing PMI readings as a proxy for downstream demand trajectory
- Alumina spot market pricing trends from major refining regions including Australia, Guinea, and Jamaica
Furthermore, monitoring how aluminium industry leaders respond to the current tightening environment — whether through capacity restoration, new warrant registrations, or accelerated bilateral supply agreements — will be critical for anticipating the next directional move in the LME aluminium price recovers as stocks slip narrative that has defined mid-2026 trading. The July 2026 stock movements observed across multiple sessions confirm that this inventory-price relationship remains one of the most reliable structural signals available to base metal market participants.
Disclaimer: This article is intended for informational purposes only and does not constitute financial or investment advice. Aluminium price forecasts and market scenario projections involve inherent uncertainty and should not be relied upon as the basis for trading or investment decisions. Past inventory-price relationships do not guarantee future market behaviour. Readers should conduct independent research and consult qualified financial advisers before making any investment decisions.
Want to Stay Ahead of the Next Major Commodity Discovery?
While LME aluminium inventory cycles and forward curve signals reward those who act on structural shifts early, Discovery Alert's proprietary Discovery IQ model delivers real-time alerts on significant ASX mineral discoveries — instantly translating complex commodity data into actionable opportunities for traders and investors at every experience level. Explore historic discoveries and their market returns to understand the scale of what early positioning can achieve, and begin your 14-day free trial today to ensure you're never the last to know.