June 4, 2026
When Prompt Prices Lead and Deferred Contracts Follow: Understanding Forward Curve Dynamics in Aluminium
The structure of a commodity's forward curve reveals more about underlying market health than any single trading session can convey. In aluminium markets, LME aluminium prices eased after spike activity, and the relationship between cash prices, three-month contracts, and deferred maturities functions as a real-time diagnostic tool, reflecting how traders collectively assess near-term physical availability against longer-term supply and demand fundamentals. When these different points on the curve move at different speeds, the divergence is rarely accidental.
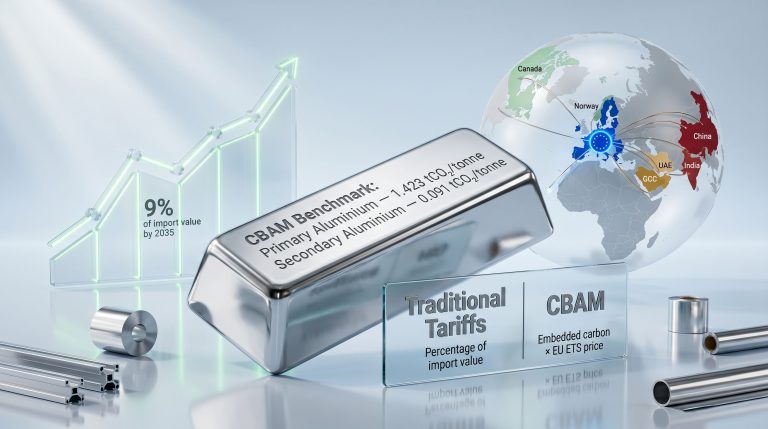
That is precisely the lens through which the price easing of June 3, 2026 deserves to be examined. Rather than treating it as a straightforward price retreat, unpacking the mechanics behind the move offers a far richer picture of where the aluminium market actually stands. Understanding aluminium tariffs impact adds further context to these price movements.
When big ASX news breaks, our subscribers know first
Why the June 2 Spike Set Up the June 3 Correction
Sharp single-session rallies in base metals rarely sustain themselves without a steady flow of new catalysts. The aluminium market's June 2 surge was driven by a convergence of supply-side anxieties, including risks tied to Gulf-region production corridors, tightening logistics networks, and residual geopolitical risk premiums that have become structurally embedded in commodity pricing since 2022.
Once those fears were partially priced in and no fresh disruption catalysts emerged during Asian and European trading on June 3, the market entered a natural correction phase. This is consistent with a well-documented pattern in liquid commodity markets: momentum-driven spikes attract short-term speculative positioning, and when that positioning unwinds, it creates orderly selling pressure rather than panic-driven liquidation.
A single-session decline of approximately 1.5% following a momentum spike, on an absolute price level above USD 3,700 per tonne, is textbook profit-taking behaviour and does not constitute evidence of a fundamental trend reversal.
Critically, even after the June 3 pullback, LME aluminium cash prices remained well above the USD 3,600 per tonne range observed in prior sessions. This repricing to a structurally higher range is not a transient phenomenon; it reflects the market's revised assessment of where equilibrium sits given current inventory conditions and supply risks.
Dissecting the Price Data Across Contract Tenors
The most analytically useful aspect of the June 2 to June 3 price movement is not the absolute level of the decline, but the differential in how the correction propagated across the forward curve.
| Contract Type | June 2 Price (USD/t) | June 3 Price (USD/t) | Change (%) |
|---|---|---|---|
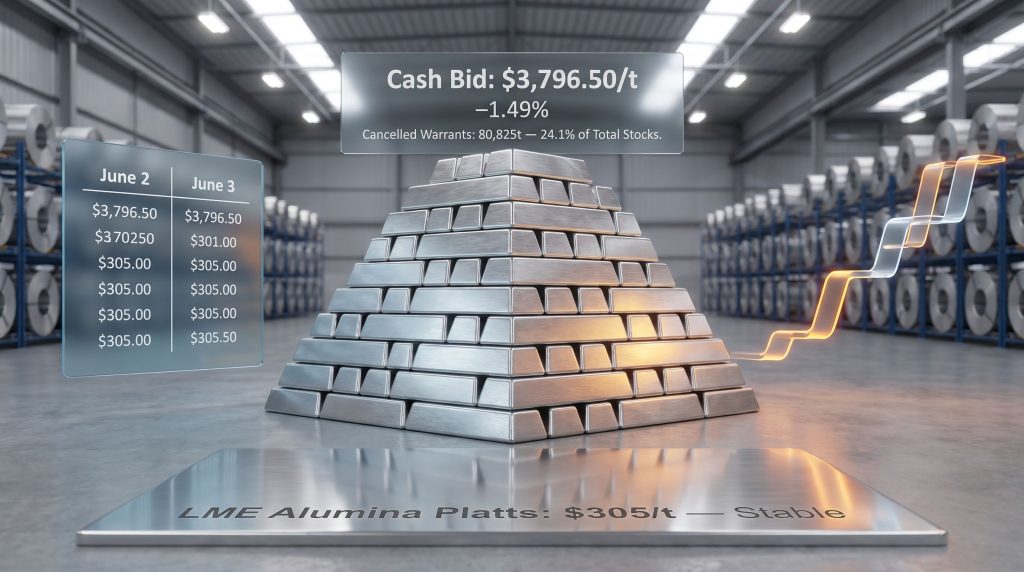
| Cash Bid | 3,854.00 | 3,796.50 | -1.49% |
| Cash Offer | 3,855.00 | 3,797.00 | -1.51% |
| 3-Month Bid | 3,752.00 | 3,721.00 | -0.83% |
| 3-Month Offer | 3,752.50 | 3,723.00 | -0.79% |
| Dec 2027 Bid | 3,305.00 | 3,292.00 | -0.39% |
| Dec 2027 Offer | 3,310.00 | 3,297.00 | -0.39% |
| Asian Reference (3M) | 3,752.50 | 3,703.50 | -1.20% |
The gradient here tells a clear story. Cash prices fell the hardest at roughly 1.5%, three-month contracts declined by less than half that rate at around 0.8%, and December 2027 contracts barely moved at just 0.39%. This is the forward curve structure of a market that is partially resolving near-term anxiety without abandoning its medium-term concern about supply availability.
What Bid-Offer Symmetry Reveals
The near-identical percentage declines across both the bid and offer sides of the cash market, at 1.49% and 1.51% respectively, indicate something often overlooked in commodity price reporting: orderly two-way participation. When bid and offer prices decline in symmetrical proportion, it signals that market makers maintained tight spreads throughout the correction, reflecting healthy liquidity conditions rather than a one-sided flush.
This matters for interpreting the market's signal. Disorderly corrections, where spreads widen dramatically and bid prices lag offer prices, suggest forced selling or liquidity stress. The June 3 data shows neither of those characteristics.
The Forward Curve as a Physical Tightness Indicator
A concept that receives insufficient attention in mainstream commodity analysis is the informational content of term structure steepness. When the front end of a commodity curve declines more steeply than the back end during a correction, it typically means one of two things:
- Near-term supply anxiety is being partially resolved, easing the prompt premium.
- The market still expects medium-to-long term demand to absorb available supply, keeping deferred prices anchored.
Both interpretations are simultaneously plausible in the June 3 context, and both are broadly bullish for the medium-term price outlook. Furthermore, commodity hedging strategies become especially relevant when such structural signals emerge.
The Cash-to-3-Month Spread: Reading the Backwardation Signal
With the cash bid at USD 3,796.50 per tonne and the three-month bid at USD 3,721.00 per tonne on June 3, the prompt market was trading at a premium of approximately USD 75.50 per tonne over the three-month contract. In LME terminology, this premium of the nearby price over the forward price is known as backwardation, and its persistence following a price correction is an important structural signal.
Backwardation in metals markets typically emerges when physical buyers are competing aggressively for immediate delivery, indicating that nearby warehouse inventory is insufficient to satisfy prompt demand at forward-equivalent prices. The fact that this structure remained intact after the June 3 easing confirms that the physical tightness narrative driving the June 2 rally has not been resolved.
When the prompt end of the curve maintains a premium over deferred contracts even after a correction, the market is communicating that near-term supply constraints remain active, not historical.
LME Inventory Data: The Physical Foundation of the Price Story
Price movements on the LME are ultimately anchored to physical inventory conditions registered across the exchange's global warehouse network. The June 2 to June 3 inventory data reinforces the structural tightness narrative at the physical level.
| Inventory Metric | June 2 | June 3 | Change |
|---|---|---|---|
| Opening Stocks (tonnes) | 337,700 | 335,450 | -2,250 (-0.67%) |
| Live Warrants (tonnes) | 254,625 | 254,625 | Unchanged |
| Cancelled Warrants (tonnes) | 80,825 | 80,825 | Unchanged |
Understanding Cancelled Warrants and Why They Matter More Than Total Stocks
The concept of cancelled warrants is one of the most misunderstood metrics in base metals analysis, yet it is arguably more important than the headline stock figure. A cancelled warrant represents a tonne of metal held in an LME-registered warehouse that has been formally earmarked for physical removal. Once a warrant is cancelled, that metal is no longer available to the market as deliverable inventory, even though it still appears in the total stock count temporarily.
With cancelled warrants holding steady at 80,825 tonnes against total opening stocks of 335,450 tonnes on June 3, approximately 24.1% of all registered LME aluminium inventory was already committed for physical withdrawal. This is a structurally bullish condition for prompt pricing.
The stability of cancelled warrants at this elevated level, with no new additions but also no reversals, tells a nuanced story:
- Existing cancellation orders remain committed, indicating physical buyers are still executing on delivery intentions.
- No new cancellations suggests the immediate urgency driving the June 2 spike may have slightly moderated.
- No re-warranting activity confirms that no fresh metal has entered the LME system to relieve the drawdown pressure.
The continued reduction in opening stocks, even by a modest 2,250 tonnes, extends the drawdown trend that has been a persistent feature of the aluminium market through much of 2025 and into 2026.
The Asian Reference Price: Regional Pricing Mechanics
The LME aluminium 3-Month Asian Reference Price settled at USD 3,703.50 per tonne on June 3, representing a decline of 1.2% from USD 3,752.50 per tonne the previous session. For readers unfamiliar with this benchmark's role in global aluminium trade, it is worth explaining why this figure carries distinct commercial weight.
The Asian Reference Price is calculated using LME prices captured during Asian trading hours, specifically designed to align with the operating hours of physical market participants across China, Japan, South Korea, and Southeast Asia. A significant portion of long-term physical supply contracts across the Asia-Pacific region are priced off this benchmark rather than the standard LME settlement.
The USD 17.50 per tonne gap between the Asian Reference Price and the standard LME three-month price on June 3 reflects time-zone liquidity differentials, a structural feature of the LME's pricing architecture rather than a fundamental divergence in market views. Asian sessions typically see lower participation from European and North American trading desks, which can result in marginally softer reference levels.
For automotive, packaging, and construction sector buyers across Asia, the key watchpoint is whether the Asian Reference Price stabilises in the USD 3,700 to 3,750 per tonne range or continues to drift toward the USD 3,650 to 3,680 per tonne zone that characterised the pre-spike trading environment.
The next major ASX story will hit our subscribers first
Alumina Pricing and Its Implications for Smelter Economics
Why USD 305 Per Tonne for Alumina Is the Right Number to Watch
One of the most underappreciated dynamics in primary aluminium analysis is the relationship between alumina input costs and smelter production margins. Alumina, the refined intermediate product derived from bauxite, typically represents between 30% and 35% of the total cash cost of producing a tonne of primary aluminium in a modern smelter operation. In addition, understanding bauxite supply fundamentals is essential for contextualising these cost pressures.
The LME alumina Platts price held completely flat at USD 305 per tonne across both the June 2 and June 3 sessions. In the context of a roughly 1.5% decline in finished aluminium prices, this stability in alumina costs carries meaningful implications:
- When aluminium prices ease while alumina costs hold steady, the proportional margin compression falls on smelters in high-cost operating regions first.
- If aluminium prices stabilise above USD 3,700 per tonne with alumina anchored at USD 305 per tonne, the implied smelting spread remains commercially attractive for most operating regions outside of Europe, where energy cost premiums create additional pressure.
- A sustained divergence where aluminium prices continue declining while alumina costs rise would trigger production curtailment decisions, particularly among marginal smelters operating on thinner spread economics.
The flat alumina price also suggests that the raw material supply chain underpinning aluminium production has not been disrupted to the same degree as finished metal logistics, providing a degree of cost floor stability for the industry. The Alcoa alumina strategy offers one example of how major producers are navigating these dynamics.
Three Scenarios for LME Aluminium Prices From Here
Given the market structure visible in the June 3 data, three distinct price trajectories are worth considering for the weeks ahead. Consequently, leading aluminium producers will be monitoring these scenarios closely.
Scenario 1: Consolidation and Recovery (Base Case)
LME aluminium prices eased after spike activity, and the market is now expected to establish a trading range between USD 3,700 and USD 3,800 per tonne. Inventory drawdowns continue at a moderate pace, sustaining the backwardation premium in the prompt market. Absent new supply disruption catalysts, prices gradually recover toward the June 2 spike high as physical tightness persists.
Scenario 2: Extended Correction (Bear Case)
Geopolitical risk premiums fade as supply disruption fears ease. New metal begins entering LME warehouses, reducing the cancelled warrant ratio and easing prompt tightness. Prices retrace toward USD 3,600 to 3,650 per tonne, partially unwinding the recent rally.
Scenario 3: Renewed Escalation (Bull Case)
Fresh supply disruption events emerge across Gulf-region production or logistics networks. Cancelled warrants accelerate, tightening prompt availability further. Prices retest the June 2 spike high and potentially extend toward the aluminium price outlook of USD 3,900 per tonne zone.
The current market configuration, featuring elevated cash prices, persistent inventory drawdowns, stable alumina costs, and an intact backwardation structure, creates an asymmetric risk profile that objectively favours the consolidation and recovery scenario over a sustained bearish trend.
This article presents market analysis and data-driven commentary for informational purposes only. Nothing contained herein constitutes financial or investment advice. Commodity prices are inherently volatile and subject to rapid change based on factors that cannot be predicted with certainty. Readers should consult qualified financial professionals before making any investment decisions.
Frequently Asked Questions
What does it mean when LME aluminium prices ease after a spike?
A price easing following a sharp rally typically reflects profit-taking by short-term traders and a partial normalisation of the risk premiums that drove the initial surge. It does not automatically signal a trend reversal, particularly when the underlying physical supply conditions that triggered the spike remain unresolved.
What is the difference between live warrants and cancelled warrants on the LME?
Live warrants represent metal held in LME-registered warehouses that is available for delivery against exchange contracts. Cancelled warrants are those that have been formally requested for physical removal and are therefore no longer freely available to the market. A high proportion of cancelled warrants relative to total stocks indicates tightening physical availability.
Why does alumina price stability matter for aluminium market analysis?
Because alumina represents roughly 30% to 35% of primary aluminium production costs, its price trajectory directly influences smelter margins. When alumina prices are stable and aluminium prices are elevated, smelters benefit from wider spreads. When aluminium prices fall and alumina costs rise simultaneously, marginal producers face curtailment pressure.
How is the LME Asian Reference Price calculated?
The LME Asian Reference Price is derived from LME pricing data captured during Asian trading hours. It serves as the benchmark for physical aluminium supply contracts across the Asia-Pacific region, including major consuming markets such as China, Japan, and South Korea. It typically trades at a slight discount to the standard LME price due to lower liquidity during Asian sessions. For further context, ING's commodities outlook provides additional perspective on the macroeconomic headwinds shaping these benchmarks.
Want to Capitalise on Major Mineral Discoveries Before the Broader Market Does?
Discovery Alert's proprietary Discovery IQ model delivers real-time alerts on significant ASX mineral discoveries, turning complex commodity data into actionable investment insights for both short-term traders and long-term investors. Explore historic examples of exceptional discovery returns and begin your 14-day free trial today to secure a market-leading advantage.