
July 30, 2026
The Mechanics Behind LME Aluminium Pricing: Why Warehouse Stocks Are the Market's Pulse
Understanding how a commodity exchange prices physical metal requires looking beyond the headline number. The LME aluminium cash offer price and warehouse stocks operate through a layered system of contract horizons, warrant structures, and inventory signals that collectively determine where prices move and why. Before examining the specific conditions that emerged in late July 2026, it helps to understand the machinery itself, because the numbers only become meaningful once the underlying mechanics are clear.
When big ASX news breaks, our subscribers know first
What the LME Aluminium Cash Offer Price Actually Measures
Every trading session on the LME produces a series of reference prices across multiple contract tenors. The cash offer price specifically reflects the level at which sellers are prepared to transact for immediate delivery settlement. It sits marginally above the cash bid, with the spread between the two acting as a real-time indicator of market liquidity.
Tighter spreads suggest deep, liquid trading conditions, while wider spreads can signal hesitation or reduced participation from market makers.
The cash price is the benchmark that physical delivery contracts reference most directly. Smelters, traders, and downstream buyers use it as the foundation for calculating landed metal costs, and it is this price that reacts most sharply to inventory movements within LME-registered warehouses.
The Three Contract Horizons Traders Monitor
The LME aluminium market trades across three primary time horizons that serve distinct commercial purposes:
- Cash (spot) settlement: Pricing for immediate delivery, most sensitive to near-term physical supply and demand conditions.
- Three-month contract: The exchange's primary forward benchmark, widely used for hedging and as a reference for producer and consumer contracts.
- Long-dated forwards (e.g., December 2027): Instruments used by industrial consumers to lock in future input costs over multi-year planning horizons.
The relationship between these tenors forms the forward curve. When the cash price exceeds the forward price, the market is in backwardation, signalling near-term physical tightness. When forward prices sit above spot, the market is in contango, typically reflecting ample near-term supply and encouraging inventory accumulation through warehouse financing trades.
The forward curve is not simply a pricing tool. It is a behavioural signal. Backwardation actively discourages speculative stock accumulation and accelerates physical drawdowns from exchange warehouses, compressing the inventory buffer that moderates spot price volatility.
Current Price Snapshot: July 29, 2026
The session on July 29, 2026 produced broad-based gains across all contract tenors, with the cash offer price delivering the strongest single-session move.
| Contract | Bid (USD/tonne) | Offer (USD/tonne) | Daily Change |
|---|---|---|---|
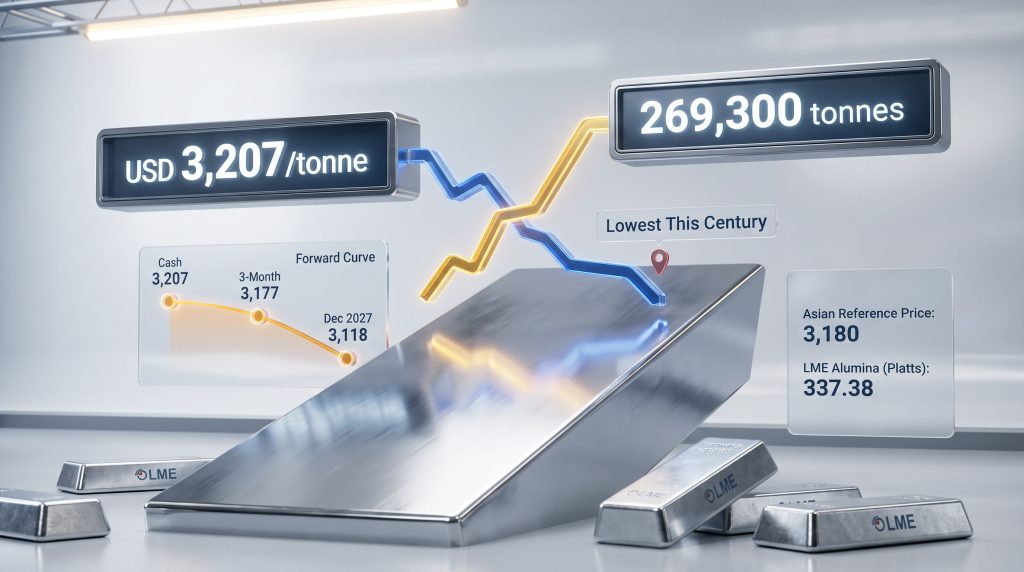
| Cash | 3,205 | 3,207 | +1.46% / +1.50% |
| Three-Month | 3,176 | 3,177 | +1.05% / +1.07% |
| December 2027 | 3,113 | 3,118 | +1.07% / +1.07% |
| Asian Reference Price | N/A | 3,180 | N/A |
| LME Alumina (Platts) | N/A | 337.38 | N/A |
The gains were consistent but graduated, with the spot contract outpacing the forward curve, a characteristic pattern during periods of physical tightness. When immediate delivery commands a larger premium than deferred delivery, it reflects genuine urgency in near-term procurement rather than speculative positioning.
How July 29 Fits the Broader July 2026 Trajectory
The July 29 session did not emerge in isolation. Furthermore, it was the culmination of a multi-week trend in which declining warehouse stocks and rising cash prices reinforced each other:
- July 6, 2026: Cash settlement at USD 3,105/tonne, warehouse stocks at 295,550 tonnes
- July 7, 2026: Cash settlement climbed to USD 3,119/tonne, stocks fell to 292,425 tonnes
- July 8, 2026: Stocks declined further to 290,825 tonnes as prices continued firming
- July 24, 2026: LME aluminium stocks fell to 271,275 tonnes, described as the lowest recorded level this century
- July 29, 2026: Stocks declined to 269,300 tonnes as the cash offer reached USD 3,207/tonne
Over roughly three and a half weeks, warehouse stocks contracted by more than 26,000 tonnes while cash offer prices climbed approximately 3.3%. This inverse relationship between exchange inventory and spot pricing is not coincidental — it is structural.
Why LME Warehouse Stocks Are Falling: The Inventory Mechanics
What LME Stocks Actually Represent
Not all aluminium sitting in LME-registered warehouses carries the same market significance. The total stock figure is divided into two categories that tell very different stories:
- Live warrants: Metal actively registered under LME contracts and available for trading or physical delivery. This is the effective liquid supply for exchange transactions.
- Cancelled warrants: Metal that owners have flagged for physical withdrawal from the warehouse system. Once cancelled, this metal is in the process of leaving exchange inventory entirely.
Cancelled warrants function as a leading indicator. A rising cancelled warrant figure signals that physical buyers are actively pulling metal away from exchange storage, suggesting real-world demand is absorbing supply faster than it is being replenished.
July 29, 2026 Inventory Breakdown
| Inventory Category | July 28, 2026 | July 29, 2026 | Change |
|---|---|---|---|
| Opening Stocks (total) | 271,275 tonnes | 269,300 tonnes | -0.73% |
| Live Warrants | 245,350 tonnes | 245,350 tonnes | Unchanged |
| Cancelled Warrants | 23,950 tonnes | 22,450 tonnes | -6.26% |
The 6.26% decline in cancelled warrants on a single day is a notable development. When cancelled warrants fall rather than rise, it can indicate that some previously flagged metal was re-warranted, meaning owners chose to return metal to tradeable status rather than proceed with physical removal. This may reflect short-term logistical decisions or a reassessment of delivery timing, and it does not necessarily signal a reversal of the broader drawdown trend given that total stocks continued to decline.
The "Lowest This Century" Context
To appreciate the significance of sub-270,000-tonne inventory levels, historical context is essential. During the post-global financial crisis era between 2009 and 2014, LME aluminium warehouse stocks exceeded 5 million tonnes at their peak. That environment was defined by warehouse financing trades, in which banks and commodity houses purchased physical metal, stored it cheaply, and profited from the steep contango premium on forward contracts.
The structural unwinding of those financing trades, combined with tightening LME warehouse rules governing load-out queues and rent caps, progressively cleared excess inventory through the mid-2010s. What remains today is fundamentally different in character: metal held in LME warehouses now more closely reflects genuine trading buffer stock rather than speculative financial inventory. This makes current low-stock readings a more meaningful signal of physical market tightness than equivalent low readings would have implied a decade ago.
When LME stocks were at multi-million-tonne levels in 2011 and 2012, the aluminium market was simultaneously experiencing an oversupply crisis. The same metric at sub-270,000 tonnes in 2026 reflects an entirely different market reality: genuine scarcity of immediately deliverable metal.
What Drives LME Aluminium Prices Beyond Daily Inventory Moves
Demand Drivers Reshaping the 2026 Consumption Landscape
The structural demand story for aluminium has evolved materially over the past decade. Notably, several growth vectors are now compounding simultaneously, and China metals demand remains a central driver of global consumption patterns:
- Electric vehicle production: Aluminium's role extends beyond battery enclosures into structural body components, crash management systems, and heat management applications. Each EV platform uses significantly more aluminium than its internal combustion equivalent.
- Grid infrastructure: Expanding transmission and distribution networks across North America, Europe, and Southeast Asia are consuming substantial volumes of conductor-grade aluminium, a segment that requires specific alloy specifications and consistent quality.
- Packaging sector: Sustainability-driven procurement is accelerating the substitution of plastics and other materials with aluminium in food and beverage packaging, supporting baseline demand even during periods of broader industrial softness.
Supply-Side Constraints Keeping the Market Tight
The demand picture is compounded by a supply environment that remains constrained across multiple geographies. In addition, leading aluminium mining companies are navigating a complex set of operational and regulatory pressures:
- European primary smelters continue to face elevated energy costs that make capacity restarts economically marginal, even at current aluminium price levels.
- Chinese production operates under environmental compliance requirements and periodic power allocation policies that limit the flexibility of domestic capacity expansion.
- Bauxite supply chain disruptions in key producing regions have periodically tightened alumina feedstock availability, adding cost pressure upstream of the smelting process.
The Alumina Price Signal and Its Implications
The LME alumina Platts benchmark standing at USD 337.38/tonne carries significant analytical weight. The alumina market impact on smelter economics is considerable, as alumina is the primary feedstock for primary aluminium smelting and its price directly determines the input cost structure for smelter margin calculations.
The general rule of thumb in the industry is that producing one tonne of aluminium requires approximately two tonnes of alumina. At current alumina pricing, feedstock costs represent a substantial portion of total production cost before energy, labour, and capital expenses are considered.
When alumina prices remain elevated relative to aluminium output prices, smelter margins compress. Historically, this margin compression has preceded production curtailments that eventually tighten primary aluminium supply, reinforcing upward pressure on LME cash prices over a multi-month lag period. This dynamic is not always immediate, but it is a reliable directional signal for traders monitoring production economics.
How the Asian Reference Price Differs From the Standard LME Cash Price
The LME Asian Reference Price of USD 3,180/tonne assessed on July 29, 2026, sits USD 27/tonne below the cash offer price of USD 3,207/tonne. This differential reflects the distinct liquidity conditions and demand dynamics that characterise Asian trading hours versus the primary London trading window.
The Asian Reference Price was developed specifically to serve physical market participants in the Asia-Pacific region who needed a benchmark aligned with their trading timezone. It is used to price term contracts, spot deals, and financing transactions across the region's substantial aluminium consumption base, which includes major manufacturing economies such as Japan, South Korea, India, and the ASEAN bloc.
When the Asian reference price trades at a premium to the LME cash price, it incentivises physical metal flows from Western warehouses toward Asian consumption centres, which can accelerate LME inventory drawdowns as metal exits exchange-registered storage for regional delivery. The current slight discount of the Asian reference price to the LME cash offer may reflect softer near-term demand in certain Asian markets, or simply the timing differential between assessment methodologies.
The next major ASX story will hit our subscribers first
What the Forward Curve Reveals About Market Expectations
Reading the Backwardation Structure
The July 29, 2026 forward curve presents a clear backwardated structure across all tenors. Consequently, the aluminium tariffs impact on trade flows has further complicated forward pricing dynamics in Western markets:
| Tenor | Offer Price (USD/tonne) | Implied Discount vs. Cash Offer |
|---|---|---|
| Cash | 3,207 | N/A |
| Three-Month | 3,177 | -30 |
| December 2027 | 3,118 | -89 |
This downward-sloping forward curve tells a specific story about market expectations. Participants are pricing the most acute supply tightness into the immediate delivery window, while expecting that physical conditions will ease over the medium to long term as new supply comes online or demand moderates seasonally.
Why Backwardation Changes Physical Behaviour
Backwardation is not merely a pricing phenomenon. However, it actively reshapes the behaviour of physical market participants in several important ways:
- Warehouse financing trades become uneconomical: The traditional strategy of buying spot, storing metal, and selling forward at a premium collapses when the forward price sits below spot. This removes a major source of artificial inventory accumulation from the market.
- Physical buyers accelerate procurement: Industrial consumers recognise that waiting to purchase metal will cost more today than buying forward at a discount. This creates pull-forward demand that further tightens near-term supply.
- Producers gain negotiating leverage: Backwardation shifts pricing power toward sellers of immediately available metal, allowing producers with spot inventory to command full cash-market prices without concession.
An important and less widely understood aspect of LME backwardation is that it creates a self-reinforcing cycle. As financing trades exit the warehouse, stocks fall. Falling stocks intensify backwardation. Intensified backwardation drives further warehouse drawdowns. This feedback loop can sustain tighter market conditions for longer than fundamental supply-demand models alone would predict.
Interpreting These Signals: Practical Implications for Physical Buyers and Hedgers
What Industrial Consumers Should Be Monitoring
The combination of rising cash prices, declining warehouse stocks, and a backwardated forward curve creates a challenging environment for industrial aluminium consumers. Several practical considerations emerge:
- Regional delivery premiums, which represent the cost of physically transporting metal from LME warehouses to the buyer's location, must be assessed alongside LME benchmark prices to determine the true total landed cost of metal.
- Procurement teams that have relied on opportunistic spot purchasing may find that available inventory has become insufficient to support that strategy as stocks approach historically thin levels.
- The backwardated structure technically offers cheaper long-dated hedging in nominal terms, with December 2027 contracts available at USD 3,118/tonne, which is USD 89/tonne below current spot. However, locking in that price assumes physical tightness will not intensify further, which carries its own risk.
Risk Scenario Framework
Any analytical assessment of the current market should incorporate a range of outcomes rather than a single directional forecast. For broader context, the global steel outlook provides a useful parallel for understanding how industrial metals markets respond to inventory and demand shifts:
| Scenario | Trigger Conditions | Price Implication |
|---|---|---|
| Bullish | Continued drawdowns below 250,000 tonnes; Asian demand acceleration | USD 3,400 to USD 3,500/tonne range |
| Neutral | Stocks stabilise between 265,000 and 275,000 tonnes; seasonal demand moderation | Prices consolidate near current levels |
| Bearish | Chinese export stimulus or smelter restarts replenish LME stocks | Spot price pressure eases, backwardation narrows |
This scenario framework is analytical in nature and does not constitute financial advice. Commodity markets are subject to significant uncertainty, and actual outcomes may differ materially from any projection.
Frequently Asked Questions: LME Aluminium Cash Offer Price and Warehouse Stocks
What is the LME aluminium cash offer price?
The LME aluminium cash offer price and warehouse stocks together form the core indicators traders and physical buyers monitor most closely. On July 29, 2026, the cash offer price was USD 3,207 per tonne, representing a 1.50% increase from the prior session.
Why do LME aluminium warehouse stocks matter to the broader market?
LME warehouse stocks represent the physical aluminium buffer available for delivery against exchange contracts. When this buffer contracts toward historically thin levels, as it did through July 2026, the market loses its primary shock absorber against sudden demand surges, amplifying spot price sensitivity to even modest supply disruptions. Tracking these trends over time provides critical context for understanding market cycles.
What is the practical difference between live warrants and cancelled warrants?
Live warrants represent metal that is actively registered under LME contracts and available for trading or physical delivery. Cancelled warrants represent metal whose owners have initiated the process of withdrawing it from the warehouse system entirely. Rising cancelled warrants are a leading indicator of imminent stock reductions, while a decline in cancelled warrants, as observed on July 29, may suggest delivery deferral or re-warranting of previously flagged metal.
How did LME aluminium stocks reach century-low levels in July 2026?
The decline to 271,275 tonnes on July 24, 2026 reflected a sustained combination of factors: the structural dismantling of warehouse financing trades that had inflated stocks during the post-GFC era, persistent physical demand absorption from multiple end-use sectors, supply-side constraints in key producing regions, and a backwardated forward curve that actively discouraged new inventory accumulation.
What does the alumina Platts price of USD 337.38/tonne signal?
Elevated alumina prices compress the production economics for primary aluminium smelters, particularly those operating in high-energy-cost environments. When smelter margins are squeezed by rising feedstock costs, production curtailments become increasingly likely over a multi-month horizon, which can progressively tighten primary aluminium supply and reinforce upward pressure on LME cash prices.
Key Takeaways: LME Aluminium Market Conditions as of Late July 2026
- Cash offer price: USD 3,207/tonne on July 29, 2026, a 1.50% single-session gain
- Warehouse stocks: 269,300 tonnes, near century-low levels following weeks of sustained drawdown
- Market structure: Backwardated forward curve with spot commanding an USD 89/tonne premium over December 2027 contracts
- Cancelled warrants: Declined 6.26% to 22,450 tonnes, suggesting some near-term delivery deferral or re-warranting activity
- Asian reference price: USD 3,180/tonne, reflecting active regional demand participation during Asian trading hours
- Alumina cost benchmark: USD 337.38/tonne, sustaining smelter margin pressure across high-cost production regions
- July 2026 trend: More than 26,000 tonnes withdrawn from LME registered stocks over approximately three and a half weeks, while cash prices gained roughly 3.3%
This article is intended for informational and educational purposes only. It does not constitute financial, investment, or commodity trading advice. Readers should conduct independent research and consult qualified professionals before making any trading or procurement decisions based on commodity market analysis.
Want to Capitalise on the Next Major Commodity Discovery Before the Market Moves?
While LME aluminium pricing mechanics reveal how physical tightness drives spot price surges, the most significant returns often emerge at the exploration stage — Discovery Alert's proprietary Discovery IQ model delivers real-time alerts on significant ASX mineral discoveries, including aluminium and other critical commodities, turning complex data into actionable insights the moment announcements hit the exchange. Explore historic examples of exceptional discovery returns and begin your 14-day free trial at Discovery Alert to position yourself ahead of the broader market.