
July 22, 2026
Maritime Energy Corridors: Critical Infrastructure in an Interconnected World
Global energy systems operate through an intricate network of maritime passages that determine the flow of resources from extraction sites to consumption centers. These strategic waterways represent fundamental infrastructure components where geography intersects with geopolitics, creating vulnerability points that can influence energy markets worldwide. Understanding how oil and gas supply disruptions in the Strait of Hormuz cascade through these systems requires examining the complex interdependencies between regional production capabilities, transportation networks, and international market dynamics.
Energy security frameworks increasingly recognise that physical infrastructure constraints can amplify market volatility beyond traditional supply-demand calculations. Maritime chokepoints, in particular, concentrate massive energy flows through narrow geographical boundaries, creating scenarios where localised incidents can generate global consequences. This concentration effect transforms regional political tensions into systemic market risks that affect pricing mechanisms, supply chain logistics, and strategic planning across multiple continents.
When big ASX news breaks, our subscribers know first
Geographic Positioning and Strategic Significance of Critical Energy Transit Routes
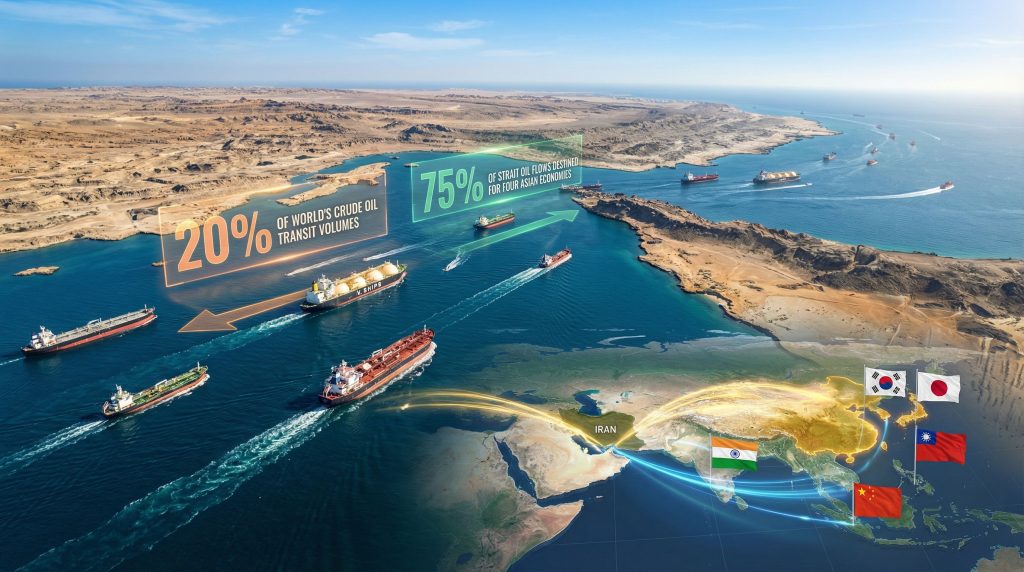
The Strait of Hormuz represents one of the most strategically important maritime passages for global energy transportation. Located between Iran and the Arabian Peninsula, this narrow waterway connects Persian Gulf energy producers with international markets through shipping lanes that measure only two miles wide in each direction. Despite these constrained dimensions, approximately 20 percent of global crude oil and significant volumes of liquified natural gas transit through this corridor daily.
This geographical bottleneck serves as the primary export route for major Middle Eastern energy producers, including Saudi Arabia, Iraq, and Iran. For liquified natural gas specifically, the strait represents the only viable maritime route for Qatari and United Arab Emirates exports to reach global markets. The concentration of energy flows through such a narrow passage creates inherent vulnerabilities that extend far beyond regional boundaries.
Key Transit Volume Statistics:
- Daily oil flows: Approximately 21 million barrels
- Annual LNG volumes: Over 100 million tons
- Regional producer dependency: 85% of Gulf state energy exports
- Global market exposure: 20% of worldwide oil consumption
Asian Market Dependencies and Vulnerability Assessments
Energy import patterns reveal significant concentration risks for Asian economies, with four major nations accounting for substantial portions of strait transit volumes. China and India represent the largest single destinations for energy resources flowing through this corridor, while Japan and South Korea maintain critical dependencies that classify them as highly vulnerable to supply disruptions.
Regional Energy Flow Distribution:
| Destination | Oil Dependency (%) | LNG Dependency (%) | Strategic Risk Level |
|---|---|---|---|
| China | 45% of strait flows | 25% of strait flows | Critical |
| India | 30% of strait flows | 20% of strait flows | Critical |
| Japan | 15% of strait flows | 30% of strait flows | Severe |
| South Korea | 10% of strait flows | 25% of strait flows | Severe |
These dependency patterns reflect broader energy import strategies where Asian economies rely heavily on Middle Eastern production to meet domestic consumption requirements. Japan faces particularly acute vulnerability due to limited domestic energy resources and nuclear capacity constraints following policy adjustments in recent decades. Furthermore, South Korea similarly maintains high import dependencies while lacking significant strategic reserve capabilities.
Economic modelling indicates that extended disruptions could impact regional GDP growth by 0.5 to 1.2 percentage points across affected Asian markets, with manufacturing-intensive economies experiencing proportionally greater effects due to energy input costs.
Supply Chain Cascade Mechanisms During Maritime Disruptions
Energy supply disruptions propagate through interconnected market systems via multiple transmission mechanisms that amplify initial shocks. Primary effects manifest immediately through spot market price adjustments, while secondary impacts emerge through industrial cost structures, transportation networks, and consumer pricing mechanisms.
Immediate Market Response Patterns:
- Crude oil price volatility increases of 15-25% above baseline levels
- LNG spot market fluctuations ranging from 30-50%
- Shipping rate premiums for alternative routing options
- Strategic reserve activation across importing nations
- Emergency supply coordination protocols implementation
Secondary cascade effects develop as energy cost increases transmit through supply chains, affecting manufacturing competitiveness, logistics expenses, and consumer purchasing power. Industries with high energy intensity experience disproportionate impacts, potentially leading to production adjustments or temporary facility shutdowns in extreme scenarios. Moreover, our oil price rally analysis demonstrates how these disruptions can interact with other market forces.
Insurance markets respond rapidly to heightened maritime risks through war risk premium adjustments and coverage modifications. Commercial shipping companies implement risk assessment protocols that can influence vessel routing decisions, further constraining available transportation capacity during crisis periods.
Alternative Infrastructure and Routing Capabilities
Pipeline infrastructure provides limited alternatives to maritime transportation for Gulf region energy exports. The Trans-Arabian Pipeline system and East-West Pipeline through Saudi Arabia offer some capacity diversification, but combined throughput remains significantly below maritime volumes. Technical specifications indicate maximum pipeline capacity of approximately 5 million barrels per day, representing less than 25% of typical strait transit volumes.
Maritime Alternative Routes:
Extended routing through the Cape of Good Hope adds 14-21 days to transit times while increasing transportation costs by approximately 15-20% per barrel equivalent.
- Cape of Good Hope routing: Additional 6,000 nautical miles
- Transit time extension: 14-21 days depending on vessel specifications
- Capacity constraints: Limited tanker availability for extended routes
- Cost implications: 15-20% increase in per-barrel transportation expenses
LNG supply chains face particular challenges during maritime disruptions due to specialised vessel requirements and destination-specific infrastructure compatibility. Regional LNG terminal capacity constraints limit rapid supply source switching, whilst long-term contract obligations create additional complexity for emergency supply coordination.
Geopolitical Risk Amplification Factors
Regional military capabilities and strategic positioning create multiple scenarios for supply disruption escalation. Iran's geographical advantages include coastal positioning along critical shipping lanes and naval assets capable of influencing commercial traffic patterns. However, international response mechanisms involve coalition naval operations, diplomatic engagement protocols, and coordinated economic measures. The Strait of Hormuz crisis demonstrates these complex geopolitical dynamics.
Military security considerations extend beyond direct conflict scenarios to include insurance market responses, commercial shipping risk assessments, and international maritime law applications. War risk insurance premiums can increase by 200-400% during heightened tension periods, effectively pricing some commercial operations out of feasible cost structures.
Escalation Risk Factors:
- Regional proxy conflict expansion
- Sanctions enforcement mechanisms
- Naval incident escalation protocols
- Commercial shipping safety assessments
- International coalition response coordination
How Do Trade Tensions Amplify Energy Market Disruptions?
The relationship between oil and gas supply disruptions in the Strait of Hormuz and broader trade tensions creates compounding effects on global markets. In addition, the US-China trade war impact demonstrates how multiple geopolitical pressures can simultaneously affect energy markets.
Consequently, tariffs' investment impact shows that trade policy changes can alter energy demand patterns, making disruptions more severe. For instance, reduced industrial activity from trade tensions can initially dampen energy demand, but supply disruptions during such periods create even greater price volatility.
The next major ASX story will hit our subscribers first
Strategic Reserve Management and Emergency Response Protocols
International Energy Agency coordination mechanisms provide frameworks for managing supply disruptions through strategic petroleum reserve releases and market stabilisation interventions. Member countries maintain reserve capabilities equivalent to 90 days of net imports, though release coordination requires consensus building that can delay response implementation.
Emergency allocation protocols involve bilateral energy security agreements and regional cooperation frameworks. ASEAN energy partnership mechanisms enable limited supply sharing, while G7 coordination provides broader international response capabilities during extended disruption scenarios. Furthermore, oil price movements analysis reveals how coordinated responses can stabilise volatile markets.
Reserve Management Parameters:
- Strategic release volumes: 1-2 million barrels per day globally
- Coordination timeframes: 7-14 days for implementation
- Replenishment strategies: Market-based purchase programmes
- Regional cooperation: Bilateral sharing agreements activation
Insurance Market Adaptations and Commercial Shipping Responses
Maritime insurance markets employ sophisticated risk assessment models that incorporate geopolitical analysis, historical incident data, and real-time security intelligence. War risk premiums adjust dynamically based on threat assessment levels, with coverage exclusions potentially activated during active conflict periods.
Commercial shipping companies maintain fleet positioning strategies designed for rapid route adjustments during crisis scenarios. Decision matrices incorporate risk-reward calculations, alternative cargo routing economics, and customer contract force majeure provisions. These operational frameworks enable relatively swift responses to changing security conditions whilst maintaining commercial viability.
Insurance Market Adjustments:
- Base war risk premiums: 0.05-0.1% of cargo value
- Crisis period increases: 0.5-1.0% of cargo value
- Coverage exclusion triggers: Active military engagement
- Alternative routing coverage: Extended transit insurance
What Economic Factors Compound Crisis Responses?
The broader economic environment significantly influences how markets respond to oil and gas supply disruptions in the Strait of Hormuz. Moreover, the US economy & tariffs analysis shows that existing inflationary pressures can amplify the economic impact of energy supply shocks.
Consequently, when economies already face debt burdens and inflationary pressures, energy disruptions create more severe systemic effects than during stable economic periods.
Economic Modelling for Extended Disruption Scenarios
Comprehensive economic analysis reveals differentiated impacts across various disruption duration scenarios. Short-term disruptions lasting 1-3 months primarily affect spot market pricing and immediate supply chain adjustments. Extended scenarios of 6-12 months generate structural market changes, industrial production shifts, and accelerated energy transition investments.
Economic Impact Projections:
| Duration | Oil Price Impact | GDP Effect (Asia) | Inflation Increase | Market Recovery |
|---|---|---|---|---|
| 1-3 months | +15-25% | -0.2-0.5% | +0.3-0.7pp | 6-12 months |
| 6-12 months | +25-40% | -0.8-1.5% | +1.0-2.0pp | 18-24 months |
| 12+ months | +40-60% | -1.5-3.0% | +2.0-3.5pp | 24-36 months |
Recovery timeline modelling indicates that market normalisation periods extend well beyond actual disruption resolution due to supply chain reconfiguration, contract renegotiation cycles, and infrastructure investment adjustments. Trust rebuilding in maritime security typically requires 12-18 months of stable operations before shipping patterns return to pre-disruption configurations.
Long-term Resilience Building Through Infrastructure Diversification
Energy market resilience strategies increasingly focus on infrastructure diversification investments that reduce chokepoint dependencies. Pipeline capacity expansion projects, alternative LNG terminal development, and renewable energy acceleration programmes represent structural approaches to vulnerability mitigation.
Regional energy trading hub development enables more flexible supply source management whilst cross-border grid interconnection projects provide additional supply diversity options. Energy storage technology deployment offers short-term supply buffering capabilities, though current capacity remains limited relative to extended disruption scenarios.
Infrastructure Investment Priorities:
- Pipeline network expansion and interconnection
- LNG terminal capacity increases in alternative locations
- Regional renewable energy grid integration
- Strategic storage facility development
- Emergency fuel switching infrastructure
Market structure adaptations include flexible contract terms for supply disruption scenarios, regional energy cooperation agreement strengthening, and emergency response protocol refinement. These systematic approaches aim to reduce both the probability and potential impact of future supply disruption events whilst maintaining energy security across diverse consumption centres.
Disclaimer: This analysis contains forward-looking assessments based on current market conditions and historical patterns. Actual outcomes during supply disruption scenarios may vary significantly based on geopolitical developments, market responses, and coordination effectiveness. Readers should consider multiple risk scenarios when evaluating energy security implications.
Concerned About Energy Market Volatility From Geopolitical Disruptions?
Discovery Alert's proprietary Discovery IQ model instantly identifies mining and exploration opportunities that can benefit from commodity price volatility caused by global supply disruptions. Stay ahead of market movements with real-time alerts on significant ASX mineral discoveries that could capitalise on energy sector turbulence and commodity price shifts.

